Field Notes - Tygart Media

Category: Field Notes

Shorter notes from the work, filed separately from the full guides.

  • The Honest Caveats: What Opportunity Zones Got Wrong, and What 2.0 Fixed

    The Honest Caveats: What Opportunity Zones Got Wrong, and What 2.0 Fixed

    This is part of the series that starts with Inside the Line: Puyallup’s Opportunity Zone, Explained Like It Matters. The other pieces make the case — the math, the map, the hospital, the housing, the businesses. This piece is the one that makes the rest believable: everything the first version of this program got wrong, stated plainly.

    A series that only cheers for its subject is advertising. This tract deserves a chronicler, not a cheerleader — and the credibility of everything else on this site rests on this page being as honest as the others are enthusiastic.

    So: Opportunity Zones 1.0 had real failures. Some were design flaws Congress has now fixed. Some were not flaws at all, but the predictable behavior of capital given weak instructions. And some are still waiting, unfixed by any statute, for local people to decide.

    What 1.0 actually did

    The scale was real: an estimated $100 billion of equity moved into roughly 5,600 neighborhoods under the first program — one of the largest place-based capital flows in American history. The Astor and The Moraine, ten miles from the tract, are what the good version looked like: a landmark saved, workforce housing built.

    But the distribution was the scandal. One widely cited program review (Columbia Threadneedle’s analysis of the first era) found that more than a quarter of the equity raised landed in the top sliver of neighborhoods by measures of existing advantage — places whose recovery was already underway before the designation arrived. Critics catalogued the product mix that followed: luxury apartments, hotels, and self-storage facilities wearing a distressed-community incentive. Every state had its example of a zone drawn around a neighborhood that plainly didn’t need the help.

    The mechanism behind the skew is worth understanding, because it’s the thing to watch here. Governors in 2018 could nominate tracts merely adjacent to qualifying low-income tracts — the contiguous-tract rule. Money, being money, preferred the safest version of eligible: the tract next to the hot neighborhood rather than the genuinely struggling one. The incentive paid the same either way, so it bought the safer thing.

    And over it all sat a quieter failure: 1.0 required almost no reporting. Funds self-certified, and the public record of what the money built, whom it employed, and who benefited stayed thin for years. That vacuum served nobody well — it let boosters claim miracles without evidence and critics claim pure giveaway without it either. A program this size, running on this little data, was a choice, and it was the wrong one.

    What 2.0 fixed — genuinely

    The 2025 law reads, in places, like a point-by-point reply to the critics:

    • Tighter eligibility. The income test dropped from 80% to 70% of area median family income (or a 20% poverty rate with its own income cap). Fewer tracts qualify — roughly 6,500 expected nationally, down from 8,764.
    • The side door is closed. No more contiguous-tract nominations. Every tract qualifies on its own numbers. This is the single most important repair in the law, because it removes the mechanism that produced the worst headlines.
    • A cap with teeth. Governors may nominate only up to 25% of their eligible tracts — scarcity that forces actual prioritization. Washington’s 152-applications-for-99-slots process is what that looks like in practice.
    • Reporting is now law. Funds must report their holdings and activity in a structured way, so the 2.0 era can be argued from records instead of impressions.
    • The map expires. Designations now renew every ten years. A tract that no longer needs help doesn’t keep the incentive forever, and a newly struggling one isn’t locked out for a generation.
    • The deferral cliff is gone. The rolling five-year deferral (see the money piece) removes the decaying-incentive problem that distorted 1.0’s later years.

    Puyallup’s tract is a creature of the repaired rules: it qualified at the stricter test, on its own numbers, through a competitive state process. That does not make it virtuous. It makes it eligible under a better-designed screen. The distinction matters, and this series will keep making it.

    What no statute can fix

    Here is the part that lands on us.

    The incentive pays gain-holders, first and always. The direct beneficiary of every Opportunity Zone dollar is an investor with a capital gain. The community’s return — jobs, housing, services, tax base — is a downstream consequence of what that money builds. A program designed this way can be a powerful development tool; it cannot be a direct anti-poverty program, and judging it as one guarantees disappointment. Judge it instead on the buildings and businesses: are they the ones the tract needed?

    Success has a price, and the price is rent. If the corridor works — hospital growing, housing building, businesses opening — land and housing costs inside and around the tract rise. That is what success looks like in a market, and it squeezes the very residents the eligibility numbers describe. No provision of §1400Z-2 manages that. Local tools do: the affordability layering in the housing piece (the Addison Grove model), permitting choices, and whether anyone in authority is watching the rent line as carefully as the investment line. This series will watch both.

    Product choice is local. The tax code cannot distinguish a workforce apartment building from a storage facility with the same return profile. People can. The City’s announced outreach phase, the projects owners choose to bring, and the public’s attention are the actual quality control. Towns that treated their zones as spectator sports got spectator results.

    The watch list for this tract

    So the series ends its caveats where it will spend the next ten years: watching specifics. For tract 53053073405, the questions that matter, in order:

    • What is the first project — its product type, its rent or price point, its employer count? The first announcement sets the tract’s tone for every funder watching.
    • Do local owners sell, partner, or build? Each path puts the value in different hands.
    • Does any operating business get funded, or only buildings? The least-used door is the jobs test.
    • When 2.0’s reporting starts publishing, what does the fund-level record for this tract actually say? We will read it here, in public, against this page’s questions.
    • What happens to rents in and around the tract as investment lands? The success metric and the warning light are the same number, read carefully.

    The first program’s honest verdict is: powerful tool, loosely aimed, poorly measured. The second program fixed the aim and the measuring. What it cannot fix is whether the people in the place are paying attention.

    In this town, at least, somebody is. That’s the whole point of the record we’re keeping on the hub.

    Sources: Opportunity Zone 1.0 capital estimates (~$100B across ~5,600 neighborhoods) via City of Spokane / Spokane Journal of Business reporting; Columbia Threadneedle Opportunity Zones program review (concentration of equity in advantaged neighborhoods); OZ 2.0 reforms under P.L. 119-21 §70421 as summarized by the Federal Reserve Community Development function and the 2026 Opportunity Zones Handbook (70% AMI test, contiguous-tract removal, 25% nomination cap, decennial remap, fund reporting). This article is general information, not tax, legal, or investment advice.
  • The Business Play: The Opportunity Zone Door Nobody Walks Through

    The Business Play: The Opportunity Zone Door Nobody Walks Through

    This is part of the series that starts with Inside the Line: Puyallup’s Opportunity Zone, Explained Like It Matters, alongside The New Opportunity Zone Math, Between Two Growth Centers, The Hospital Play, and The Housing Play. This piece covers the door almost nobody walks through: the zone funds businesses, not just buildings.

    Ask a room of business owners what an Opportunity Zone is and you’ll hear about apartment buildings. The real estate story ate the whole program’s public image — partly because buildings are easy to photograph, and partly because most funds found property easier to underwrite than companies.

    But the statute has a second door, and for a tract anchored by a growing hospital, it may be the more important one: a Qualified Opportunity Fund can buy equity in an operating business inside the zone — a Qualified Opportunity Zone Business. Growth capital, from investors whose tax benefit requires them to stay for ten years, for companies that locate and operate inside the line.

    How a business qualifies, in plain English

    The rules are real, and they are tests, not vibes. Reduced to their working core, an operating business qualifies when:

    • Its tangible property is in the zone. At least 70% of the business’s tangible property — owned or leased — must be qualified zone business property: property acquired after 2017 (and, under 2.0, aligned to the new designation period), used in the zone, and either new or substantially improved.
    • Its income is earned in the zone. At least 50% of the business’s gross income must come from the active conduct of the business inside the zone. A company can’t just rent a mailbox in the tract and operate in Bellevue.
    • It is actually a business. Less than 5% of its assets can sit in stocks, bonds, and other nonqualified financial property (ordinary working capital and reasonable reserves aside), a substantial portion of any intangible property must be used in the zone’s active conduct, and the statute excludes a short list of “sin” categories — golf courses, gambling facilities, liquor stores, and their relatives need not apply.
    • The fund’s money works on a clock. Businesses get a working-capital safe harbor — up to 31 months under a written plan to deploy the capital — which is the provision that makes expansions and build-outs practical instead of theoretical.

    An owner reading that list will notice something: these tests describe a business that is genuinely there — property there, income there, operations there. That is not a loophole shape. That is the program working as designed.

    Why almost nobody uses this door

    Three honest reasons. First, funds are mostly built by real estate people; underwriting an operating company’s management and market is a different skill than underwriting a building, and most QOF platforms never acquired it. Second, the compliance testing is ongoing — a building stays qualified by standing there, while a business must keep passing its tests as it operates, hires, and grows. Third, the deal sizes are often smaller than fund economics prefer.

    The result is a strange gap: the program’s most job-creating mechanism is its least used. For Puyallup, that gap is an opportunity, because the tract’s demand story — a $430 million hospital expansion — generates business demand that buildings alone don’t answer.

    The businesses this tract is actually calling for

    Read the hospital’s ecology as a business list, because that is what it is:

    • Healthcare services around the campus — home health agencies, outpatient therapy, imaging and lab services, durable medical equipment, medical staffing. Businesses whose customers and referral sources are a short drive from the tract, whose workforce is local, and whose income is earned where their people work.
    • Childcare built for shift work — an operating business (not just a building) serving the hospital’s three-shift workforce, the single most-cited unmet need around every growing hospital campus in America.
    • Trades and light production — the corridor’s existing commercial fabric is full of service businesses, fabricators, and suppliers positioned between the Port of Tacoma’s freight economy and the South Hill retail engine; expansion-stage companies in that fabric are natural candidates for growth equity that doesn’t come with a bank’s five-year leash.
    • Food and daily services — the unglamorous, durable layer that a campus population of staff, patients, and visitors supports around the clock.

    What it means for an owner

    For a business owner inside the tract — or one willing to locate a real operation there — the QOF structure offers something bank debt doesn’t: equity whose owners are rewarded for staying. The fund’s full tax benefit requires a ten-year hold, which makes its capital structurally patient. The trade is real, too: equity means dilution and a partner, where debt means payments and a deadline. Which one fits depends on the business, the growth plan, and the owner’s appetite for company.

    The realistic paths in:

    • Expansion capital. An existing Pierce County business opens its growth location — second site, larger facility, new service line — inside the tract, structured so the fund’s equity funds the expansion entity.
    • Relocation with substance. A business moves real operations — property, people, income — into the zone and raises fund equity against the move and build-out.
    • Founder-stage location. A new business in the hospital’s service ecology chooses the tract as its home base from day one, raising patient equity instead of stacking early debt.

    Each path needs the same unglamorous first steps: confirm the address is inside tract 53053073405 on the official map, and structure the entity with counsel and a CPA who has actually read §1400Z-2 — before money moves, not after. The tests are passable; they are not forgiving of improvisation.

    The number that keeps this honest

    Nationally, the overwhelming share of the estimated $100 billion that flowed through Opportunity Zone 1.0 went to real estate. The business door stood open the whole time, comparatively unused. If Puyallup’s tract ends up funding even a handful of operating companies — employers, not just addresses — it will have used the program better than most of the map did.

    Buildings are what the zone is famous for. Businesses are what a town actually runs on. The scoreboard on the hub has a line waiting for the first one.

    Sources: IRC §1400Z-2 and QOZ Business requirements as summarized in the 2026 Opportunity Zones Handbook (70% tangible property test; 50% of gross income from active conduct in the zone; under 5% nonqualified financial property; excluded business categories; 31-month working capital safe harbor); Opportunity Zones 2.0 provisions under P.L. 119-21; Opportunity Zone 1.0 capital estimates (~$100B, predominantly real estate) via industry and city reporting. This article is general information, not tax, legal, or investment advice.
  • The Housing Play: Three Pierce County Models, One Obvious Next Site

    The Housing Play: Three Pierce County Models, One Obvious Next Site

    This is part of the series that starts with Inside the Line: Puyallup’s Opportunity Zone, Explained Like It Matters, alongside The New Opportunity Zone Math, Between Two Growth Centers, and The Hospital Play. This piece is housing — and unlike most housing commentary, every model in it is a real building within ten miles of the tract.

    Housing is where Opportunity Zone money does its most visible work, and its most argued-about. It is also where Pierce County has an unusual advantage in this conversation: we don’t have to speculate about what OZ housing looks like. It is already built here, in two different flavors — and Puyallup itself just proved it can close a sophisticated housing deal in 90 days.

    Three buildings. Three capital models. One obvious next site.

    Model one: The Astor — the historic conversion (Tacoma)

    In downtown Tacoma, the Washington Building stood as a 1925 office tower, a landmark running out of economic lives. Unico Properties partnered with Pinnacle Partners — a firm that exists specifically to invest Qualified Opportunity Zone funds — and converted it into The Astor: 156 apartments, delivered in July 2022.

    The lesson for Puyallup is the mechanism. Adaptive reuse of an existing building under OZ rules runs on the substantial improvement test: within 30 months, the project must invest at least as much in improving the building as the building itself was worth (its basis, excluding the land). Buy a tired building for a basis of $800,000 and the rule requires another $800,000-plus of real construction into it. The rule is why OZ money loves sturdy old shells — the incentive literally pays for resurrection, not cosmetics.

    The tract between Downtown and South Hill has exactly this kind of stock: older commercial buildings with good bones and tired economics. The Astor is the proof, fifteen minutes away, that QOZ capital will underwrite their second lives.

    Model two: The Moraine — workforce housing, new build (Tacoma Hilltop)

    On Tacoma’s Hilltop, Ethos Development and Catalyst Opportunity Funds built The Moraine: 160 units of workforce housing — new construction, aimed at the people who staff a city’s hospitals, schools, and services rather than at the top of the rent market. It won CoStar’s 2025 Multifamily Development of the Year for the Seattle market.

    Workforce housing is the product OZ 2.0’s redesign quietly favors: the tightened eligibility tests push funds toward tracts with genuine need, and the new reporting requirements mean the “who lives there” question now gets asked in public. The Moraine shows the product can also be the best building in its market — workforce rents and an award-winning project are not a contradiction.

    For Puyallup, connect this model to the hospital play: Good Samaritan’s expansion will hire in waves for twenty years. Those hires are the Moraine’s tenant profile, and housing built for them — near the campus, at workforce rents — is the tract’s most defensible residential thesis.

    Model three: Addison Grove — the 90-day close (Puyallup, not OZ)

    The third building is the one skeptics should sit with. Addison Grove, right here in Puyallup, is 102 apartments for families earning 50–80% of area median income (90 of the 102 homes are reserved below 60% of AMI), developed by Great Expectations. It is not an Opportunity Zone project — its engine is the Washington Family Housing Fund, created by Ballmer Group with the Washington State Housing Finance Commission, which put in a $13.41 million subordinate forgivable loan. From application to closing: 90 days.

    Addison Grove matters to this series for three reasons. First, it proves Puyallup’s machinery works — land, entitlements, and a sophisticated capital stack, executed fast. Second, it proves local absorption: affordable and workforce product here leases into real demand, not projections. Third, it sets the honest contrast: where OZ equity is return-seeking capital that needs the math in the money piece to work, the Family Housing Fund is concessionary capital that optimizes for affordability per dollar. Different engines, both real.

    How the three models stack over one tract

    The mistake is treating these as competitors. Over a ten-year designation, a healthy tract uses all three:

    • Conversions (Astor model) for the older buildings the substantial-improvement rule fits — QOZ equity, market and workforce rents, historic fabric saved instead of scraped.
    • New workforce buildings (Moraine model) on the vacant and underutilized parcels the City’s application emphasized — QOZ equity again, aimed at the hospital-and-corridor workforce.
    • Layered affordable projects (Addison Grove model) where deeper affordability is the goal — concessionary and public capital in the stack, with OZ equity able to sit alongside other sources where a project is structured for it.

    That layering point is the one honest housing economists insist on, and this series will too: tax-advantaged equity on its own generally underwrites market and workforce rents. The deeper affordability — the 50–60% AMI homes — usually arrives when other capital takes the subordinated, patient position, exactly as the Family Housing Fund did. OZ 2.0’s reporting makes it harder to blur that distinction, which is a feature.

    What would actually get built first

    If the Pierce County record is the guide, the tract’s first housing moves are the Astor and Moraine plays, not the mega-project: an older building with the right basis math, converted; a vacant parcel near the corridor, built to workforce rents; both marketed to the workforce the hospital is hiring and the two growth centers already employ.

    The demand is documented — a 249-bed regional shortfall being built against, two designated growth centers, a fair that imports a million visitors a year past these blocks. The models are standing ten miles apart, visible from the freeway. The capital mechanism switches on January 1, 2027.

    What Puyallup adds, when the first project is announced, gets recorded on the hub’s scoreboard — which today still reads zero, and won’t for long.

    Sources: Unico Properties (The Astor — 156 units, Washington Building adaptive reuse with Pinnacle Partners, delivered July 2022); Catalyst Opportunity Funds (The Moraine — 160 workforce units with Ethos Development; CoStar 2025 Multifamily Development of the Year, Seattle market); Propmodo / Puget Sound Business Journal (Addison Grove — 102 units at 50–80% AMI, Washington Family Housing Fund $13.41M subordinate forgivable loan, 90-day close, developer Great Expectations); IRS/IRC §1400Z-2 substantial improvement standard (100% of building basis ex-land within 30 months, urban). This article is general information, not tax, legal, or investment advice.
  • The Hospital Play: What a $430 Million Expansion Builds Around Itself

    The Hospital Play: What a $430 Million Expansion Builds Around Itself

    This is part of the series that starts with Inside the Line: Puyallup’s Opportunity Zone, Explained Like It Matters, alongside The New Opportunity Zone Math and Between Two Growth Centers. This piece is the engine: the hospital at the tract’s edge, and everything its expansion pulls into being around it.

    Every successful development district has an engine — something that generates demand on a schedule nobody has to guess at. Factories close. Retail follows rooftops, and rooftops follow fashion. But a hospital expansion is different: it is a twenty-year construction program bolted to a demographic certainty.

    Tract 53053073405’s engine is already permitted. That is what makes this tract different from the thousands of zones on the new national map whose boosters are still hoping an anchor shows up.

    The anchor: Good Samaritan’s twenty-year build

    MultiCare Good Samaritan Hospital is working through a 20-year master plan for its Puyallup campus. The Puyallup City Council authorized the development agreement for it on January 27, 2026 — the legal chassis that lets a project of this size phase over two decades.

    The centerpiece is a patient care tower budgeted at more than $430 million: 160 new licensed inpatient beds, plus 30 observation beds, plus a shelled floor built to hold 40 more beds when the region needs them. The wider program around the tower includes parking structures, medical office buildings, and a central support tower.

    And the demand side is not a developer’s projection. MultiCare’s own planning says the region will need 249 additional hospital beds by 2036. East Pierce County is growing, aging, and currently sending patients elsewhere. The tower is the system catching up — with a shelled floor that admits, in concrete, that even this build may not be the last one.

    Why a nonprofit anchor still powers a tax-incentive play

    Here is the part that confuses people: MultiCare is a nonprofit. Its tower does not need Opportunity Zone equity, and the hospital campus itself is not the OZ project. Some readers stop there and conclude the hospital is irrelevant to the zone.

    That gets the economics backwards. The incentive doesn’t need the anchor to be investable. It needs the anchor to be certain. A Qualified Opportunity Fund deciding where to place ten-year money is underwriting one question above all others: will demand still be there in year ten? A permitted, phased, $430-million hospital program — driven by a documented regional bed shortage — is about the strongest answer that question ever gets.

    The hospital is the sun. The zone projects are what grows in its light.

    What a hospital expansion actually demands around it

    A tower with 190 new beds and observation units runs on hundreds of people across three shifts, and it pulls an entire service ecology in behind it. Each item below is a category of private, for-profit development — the kind QOF capital exists to fund — that hospital growth makes necessary rather than speculative:

    • Medical office buildings. Physician groups, clinics, imaging, labs, and outpatient specialists cluster next to the hospital they refer into. The master plan itself names medical office buildings in its program — the hospital knows its own gravity. Private MOB development adjacent to a growing campus is one of the oldest, steadiest plays in healthcare real estate.
    • Workforce housing. Hospitals hire in waves — nurses, techs, therapists, support staff — and they hire people who work nights and need to live close. A workforce that cannot find housing within a sane commute is a recruiting problem the hospital cannot solve alone. Housing aimed at the hospital workforce is the tract’s most natural residential product, ahead of generic apartments.
    • Childcare built for shift work. Standard childcare runs banker’s hours; hospitals run 12-hour shifts starting before dawn. Early-opening, extended-hour childcare near a major hospital campus serves a captive, desperate customer base — and childcare businesses can themselves be qualified zone businesses, not just real estate.
    • Post-acute and rehab services. Discharged patients need skilled nursing, outpatient physical and occupational therapy, home health, and durable medical equipment. A bigger hospital discharges more patients into exactly these services, which prefer to locate minutes from the discharge door.
    • Travel-clinician and family lodging. Hospitals run partly on traveling clinicians who need furnished mid-term housing, and on patients’ families who need to stay near a long admission. Both are quiet, durable demand streams that generic market studies miss.
    • The daily-services layer. Food that serves a night shift, pharmacies, fitness and recovery, parking, and the small retail that a campus population of staff, patients, and visitors supports around the clock.

    Read that list against the tract the City described in its application — underutilized and vacant properties, established commercial areas, transportation connections — and the fit is obvious. The corridor does not need to invent a purpose. It needs to house the ecology of the institution already expanding beside it.

    The phasing advantage: a twenty-year ramp meets a ten-year clock

    Most development incentives fight a timing problem: the money must deploy fast, but demand arrives slowly. This tract inverts it.

    The Opportunity Zone benefit peaks at a ten-year hold. The hospital’s master plan runs twenty years. The zone investor’s clock sits comfortably inside the anchor’s construction and staffing ramp — the tower rising, beds licensing in phases, the shelled floor waiting as documented future demand. A project that opens alongside an early hospital phase gets a decade of the anchor still growing around it.

    There is a subtler point for the City’s outreach phase: because the demand is phased, the tract’s projects can be phased too. Medical office first, while the tower is under construction. Workforce housing timed to hiring waves. Services as the patient volume lands. Nobody has to bet the whole tract on a single opening day.

    The honest cautions

    Hospital timelines slip — construction costs, certificate-of-need processes, and system capital priorities have delayed bigger plans than this one, and a master plan is a framework, not a promise that every element lands on schedule. The development agreement and the bed-need projection make this anchor as solid as anchors get, but “solid” is not “guaranteed.”

    And the anchor’s gravity does not move parcels by itself. The surrounding projects still need owners willing to sell or build, developers willing to structure funds, and the City’s ordinary permitting to do its work. What the hospital changes is the risk math for everyone deciding — which, for ten-year money, is most of the decision.

    The zone maps in America are full of tracts whose story is hope. This one’s story is a construction schedule, a bed count, and a shelled floor poured for patients who haven’t arrived yet. Of all the pads in this series, the hospital play is the one whose demand you can read off a planning document — which is exactly why sophisticated capital reads planning documents.

    The same build, through two other lenses: the facilities version — Building on a Live Campus, on phasing a 20-year expansion without ever closing the hospital (Healthcare Facility Hub) — and the risk version — The Risk Stack on a $430 Million Hospital Build (Risk Coverage Hub).

    Sources: Puyallup City Council action authorizing the Good Samaritan Hospital expansion development agreement, January 27, 2026 (20-year master plan; patient care tower; parking structures; medical office buildings; central support tower), via Citizen Portal; South Sound Report on the $430M+ expansion (160 new licensed beds, 30 observation beds, shelled floor for 40 more); MultiCare regional projection of 249 additional beds needed by 2036; City of Puyallup Opportunity Zone news release, October 14, 2026. This article is general information, not tax, legal, or investment advice.
  • Between Two Growth Centers: An Anatomy of Tract 53053073405

    Between Two Growth Centers: An Anatomy of Tract 53053073405

    This is part of the series that starts with Inside the Line: Puyallup’s Opportunity Zone, Explained Like It Matters. The companion piece, The New Opportunity Zone Math, covers how the money computes. This piece is the ground itself: what tract 53053073405 is, where it sits, and why it was chosen.

    Every Opportunity Zone story eventually becomes a map story. The incentive does not attach to a city, a neighborhood name, or a mayor’s priority list. It attaches to a census tract — an invisible statistical boundary most residents have never seen drawn — and everything inside that boundary plays by different financial rules for ten years.

    Puyallup’s nominated tract is 53053073405. The number itself is a small map: 53 is Washington, 053 is Pierce County, and 0734.05 is the tract. When the Treasury Department certifies the list — due by November 27, 2026 — that eleven-digit string becomes the most consequential geography in Puyallup’s economy.

    Where it sits: the between place

    The City’s announcement describes the tract precisely: it is “situated between two Regional Growth Centers and near MultiCare Good Samaritan Hospital.”

    The two growth centers are Puyallup Downtown and Puyallup South Hill — the region’s formally designated centers, the places county and regional plans already steer jobs, housing, and transit investment toward. Downtown carries the historic core, the fairgrounds, and the Sounder station. South Hill carries the mall corridor and the city’s big retail gravity.

    The tract is the ground between the two magnets — anchored on one side by Good Samaritan’s campus, the hospital now mid-way through a 20-year, $430-million-plus expansion. In planning language that’s called a corridor. In plain language: it’s the connective tissue of the city, the land you pass through between the two places you’re going, full of the underutilized and vacant properties the City’s application put at the center of its pitch.

    That in-between status is exactly what the City sold to the state. Puyallup’s application “emphasized the area’s strong potential for redevelopment, including underutilized and vacant properties that could benefit from new investment,” plus its “proximity to major employment centers, healthcare facilities, transportation connections, and established commercial areas.” Read that sentence again and you have the tract’s anatomy: older commercial fabric, room to rebuild, and demand anchors on every side.

    Why this tract qualified

    Opportunity Zones 2.0 tightened the door. Under the first program, a tract qualified at up to 80% of area median family income, and governors could also nominate tracts merely adjacent to qualifying ones — the loophole that put some already-gentrifying neighborhoods on the 2018 map.

    The new tests are stricter, and the side door is closed:

    • A tract must have a median family income at or below 70% of the area median, or
    • a poverty rate of at least 20% with median income at or below 125% of the area median, and
    • it must qualify on its own numbers — no contiguous-tract nominations.

    Governors could nominate only up to 25% of their states’ eligible tracts. Washington’s process drew 152 applications for 99 slots. Puyallup’s tract made a competitive cut under stricter math than the first map ever faced — which means the designation says something real about the ground: by the federal measures, this is a lower-income tract sitting inside a city whose overall numbers (43,730 residents; a citywide median household income of about $97,826) look comfortably middle-class. Both things are true at once. That tension — a prosperous small city with a genuinely strained corridor inside it — is precisely the profile the program was redesigned to find.

    What “inside the line” legally means

    Three clarifications that will matter for the next decade of local arguments:

    The designation covers the whole tract, not a project list. Any qualifying investment anywhere inside the boundary is eligible — a housing project, a renovated commercial building, an operating business that meets the tests. There is no roster of approved sites. Whoever owns land inside the line owns an option; what gets exercised is up to owners, developers, and the City’s normal permitting process.

    The line does not change zoning, taxes, or rules by itself. It changes the return math for private capital. A project still needs permits, still pays property tax, still goes through design review. The zone is an incentive layered over the city’s existing machinery — which is why the City’s announced next phase is outreach: connecting the people who own the ground to the people whose capital gains are looking for a home.

    Addresses, not vibes. Because the boundary is a census line, it cuts where census geography cuts — sometimes mid-block, sometimes through a parcel’s tax lot. The only way to know whether a specific property is in is to check the address against the official map. The Washington State Department of Commerce maintains the nomination map (an ArcGIS viewer linked from its Opportunity Zones page), and once Treasury certifies, the federal map is the final word. Anyone quoted a verbal assurance about a parcel should ask for the map printout instead.

    The anchors around the tract

    A tract does not succeed on its own acres; it succeeds on what surrounds it. This one’s surroundings are unusually strong for a qualifying low-income tract:

    • Good Samaritan Hospital. A 20-year master plan, a development agreement authorized by the City Council in January 2026, 160 new inpatient beds coming, and a regional projection of 249 more beds needed by 2036. Hospitals are decade-scale demand engines: staff, patients, visitors, suppliers, and every service that clusters around care.
    • Downtown and the fairgrounds. The Washington State Fair puts roughly a million visitors a year into the north end of this corridor; the downtown growth center carries the restaurants, services, and the Sounder commuter rail link to Tacoma and Seattle.
    • South Hill. The region’s retail center of gravity — the mall, the big boxes, and the traffic that comes with them — at the corridor’s other end.
    • A town already practicing. The same season brought a 134-vendor farmers market through environmental review and a 102-unit affordable housing project (Addison Grove) that closed its financing in 90 days. The machinery of getting things built here demonstrably works.

    The honest unknown

    What nobody can draw yet is the tract’s future project map — because it doesn’t exist. The scoreboard, as the hub piece puts it, is empty. Certification comes first (by November 27), then the January 1 starting gun, then the City’s outreach, then — if the work gets done — the first announcements.

    When they come, they will land somewhere inside an eleven-digit boundary most of us had never heard of before October. Now you know where the line is, and why it was drawn there. The rest of this series is about what gets built inside it.

    Sources: City of Puyallup news release, October 14, 2026 (tract description, application emphasis, next-phase outreach); Washington State Department of Commerce OZ 2.0 nomination records (152 applications, 99 nominations); Federal Reserve Community Development and the 2026 Opportunity Zones Handbook (2.0 eligibility tests, 25% nomination cap); Puget Sound Regional Council / Pierce County center designations via The Urbanist (Puyallup Downtown and Puyallup South Hill Regional Growth Centers); South Sound Magazine city snapshot (population 43,730; median household income $97,826, Census 2024). This article is general information, not tax, legal, or investment advice.

  • Five Years of Deferral, Ten Years to Tax-Free: The New Opportunity Zone Math

    Five Years of Deferral, Ten Years to Tax-Free: The New Opportunity Zone Math

    This is part of the series that starts with Inside the Line: Puyallup’s Opportunity Zone, Explained Like It Matters — the hub page for Puyallup’s nominated Opportunity Zone tract. This piece is the money: how the tax incentive actually computes.

    Opportunity Zone coverage usually dies in one of two ways: it waves at “tax benefits” without ever doing arithmetic, or it drowns in fund-manager vocabulary. Here is the middle path — the actual mechanics of Opportunity Zones 2.0, with numbers, using the same example throughout: a $1,000,000 capital gain, and a top federal rate of 23.8% (20% capital gains plus the 3.8% net investment income tax). Federal only; your rate and your state picture will differ. Illustrative, not tax advice.

    First, what changed: 1.0 versus 2.0

    The first Opportunity Zone program (2018–2026) had a design flaw baked in: its benefits expired on a fixed calendar. Deferral ended December 31, 2026 no matter when you invested, so every year the program aged, the incentive got weaker. The step-ups withered to zero. Rational money waited.

    The 2025 law (Public Law 119-21) rebuilt it as a permanent program:

    • Rolling deferral. Invest a gain on or after January 1, 2027, and the tax is deferred five years from your investment date — not to a fixed year-end.
    • The step-up is back, simplified. One step-up: 10% of the deferred gain is forgiven at the five-year mark. (The old 5-year/7-year ladder is gone. Qualified rural funds get 30% — Puyallup’s tract is urban, so 10% is the local number.)
    • The ten-year exclusion survives intact. Hold the fund investment at least ten years and the appreciation is excluded from federal tax — with a fair-market-value basis step-up available on sales up to the 30-year mark.
    • The map renews. New zones every ten years, tighter eligibility, and — new in 2.0 — real fund-level reporting, so the public can see what the money did.
    • The bridge rule that matters this winter. Which program you get depends on when the gain goes into the fund. Invest by December 31, 2026 and you are under the dying 1.0 rules, with the deferred gain taxed almost immediately. Invest the same gain on January 1, 2027 and the full 2.0 runway opens. One day, two different programs.

    The three clocks every investor is actually running

    Strip away the vocabulary and an Opportunity Zone investment is three clocks:

    Clock one: 180 days. From the day the gain is realized — the sale closes, the K-1 arrives — the investor has 180 days to place the gain in a Qualified Opportunity Fund. Miss it and the incentive is gone; this deadline, not the tax code’s fine print, is what kills most would-be OZ deals. (Partnership gains have their own start-date wrinkles — one of several places a CPA earns their fee.)

    Clock two: five years. The deferred gain comes due at the five-year anniversary of the investment. By then the step-up has applied, so the tax is computed on 90% of the original gain.

    Clock three: ten years. Cross ten years in the fund and the appreciation on the QOF investment itself becomes excludable. This is the clock that aligns the investor with the place: the full benefit only exists if the money stayed, worked, and grew inside zones for a decade.

    Three investors, one $1,000,000 gain

    Investor A pays the old-fashioned way. Sells in 2027, keeps the gain, invests wherever. Tax on $1,000,000 at 23.8%: $238,000, due with the 2027 return. Investable remainder: $762,000.

    Investor B uses the zone but leaves at year three. The $1,000,000 goes into a QOF inside a designated tract. Selling the fund interest early is an inclusion event: the deferral ends and the deferred gain is recognized — with no step-up yet and no exclusion. B got three years of float on the tax money and nothing else. The lesson is structural: this program does not reward tourists.

    Investor C stays for the whole design. Year five: the deferred gain is recognized at $900,000 after the step-up — tax of $214,200 instead of $238,000, a $23,800 saving, plus five years of deferral on the balance. Year ten: suppose the fund investment has doubled to $2,000,000. The $1,000,000 of appreciation is excluded — at the same rate, roughly $238,000 of tax that simply never happens. Combined effect versus Investor A: about $262,000 of federal tax avoided or deferred, before counting what five years of full principal working (instead of $762,000) did to the returns themselves.

    That last point is the quiet one. Deferral is not just a later tax bill; it is the government’s share of your gain working in your project for five years, interest-free.

    Who around here actually has a gain?

    The investor in these examples is not a caricature from a coastal fund brochure. In Pierce County, the people holding seven-figure gains in any given year are ordinary:

    • Business sellers. The owner who sells the company they built for thirty years — the single biggest gain most families ever realize, and it arrives all at once.
    • Real estate sellers. The family that sells the rental portfolio, the commercial building, or the development parcel.
    • Partners and shareholders. Anyone whose K-1 carries a share of a partnership’s sale gain — often people who never chose the timing at all.

    Each of them faces the same 180-day clock and the same fork: pay the tax and move on, or route the gain through a fund into places like tract 53053073405 and let the clocks run. Puyallup’s designation matters to them because a fund needs projects; projects need to be findable, packaged, and ready when somebody’s clock starts ticking.

    What a fund is, minus the mystique

    A Qualified Opportunity Fund is an investment vehicle — a corporation or partnership — that self-certifies to the IRS (Form 8996) and must hold at least 90% of its assets in qualified zone property: zone real estate being built or substantially improved, or stock and partnership interests in qualified zone businesses. Investors report their deferrals annually (Form 8997). Funds can be national platforms, regional specialists — Pierce County has already seen both models build real projects — or single-project vehicles formed around one development.

    Two cautions belong in any honest version of this piece. The tax benefit never rescues a bad project; a failed building with a step-up is still a failed building, and the incentive’s size (roughly a quarter of the gain, best case) is smaller than the swing between a good deal and a bad one. And Washington investors have a second layer to model: the state’s own capital gains excise tax is a separate system from the federal one, and how the two interact on a given gain is a question for your tax advisor, not a blog post.

    Why this matters before January 1

    The Puyallup tract’s designation, if Treasury certifies it as expected by late November, opens for 2.0 investments on January 1, 2027. Gains realized in late 2026 will hit their 180-day windows in the first half of 2027 — which means the investors who could fund the tract’s first projects are, right now, in the middle of the sales that create their gains.

    That is the real deadline pressure in this story. Not the tax code. The calendar of other people’s closings — and whether Puyallup has projects ready to be found when the clocks start.

    Next in the series: the map — an anatomy of tract 53053073405, between the Downtown and South Hill growth centers. Sources: P.L. 119-21 §70421 and IRC §1400Z-2 as amended (rolling five-year deferral, 10%/30% step-ups, 30-year exclusion window); 2026 Opportunity Zones Handbook; Federal Reserve Community Development, “Opportunity Zones 2.0 will offer place-based investment in low-income communities”; OZ HQ 1.0-vs-2.0 transition guidance (investment date determines the regime; Notice 2026-40). Figures are illustrative simplifications, not tax advice.

  • Inside the Line: Puyallup’s Opportunity Zone, Explained Like It Matters

    Inside the Line: Puyallup’s Opportunity Zone, Explained Like It Matters

    On October 14, 2026, the City of Puyallup announced that Governor Bob Ferguson had selected one of our census tracts — tract 53053073405 — for Washington’s Opportunity Zones 2.0 program.

    One tract. Ten years of federal tax incentives, if the Treasury Department certifies it. Almost nobody in town has heard about it yet, and almost everything written about Opportunity Zones is written for fund managers, not for the people who live inside the line.

    This page is the fix for that. It is the whole map: what the designation is, what stage it is actually at, how the money works in plain English, what it could build here — with real projects, not brochure language — and what it honestly cannot do. This is the first piece in a series, and this page will be updated as the story moves.

    What happened — and what still has to happen

    The City submitted this tract for consideration earlier this year, following direction from the Puyallup City Council. The Governor’s office then chose Washington’s slate: 99 nominations drawn from 152 applications, spanning 27 counties and 17 tribal lands.

    Here is the part the press releases compress: a nomination is not a designation. The nominations now sit with the U.S. Treasury Department, which certifies them under its published procedure. Treasury’s review window closes by November 27, 2026 at the latest, and as of this writing no certified list has been published for any state.

    If certified — and nominations that cleared a competitive state process are the strong favorites — the designation takes effect January 1, 2027, and runs for ten years, through December 31, 2036.

    Mayor Ned Witting called the selection “a major step forward in our ongoing economic development efforts” and said the designation “gives us another valuable tool to attract investment, create jobs, and encourage thoughtful redevelopment.” The City has already named its next phase: outreach to the property owners, developers, investors, and businesses inside the designated area.

    The tract: between two growth centers, next to a hospital

    Geography is the story here. Tract 53053073405 sits between two designated Regional Growth Centers — Puyallup Downtown and Puyallup South Hill — and near MultiCare Good Samaritan Hospital, the city’s anchor healthcare employer.

    The City’s own application made the pitch in plain terms: an area with underutilized and vacant properties that could benefit from new investment, close to major employment centers, healthcare facilities, transportation connections, and established commercial areas.

    It also qualified under tightened rules. Opportunity Zones 2.0 shrank eligibility — a tract now needs a median family income at or below 70% of the area median, or a poverty rate of at least 20% — and killed the old rule that let merely adjacent tracts in. Nationally, roughly 6,500 tracts are expected under 2.0, down from 8,764 in the first round. This line was drawn around a place that meets the stricter test.

    This is a town in motion on several fronts at once — the same month brought a new farmers market filing with 134 vendor spaces a short drive away. The zone is the biggest of the currents, and the least understood.

    How the money works

    An Opportunity Zone is not a grant. Nobody sends Puyallup a check. It is a tax incentive aimed at private investors who have capital gains — from selling a business, a building, or a portfolio — and it pays them to put those gains to work inside the line for a long time.

    The mechanics, in order:

    • The 180-day door. An investor who realizes a capital gain has 180 days to reinvest it in a Qualified Opportunity Fund (QOF) — a fund that holds projects inside designated zones.
    • Five years of deferral. For investments made on or after January 1, 2027, the tax on the original gain is deferred for five years from the investment date. Unlike the first program, there is no fixed cliff date — the clock rolls with the investor.
    • A 10% step-up. Hold five years and 10% of the deferred gain is forgiven — only 90% is ever taxed. (Rural funds get 30%; Puyallup’s tract is urban, so 10% is our number.)
    • Ten years to tax-free growth. Hold the fund investment ten years and the growth on it is excluded from federal tax when sold — the program’s real prize, capped at the 30-year mark.
    • Substantial improvement. To renovate an existing urban building, a project must invest at least 100% of the building’s value (excluding land) — the rule that decides which of the tract’s buildings are renovation candidates and which are new-build sites.

    The worked example. Sell a business in 2027 with a $1,000,000 gain. Put the gain into a Qualified Opportunity Fund building inside the Puyallup tract within 180 days. You owe no tax on that gain until 2032 — and then on $900,000, not $1,000,000. Hold the fund for ten years; if the project doubles the money, the second million of growth is never taxed at all. At a 23.8% top federal rate, the step-up alone is worth roughly $24,000, and the exclusion can be worth several times that. The price of all of it is patience: the money works here, for a decade. Illustrative only — not tax advice.

    The 2025 law (Public Law 119-21) also made the program permanent, with a fresh map drawn every ten years, and added the fund-reporting requirements the first round lacked. This is not a pilot anymore. It is a standing feature of the tax code that Puyallup now gets to use.

    The plays: what this could actually build here

    1. The hospital play

    The tract’s anchor is mid-expansion. MultiCare’s Good Samaritan campus is working through a 20-year master plan: a patient care tower budgeted at more than $430 million with 160 new licensed inpatient beds, plus 30 observation beds and a shelled floor for 40 more. The City Council authorized the development agreement for it on January 27, 2026. MultiCare projects the region will need 249 additional beds by 2036.

    The hospital is a nonprofit; its own tower is not an Opportunity Zone project. The play is everything a decade of hospital growth makes necessary around it — medical office space, housing for the staff being hired, childcare that works on shift schedules, support and rehab services, parking. Those are exactly the kinds of projects and businesses QOF money can fund, sitting next door to a guaranteed demand engine.

    2. The housing play

    This is not theoretical. Ten miles away, Qualified Opportunity Fund money has already built housing in Pierce County:

    • The Astor, downtown Tacoma. Unico Properties and Pinnacle Partners — a Qualified Opportunity Zone investment firm — converted the historic 1925 Washington Building into 156 apartments, delivered in 2022.
    • The Moraine, Tacoma’s Hilltop. Ethos Development and Catalyst Opportunity Funds built 160 units of workforce housing, which won CoStar’s 2025 Multifamily Development of the Year for the Seattle market.

    And Puyallup itself just proved it can absorb structured housing capital: Addison Grove, 102 apartments for families earning 50–80% of area median income, closed its financing in 90 days through the Ballmer Group–backed Washington Family Housing Fund. That is a philanthropic model, not an OZ deal — but it shows the development capacity, the permitting path, and the demand are all real here. The tract’s underutilized and vacant properties are the obvious next sites; the substantial-improvement rule sorts them into renovations and new builds.

    3. The business play — the one everyone misses

    Opportunity Zone capital is famous for real estate, but the statute also funds operating businesses inside the zone — Qualified Opportunity Zone Businesses. A growing company in the tract can, in principle, raise equity from a fund that wants ten-year money deployed locally, instead of borrowing from a bank that wants it back in five.

    For a corridor anchored by a hospital, the candidate list writes itself: medical suppliers and services, childcare, food, trades, rehabilitation and home-health support. The rules have real tests — where the assets sit, where the income is earned — but the door exists, and almost no local coverage of this designation will mention it. We will, in its own piece.

    4. What it won’t do

    The honest ledger matters, because the first round of Opportunity Zones earned both its results and its criticism. Nationally, the 1.0 program drew an estimated $100 billion into some 5,600 neighborhoods — and a visible share of it landed in places already rising, in luxury product, and in self-storage.

    Version 2.0 answers some of that: tighter eligibility, no adjacent-tract entries, mandatory reporting, a map that resets every decade. But no tax incentive decides what gets proposed, permitted, or built. That part is local — it runs through the City’s outreach phase, the planning process, and which projects owners and developers actually bring forward. The incentive pays investors who have capital gains. The community’s return depends on the quality of what gets built with their money. Both halves of that sentence stay true for ten years.

    The clock, and the four seats

    • By November 27, 2026: Treasury certification decisions due — the next news beat, and this page will be updated when it lands.
    • January 1, 2027: the designation takes effect; OZ 2.0 investments begin earning the new deferral.
    • December 31, 2028: the original 2018 zone map expires.
    • December 31, 2036: this designation ends. Projects funded under it play out on their own timelines.

    Property owners inside the line have the first move: know your tract status and your building’s basis before investors come calling — it determines whether you’re a renovation or a new-build conversation. Investors with gains have a timing decision: the dying 1.0 rules versus the 2.0 runway that opens January 1, and a 180-day clock either way. Businesses have homework: the operating-business tests, read with counsel before restructuring anything. The city has the outreach it already announced — the quality of the public pipeline it builds will shape what the money finds.

    The scoreboard

    Projects announced inside tract 53053073405 under this designation: none yet. The designation is not yet certified, and the starting gun is January 1. That empty space is the reason this series exists — to be the record, kept in public, of what a ten-year incentive actually builds in one American town of 43,730 people.

    Read the series so far: Five Years of Deferral, Ten Years to Tax-Free — the new Opportunity Zone math, with real numbers; and Between Two Growth Centers — the anatomy of the tract itself; and The Hospital Play — what a $430 million expansion builds around itself; and The Housing Play — three real Pierce County models; and The Business Play — the door nobody walks through; and The Honest Caveats — what 1.0 got wrong and what 2.0 fixed; and The Playbook — four seats, one deadline. The series is complete; this page now lives as the record — updated when Treasury certifies the list and as the scoreboard fills.

    Sources: City of Puyallup news release, October 14, 2026; Washington State Department of Commerce Opportunity Zones 2.0 nomination records; Rev. Proc. 2026-14 certification timeline; Opportunity Zones 2.0 provisions under P.L. 119-21 (Federal Reserve Community Development summary; 2026 Opportunity Zones Handbook); Puyallup City Council action on the Good Samaritan development agreement, January 27, 2026; Unico Properties (The Astor); Catalyst Opportunity Funds (The Moraine); Puget Sound Business Journal via Propmodo (Addison Grove). This article is general information, not tax, legal, or investment advice.

  • 134 Vendor Spaces: A New Puyallup Farmers Market Is in Permitting

    134 Vendor Spaces: A New Puyallup Farmers Market Is in Permitting

    On October 20, Pierce County filed the environmental paperwork for a new farmers market in Puyallup: 4.77 acres, roughly 134 vendor spaces, a 136-stall parking lot, and a comment window that stays open until November 19.

    It is not approved yet. It is not a done deal with a ribbon-cutting date. It is a proposal at the start of the public process — which is exactly when it is worth paying attention, because this is the stage where the shape of the thing can still change.

    And the shape matters. A market with 134 stalls is not a quaint Saturday event. It is 134 small businesses standing in a field, each one needing the same three things every business in 2026 needs: to be findable, to be payable, and to be remembered after the customer walks away.

    What the filing actually says

    The proposal, filed under SEPA record 202604433 with Pierce County as lead agency, describes a weekend farmers market operating no more than 90 days per year.

    • The site: 4.77 acres in Puyallup (the register notice describes the property by size, not by street address).
    • The market: approximately 134 vendor spaces.
    • The parking: a 136-stall lot built with pervious asphalt — pavement that lets rain drain through instead of running off.
    • The facilities: a bathroom trailer served by an onsite septic system.
    • The applicant: Mitchell Brells of Momentum Civil.
    • The deadline that matters: public comments on the filing are due November 19, 2026.

    SEPA is Washington’s State Environmental Policy Act — the review that asks what a project does to traffic, drainage, noise, and neighbors before anyone approves it. The comment period is the public’s seat at that table.

    Where it sits in the process

    Right now this market exists as a description in a state register. Between here and opening day there are findings, conditions, and permits, and any of them can reshape the project.

    That is not a reason to shrug. It is the reason the comment window exists. Puyallup residents who care — about the traffic on their street, or about the chance to sell what they grow two miles from home — have until November 19 to say so on the record.

    The full filing is public. Anyone can read it, and anyone can comment on it, at the state’s SEPA register: SEPA record 202604433. Local coverage of the filing is at The Puyallup Wire.

    134 stalls is 134 small businesses

    Here is the part I keep coming back to. Puyallup already knows how to run a market — the Saturday market at Pioneer Park ran April through October this year, like it does every year. Market culture is not the risk here.

    The risk is quieter. A vendor can have the best jam, the best flowers, the best sourdough in Pierce County, and still be invisible — no page a search engine or an AI assistant can read, no way to take a card when the cash runs out, no way for a happy customer to find them again in February.

    Findable means there is a real page somewhere with your name, what you sell, and where you will be — written plainly enough that Google, Bing, and the AI assistants can quote it. When somebody asks their phone “who sells sourdough at the Puyallup market,” the answer comes from what is written down about you. We tested this on a local question recently — we asked AI who to call for water damage in Puyallup — and watched exactly how those answers get built.

    Payable means the money part is settled before the first customer shows up: tap-to-pay working, prices posted, no fumbling. A market stall is a storefront with a four-hour day. Everything has to work the first time.

    Remembered is the one most vendors skip. A customer who loves your product at a market in July is worth ten strangers in December — if you gave them a way to stay in touch. An email list, a follow, a card with a real link on it. Reviews and mentions are the new word of mouth, and they only accumulate for businesses that can be found again.

    If you want one of those stalls, start now

    Nobody knows yet when — or whether — this market opens. Permitting will decide that. But the vendors who will be ready are the ones who treat the wait as lead time:

    • A name and one plain sentence about what you sell, the same everywhere it appears.
    • A findable page — even a simple one — with your market days, your products, and a way to reach you.
    • Payments sorted: card and tap-to-pay tested before opening day, not during the first rush.
    • A way to be remembered: an email signup, a stamp card, a QR code that goes somewhere real.

    And if you have an opinion about the market itself — for it, against it, or about the traffic either way — the county is taking comments until November 19. That window is the story right now. The stalls come later.

    Sources: Washington State SEPA Register, record 202604433 (Pierce County, issued October 20, 2026); The Puyallup Wire, “Puyallup Farmers Market SEPA Filed” (October 2026).

  • Restoration Technology Market Projection: Our 2033 Test

    Restoration Technology Market Projection: Our 2033 Test

    Our own test, not a third-party figure. We could not find any published forecast that sizes the technology side of property restoration for 2033, so we built one from the forecasts that do exist. Here is the answer up front.

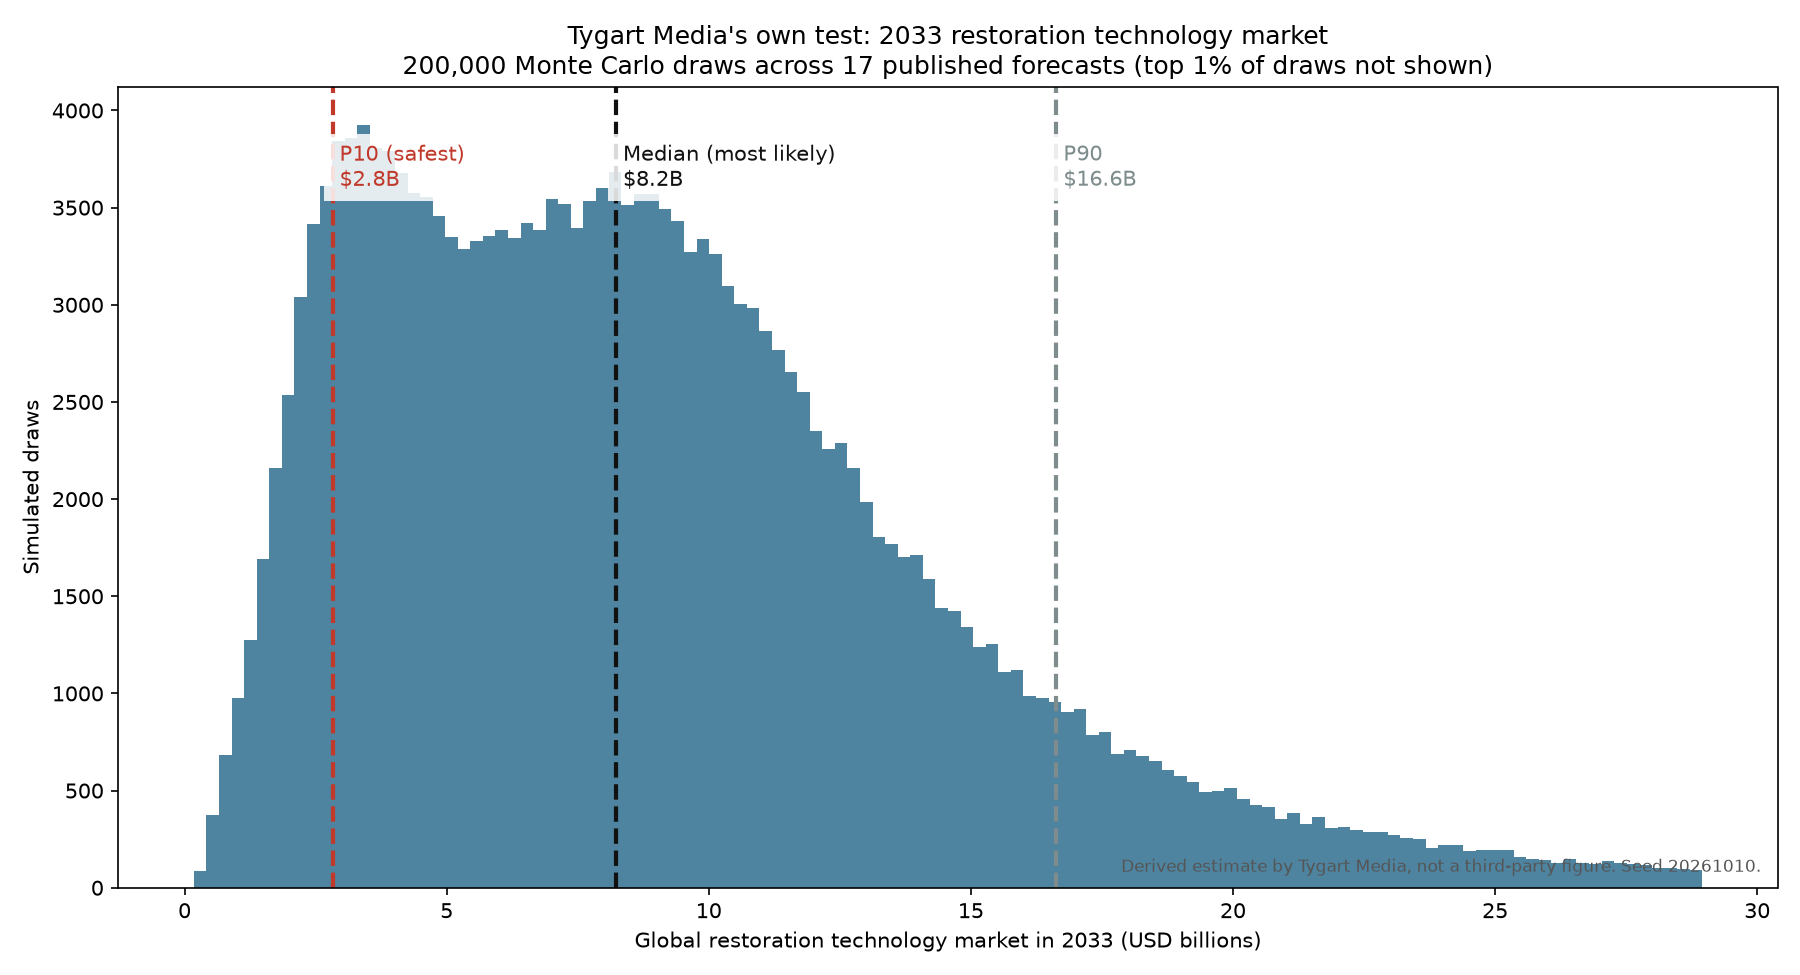
    • Most likely (median): about $8.2 billion global restoration technology spend in 2033. When we need a figure ending in .5, we use $8.5 billion.
    • Safest (P10, conservative): about $2.8 billion, or $2.5 billion rounded down to the nearest .5. There is a 90% chance the real number is higher.
    • High case (P90): about $16.6 billion.
    • All three numbers are Tygart Media’s own derived estimates from a 200,000-draw Monte Carlo simulation over 17 published forecasts. Please cite them as “Tygart Media’s own test,” not as a market-research figure.
    Histogram of 200,000 simulated 2033 values for the global restoration technology market, with the P10 at about 2.8 billion dollars, the median at about 8.2 billion and the P90 at about 16.6 billion
    Our own test: 200,000 simulated 2033 values. Median about $8.2B, P10 about $2.8B, P90 about $16.6B.

    Why we ran this test

    An older post of ours on AI in disaster restoration said the restoration technology market would reach a figure “by 2033.” Somewhere along the way the number fell out of the sentence, and our saved revisions didn’t have it either. When we went looking for a source to restore it, we found a lot of forecasts for restoration services, a few for restoration software, and several reports called “building restoration technology” that turn out to be about stone, timber and church restoration. None of them measures what the sentence was about.

    So instead of guessing, we ran the numbers ourselves and are showing all the work.

    What we measured: global spending in 2033 on technology used to restore property after water, fire, mold and storm damage. That covers restoration and claims software and platforms, AI and photo-based damage assessment, drying and moisture equipment, and monitoring sensors. Figures are in US dollars.

    The sources

    PublisherWhat it measuresWherePublished figureWeight
    DatainteloProperty Restoration Software MarketGlobal$2.8B (2025) to $5.2B (2033)0.54
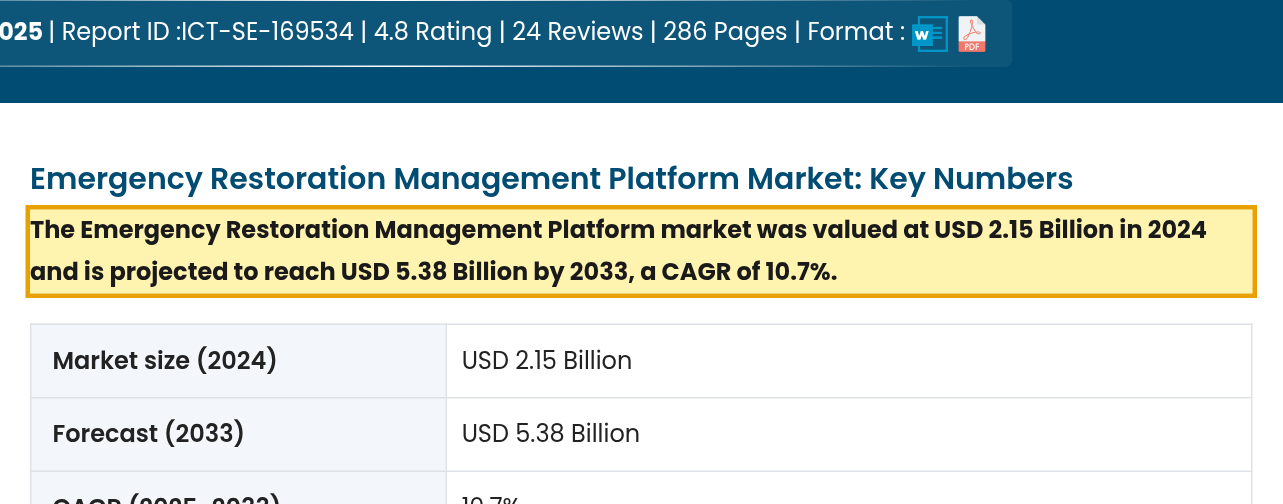
    Growth Market ReportsEmergency Restoration Management Platform MarketGlobal$2.15B (2024) to $5.38B (2033)0.40
    HTF Market IntelligenceRestoration Management Software MarketGlobal$0.6B (2025) to $1.5B (2033)0.40
    Growth Market ReportsProperty Claims Estimation Software MarketGlobal$1.85B (2024) to $4.25B (2033)0.30
    Growth Market ReportsClaims Photo Estimating AI for Property MarketGlobal$1.49B (2024) to $6.33B (2033)0.20
    Verified Market ReportsFire and Water Restoration Service MarketGlobal$16.47B (2025) to $31.17B (2033)0.25
    Market Research IntellectFire And Water Restoration Service MarketGlobal$16.5B (2024) to $25.8B (2033)0.25
    Future Market ReportProperty Restoration Services MarketGlobal$12.1408B (2025) to $20.3103B (2033)0.25
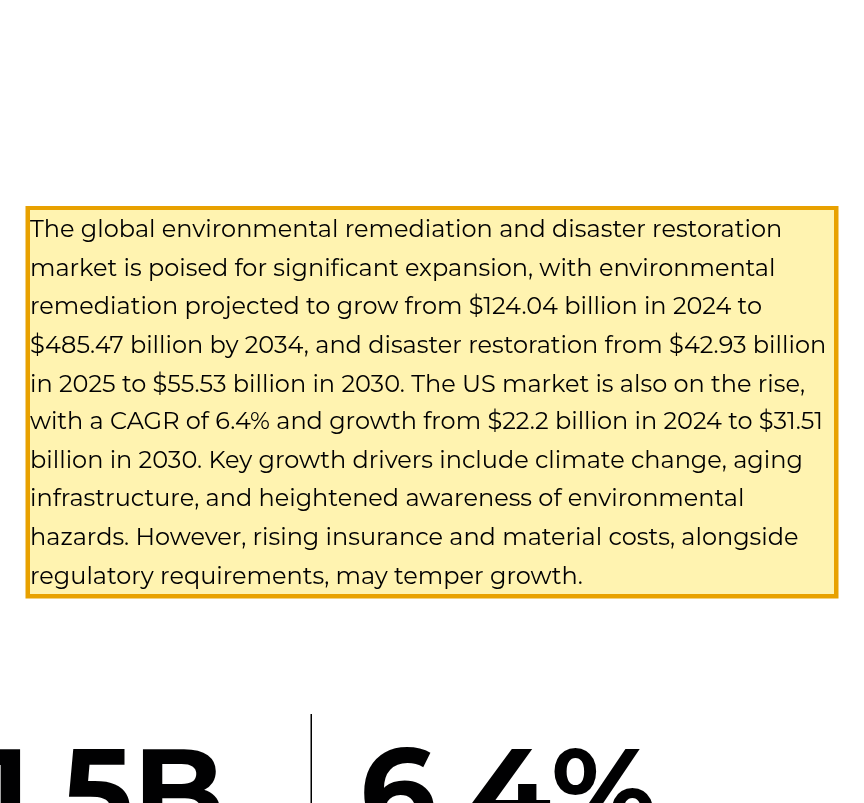
    BainbridgeRestoration & Remediation industry reportGlobal$42.93B (2025) to $55.53B (2030)0.35
    BainbridgeRestoration & Remediation industry reportUS$22.2B (2024) to $31.51B (2030)0.28
    IBISWorldDamage Restoration Services in the USUS$7.7B (2026) to $7.7B (2026)0.32
    HTF MI (htfmarketinsights.com)Fire damage restoration Market + Water damage restoration MarketGlobal$31.7B (2025) to $76.5B (2033)0.06
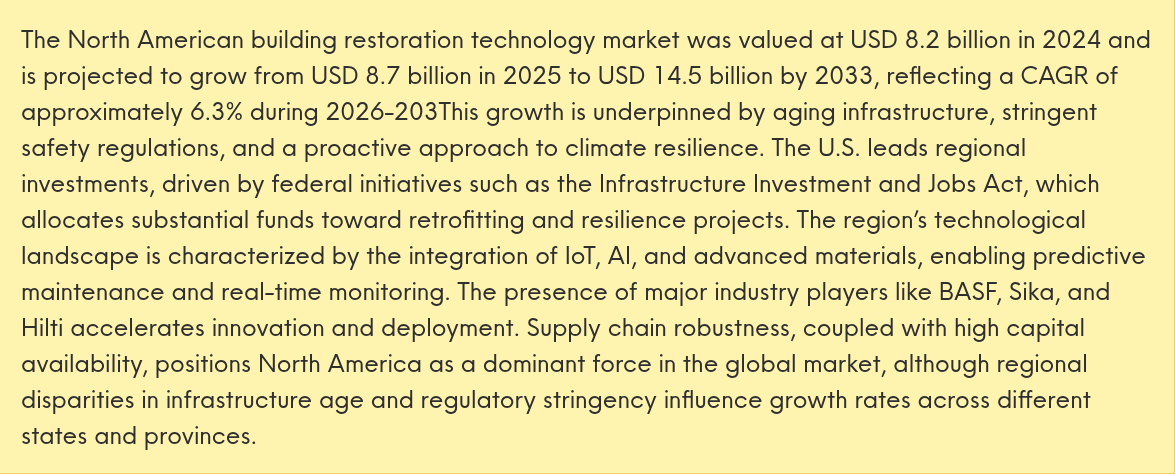
    Verified Market ReportsBuilding Restoration Technology MarketNorth America$8.7B (2025) to $14.5B (2033)0.07
    Verified Market ReportsBuilding Restoration Technology MarketGlobal$12.5B (2025) to $25B (2034)0.06
    Business Research InsightsBuilding Restoration Technology MarketGlobal$146.32B (2026) to $249.53B (2035)0.04
    Cognitive Market ResearchBuilding Restoration and Maintenance Technology MarketGlobal$130.958B (2025) to $251.741B (2033)0.06
    DataHorizzon ResearchBuilding Restoration Service MarketGlobal$56.8B (2024) to $98.5B (2033)0.10
    The 17 forecasts used in the simulation. Weight = how well the scope fits (0 to 1) × how credible and internally consistent the page is (0 to 1). We checked every figure on the live page on October 10, 2026.

    Five reports size restoration technology directly. Ten size restoration services or very broad building restoration, and for those we had to estimate the technology slice. Three examples of what the sources actually say:

    Screenshot of the Growth Market Reports page stating the Emergency Restoration Management Platform market was 2.15 billion dollars in 2024 and is projected to reach 5.38 billion by 2033
    A technology-only report: restoration management platforms. Source: Growth Market Reports (screenshot Oct 10, 2026).
    Screenshot of the Bainbridge summary stating disaster restoration grows from 42.93 billion dollars in 2025 to 55.53 billion in 2030 and the US market from 22.2 billion in 2024 to 31.51 billion in 2030
    A services report: the whole restoration industry, not just its technology. Source: Bainbridge (screenshot Oct 10, 2026).
    Screenshot of the Verified Market Reports paragraph stating the North American building restoration technology market is projected to grow to 14.5 billion dollars by 2033
    A “building restoration technology” report that is really about heritage and structural work. The headline on the same page says $12.5B (2025) to $25B (2034) for the whole world. Source: Verified Market Reports (screenshot Oct 10, 2026).

    The method in plain English

    1. Line every forecast up on 2033. Some stop in 2030 and some run to 2035. We moved each one to 2033 using its own growth rate, give or take 1.5 percentage points, because nobody’s growth rate is exact.
    2. Convert US-only figures to global. The US is 25% to 42% of the world market depending on the report, so we sampled across that range.
    3. Translate each report into “technology.” A software report only covers part of the technology market, so we scaled it up. A services report covers far more than technology, so we took a slice of it, somewhere between 6% and 25% with 14% most likely. A heritage “building restoration” report gets an even thinner slice, 2% to 10%.
    4. Allow for sloppy methods. Every draw gets some random error, and the error is bigger for publishers whose pages contradict themselves.
    5. Draw 200,000 times. Each draw picks one source, with better-fitting and more credible sources picked more often, then applies all of the above. The spread of the 200,000 answers is the result.

    The simulation is seeded (20261010), so it gives the same answer every time it runs. A second seed moves the median by less than $0.05 billion.

    Results and sensitivity

    Across all draws, the middle of the distribution is about $8.2 billion, half of the draws fall between $4.7 and $12.0 billion, and 80% fall between $2.8 and $16.6 billion. That is a wide range, and it is wide because the sources disagree about what the market even is.

    Pooling the sources a different way (averaging all of them in every draw instead of picking one) gives a tighter $7.4 billion median. For the US alone, the median is about $2.7 billion.

    Then we changed one assumption at a time to see what moves the answer:

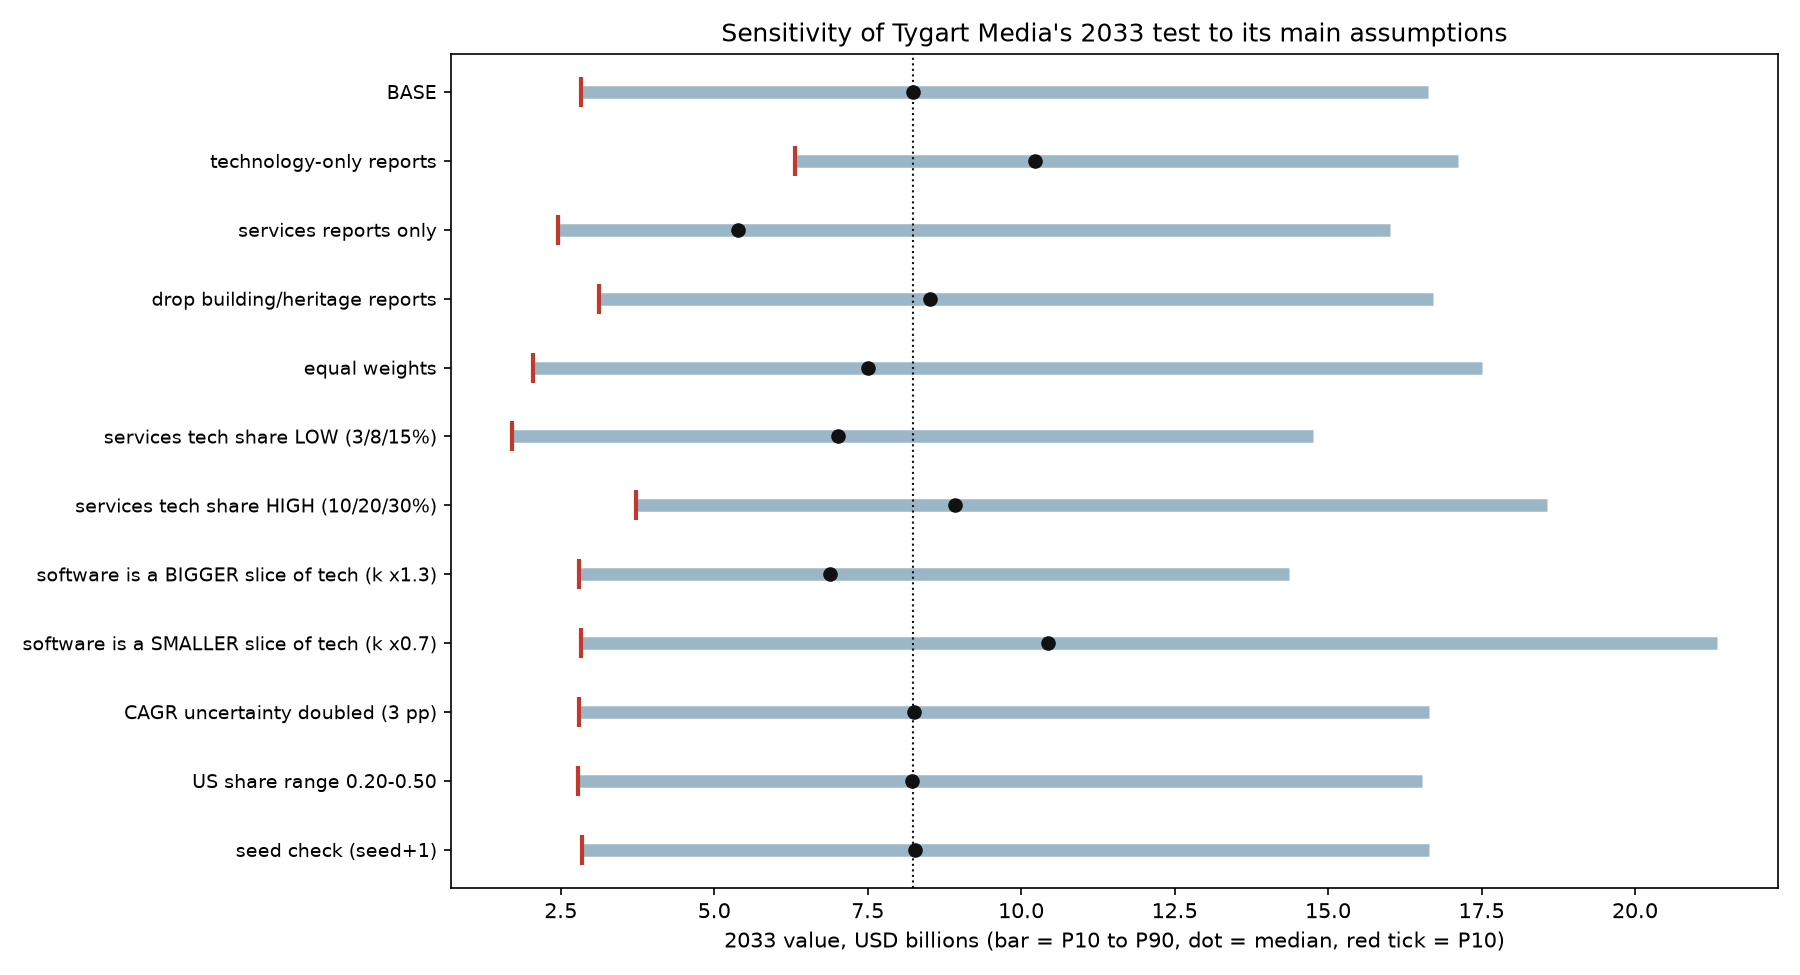
    Sensitivity chart showing the 2033 median and P10 to P90 range under eleven alternative assumptions, with medians between about 5.4 and 10.4 billion dollars
    How the 2033 answer moves when we change one assumption at a time. Bar = P10 to P90, dot = median.
    • Using only the technology reports raises the median to $10.2 billion. Using only the services reports lowers it to $5.4 billion. This is the biggest swing in the whole test.
    • Assuming technology takes a smaller share of services spending gives $7.0 billion. A bigger share gives $8.9 billion.
    • Weighting every source equally gives $7.5 billion.
    • Doubling the growth-rate uncertainty or widening the US share range barely changes anything.
    • Dropping any single source keeps the median between $7.7 and $8.8 billion, so no one report drives the result.

    Why $8.5 billion: it is the nearest .5 figure to the median, it sits between the two pooling methods, and it stays inside the middle range in every sensitivity case. If you need a number that is very unlikely to overstate the market, use the safest figure, $2.5 billion.

    Limitations

    • The technology data is thin. Only five public reports size restoration technology directly. They come from syndicated publishers that don’t publish their methods, and they overlap: the same estimating software vendors appear in several of them.
    • The two biggest assumptions are ours. How much of restoration services spending goes to technology, and how much of the technology market is software, have no published measurement. We set honest ranges and showed what happens when they move.
    • Some sources contradict themselves. One “building restoration technology” page gives a $25 billion global figure for 2034 but regional 2033 figures that add up to about $58 billion. Another lists two different 2035 totals. We gave those pages very little weight.
    • The weights are editorial judgment. The equal-weight check shows how much that matters, about $0.7 billion on the median.
    • No paid reports. We only used figures that are publicly visible, so we did not buy any full analyst reports.
    • This is a forecast of forecasts. It can’t be more reliable than the reports it is built on. Treat it as a reasoned range, not a fact.

    Every source we used

    • Dataintelo: Property Restoration Software Market (updated May 2026) (used, technology). link
    • Growth Market Reports: Emergency Restoration Management Platform Market (used, technology). link
    • HTF Market Intelligence: Restoration Management Software Market (to 2033) (used, technology). link
    • Growth Market Reports: Property Claims Estimation Software Market (used, technology). link
    • Growth Market Reports: Claims Photo Estimating AI for Property Market (used, technology). link
    • Verified Market Reports: Fire and Water Restoration Service Market (updated May 24 2026) (used, services). link
    • Market Research Intellect: Fire And Water Restoration Service Market (used, services). link
    • Future Market Report: Property Restoration Services Market (2026-2033) (used, services). link
    • Bainbridge: Restoration & Remediation industry report (used, services). link
    • Bainbridge: Restoration & Remediation industry report (US) (used, services). link
    • IBISWorld: Damage Restoration Services in the US (Aug 2026) (used, services). link
    • HTF MI (htfmarketinsights.com): Fire damage restoration Market + Water damage restoration Market (summed) (used, services). link and link
    • Verified Market Reports: Building Restoration Technology Market (updated May 25 2026) – North America section (used, building or heritage). link
    • Verified Market Reports: Building Restoration Technology Market (updated May 25 2026) – global headline (used, building or heritage). link
    • Business Research Insights: Building Restoration Technology Market (updated Aug 27 2026) (used, building or heritage). link
    • Cognitive Market Research: Building Restoration and Maintenance Technology Market (used, building or heritage). link
    • DataHorizzon Research: Building Restoration Service Market (used, building or heritage). link
    • Bainbridge: Restoration & Remediation industry report (checked, not used; Different industry (environmental cleanup, NAICS 562910-type), not property damage restoration). link
    • Coherent Market Insights: Mold Remediation Service Market 2026-2033 (checked, not used; Sub-segment only (already inside fire/water/property restoration totals)). link
    • Research Intelo: Predictive Maintenance for Buildings Market (checked, not used; One of the drivers named in post 169, but it is facility-maintenance tech, not restoration). link
    • Dataintelo: Air Movers Market (used to set the technology-share bounds). link
    • JBKnowledge (via Procore): Construction Technology Report (2021) (used to set the technology-share bounds). link
    • Associated General Contractors of America / Sage: 2016 Construction Outlook (press release Jan 6 2016) (used to set the technology-share bounds). link
    • Data Insights Market: Restoration Management Software (USD 945M to 1.60B by 2030, 9.3%) (checked, not used; Excluded because the page could not be verified). link

    Prepared by Tygart Media in October 2026. This page will be updated if better technology-specific data becomes available.

  • Yes, I Put the Schema Where You Could See It. On Purpose.

    Yes, I Put the Schema Where You Could See It. On Purpose.

    I had an audit run on the oldest content on this site this week. Pages, posts, links, bylines, search descriptions, the works. It came back with a ranked list of problems, and near the top, flagged as a defect readers can see, was this:

    Visible raw JSON-LD schema code printed as text in the post body.

    Across the whole site, it found 197 posts doing it.

    Cartoon crawler robot stamping FLAGGED on a blog post full of visible code while the blogger gives a sheepish thumbs-up
    My own audit, doing exactly what I asked it to do. Rude.

    And I’ll be honest, my first reaction wasn’t “oops.” It was closer to “hey, I did that on purpose.”

    What you’re looking at

    If you’ve scrolled to the bottom of some of my older posts, you’ve seen it: a block of curly braces, "@context": "https://schema.org", a headline, an author, a publisher, a date. It’s structured data. The machine-readable summary of what the page is, who wrote it, and who published it.

    Normally that lives in a <script type="application/ld+json"> tag. Readers never see it, and crawlers pick it up behind the scenes. I know how to do it that way. Plenty of these same posts had it that way too.

    I also put a copy out front, in the body, where anyone could read it.

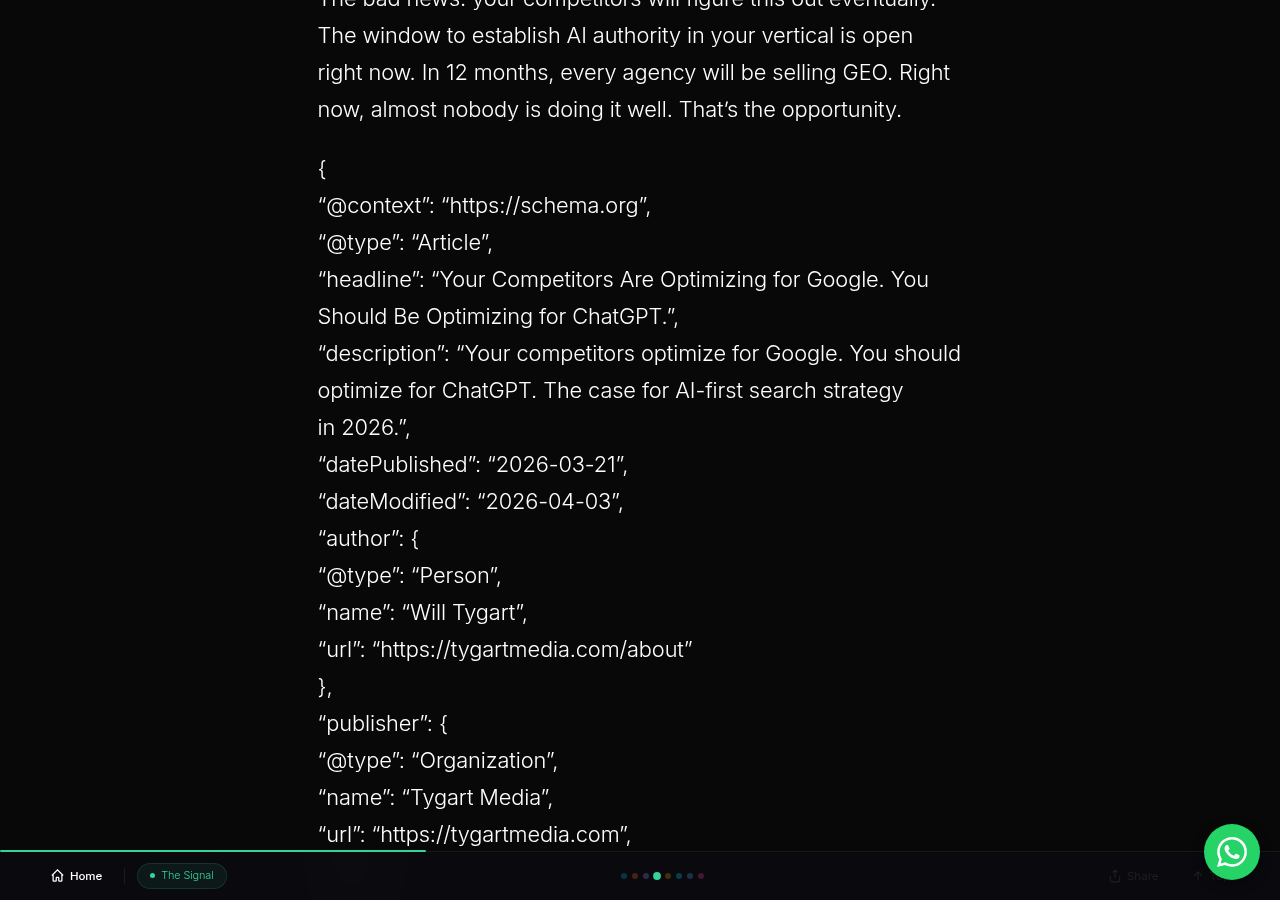
    Before: the end of “Your Competitors Are Optimizing for Google. You Should Be Optimizing for ChatGPT.” with its Article schema printed as visible text, curly quotes and all
    Before. The article ends, the schema begins. Those curly quotes are lovely typography and terrible JSON.

    Why I did it

    This didn’t come out of nowhere. Back when I published these, I’d already been at it a while: for about a year before that, my everyday workflow was screenshotting schema and photos and pasting them into AI tools to get help with them. That was on my own desk, not on the website. But do that long enough and you get in the habit of thinking about the page as something a machine reads, not just something a person reads.

    When it came time to publish these posts, my reasoning was simple. Not everything that reads a web page reads it the way Google does. Screen readers, accessibility tools, and whatever crawler or AI agent happens to show up next don’t all go digging through script blocks. Some of them only take in the text on the page.

    So I thought: if the structure matters, and I was betting heavily that it did, especially for AI and answer engines, then why hide it? Put it where every reader, human or machine, could get to it. Treat it as part of the content, not an invisible attachment.

    It was also a demonstration. I write about getting businesses understood by machines. Showing the actual markup on the page was a way of saying: this is what that looks like. Nothing up my sleeve.

    The fair criticism

    Now, I’m stubborn, not blind. A few things are fair game here.

    A wall of JSON is not friendly to a human reader. If you came for a local SEO playbook and finished on forty lines of braces and quotation marks, I get it if you thought the page was broken. The audit literally measured one of these blocks running about 2,100 pixels tall on a phone. That’s a lot of scrolling for metadata.

    What a screen reader actually does with a block of JSON is a fair debate. My intent was access. Whether reading out a pile of punctuation counts as access is a fair thing to argue about, and I’m not going to pretend I settled it.

    The copies didn’t stay clean. WordPress likes to “help.” Some of the visible blocks picked up curly quotes and line breaks along the way. That’s charming in prose and useless in JSON. A machine trying to parse those blocks as data would choke.

    So the audit isn’t wrong that it’s a problem today. It’s just wrong about why it’s there. It wasn’t an accident. It was a choice, and the choice has run its course.

    Why it’s coming down now

    Here’s the part that makes this easy. The stack caught up.

    This site runs Rank Math, and Rank Math now outputs proper Article and BreadcrumbList schema on every post, in the head of the page, where it belongs. That means the visible copy isn’t carrying any weight anymore. It’s a duplicate. Worse, some of these posts were carrying three versions of the same facts: Rank Math‘s, an older inline script block, and the visible one, and they didn’t always agree on things like the modified date.

    When the system does the job properly, the demonstration becomes clutter.

    Then and now cartoon: a blogger holding a sign of raw code, then a Rank Math badge as robots applaud
    Same guy, same idea. The plugin just does it without the sign.

    What we’re doing about it

    • Audit first. Nothing gets touched without a list. The audit covered the 50 oldest items on the site, and a separate site-wide scan found the full 197.
    • Delete the visible blocks. No rewriting, no reformatting. The fix is deletion, and the duplicate inline Article scripts in those same posts go at the same time.
    • Let Rank Math own schema. One source of truth for structured data. If a page ever needs custom schema, it goes through Rank Math‘s schema settings, not pasted into the post.
    • Look at the page like a human. Every fixed post gets checked live in a browser afterward. The code should be gone, and the article should end where the article ends.

    The cleanup of the oldest posts is happening now. The rest of the 197 get their own pass after that.

    The actual lesson

    I’m not going to tell you I was wrong to try it. I had a reason. You just didn’t know it, and to be fair, neither did the audit.

    But a reason has a shelf life. What made sense back when I published these doesn’t have to make sense now, and it’s worth checking every once in a while whether your clever idea is still doing its job or just sitting there being clever.

    Mine was sitting there. So it’s coming down.

    If you spot a stray curly brace at the bottom of one of my posts in the meantime, consider it a collector’s item.