Our own test, not a third-party figure. We could not find any published forecast that sizes the technology side of property restoration for 2033, so we built one from the forecasts that do exist. Here is the answer up front.
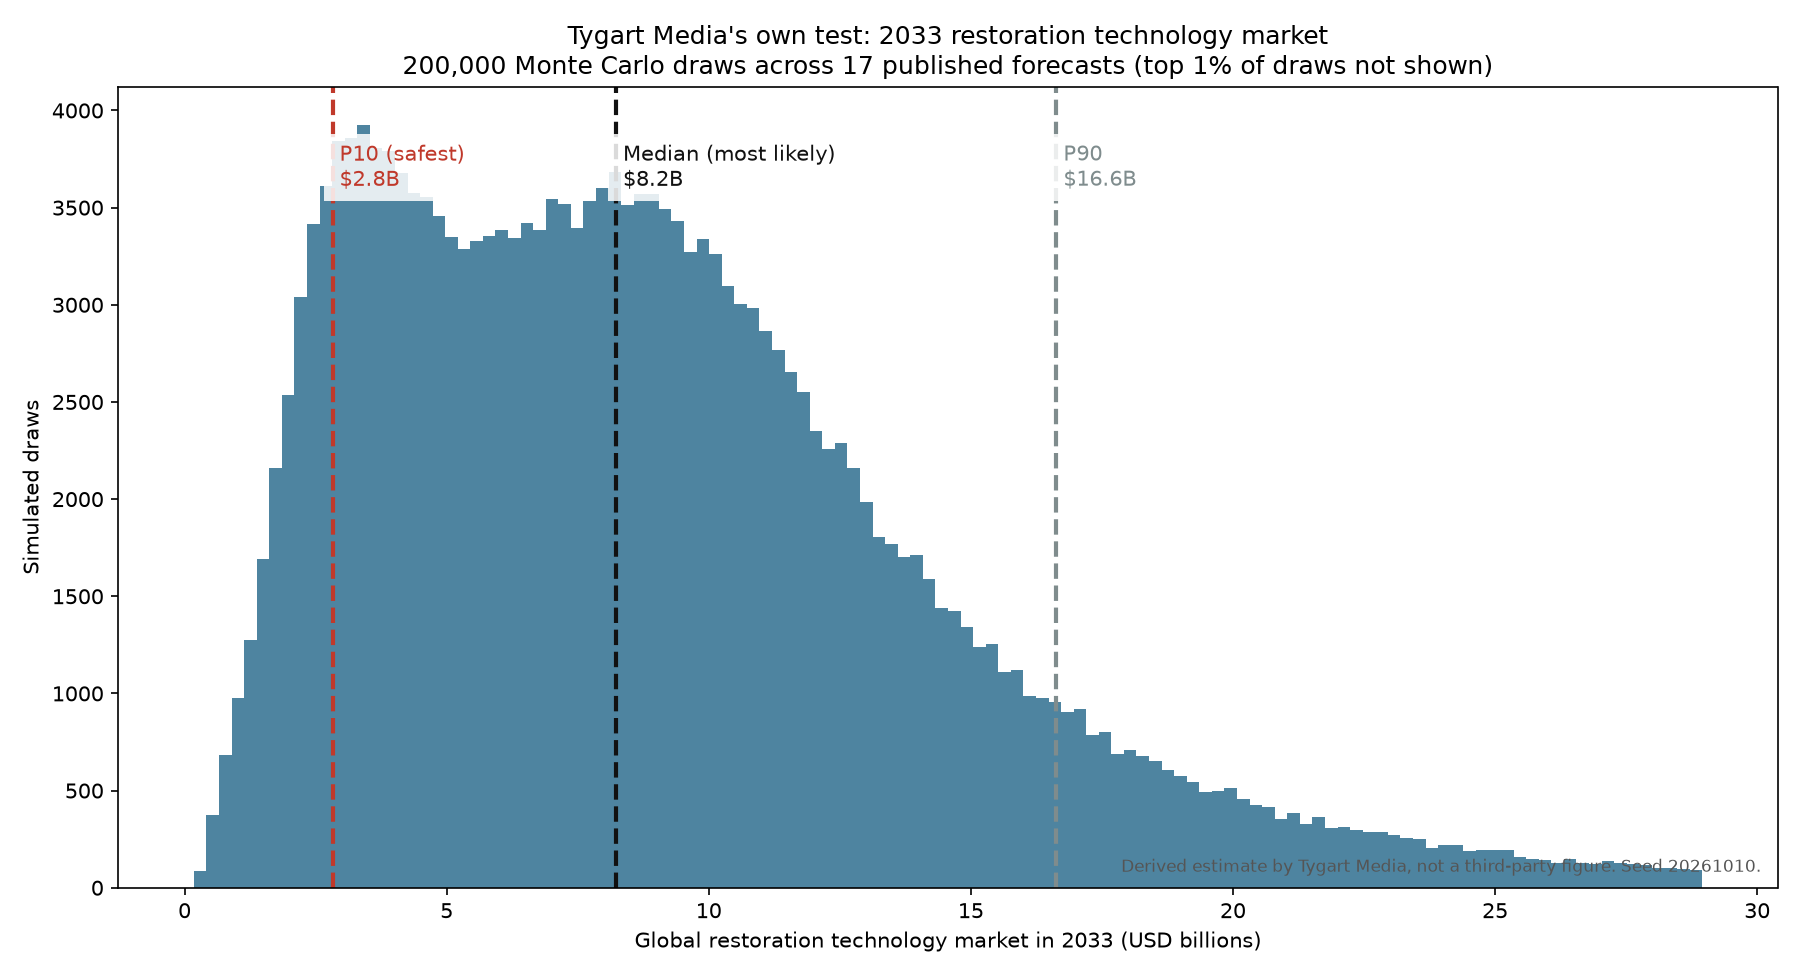
- Most likely (median): about $8.2 billion global restoration technology spend in 2033. When we need a figure ending in .5, we use $8.5 billion.
- Safest (P10, conservative): about $2.8 billion, or $2.5 billion rounded down to the nearest .5. There is a 90% chance the real number is higher.
- High case (P90): about $16.6 billion.
- All three numbers are Tygart Media’s own derived estimates from a 200,000-draw Monte Carlo simulation over 17 published forecasts. Please cite them as “Tygart Media’s own test,” not as a market-research figure.
Why we ran this test
An older post of ours on AI in disaster restoration said the restoration technology market would reach a figure “by 2033.” Somewhere along the way the number fell out of the sentence, and our saved revisions didn’t have it either. When we went looking for a source to restore it, we found a lot of forecasts for restoration services, a few for restoration software, and several reports called “building restoration technology” that turn out to be about stone, timber and church restoration. None of them measures what the sentence was about.
So instead of guessing, we ran the numbers ourselves and are showing all the work.
What we measured: global spending in 2033 on technology used to restore property after water, fire, mold and storm damage. That covers restoration and claims software and platforms, AI and photo-based damage assessment, drying and moisture equipment, and monitoring sensors. Figures are in US dollars.
The sources
| Publisher | What it measures | Where | Published figure | Weight |
|---|---|---|---|---|
| Dataintelo | Property Restoration Software Market | Global | $2.8B (2025) to $5.2B (2033) | 0.54 |
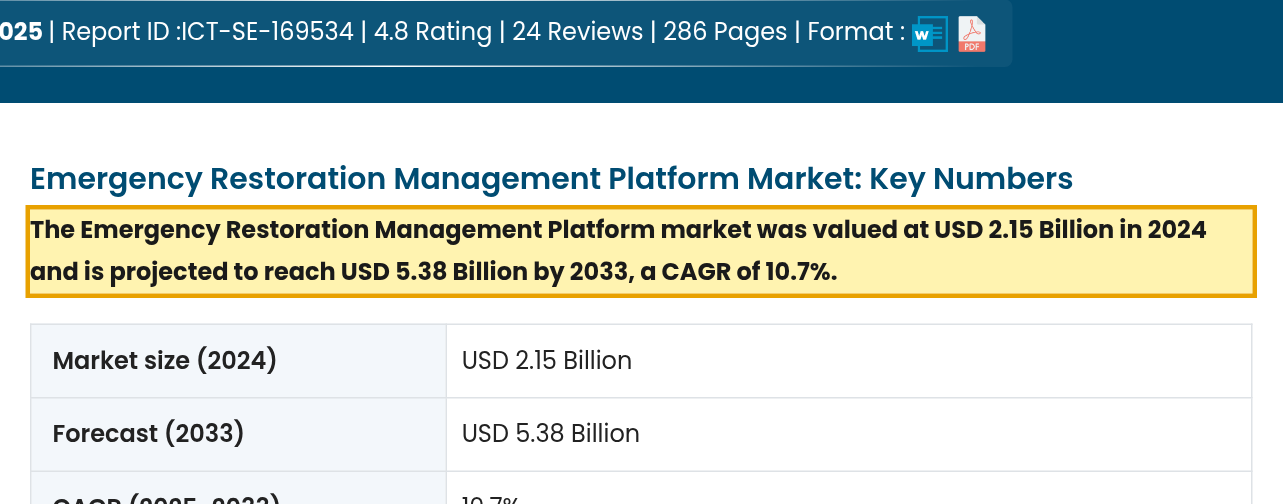
| Growth Market Reports | Emergency Restoration Management Platform Market | Global | $2.15B (2024) to $5.38B (2033) | 0.40 |
| HTF Market Intelligence | Restoration Management Software Market | Global | $0.6B (2025) to $1.5B (2033) | 0.40 |
| Growth Market Reports | Property Claims Estimation Software Market | Global | $1.85B (2024) to $4.25B (2033) | 0.30 |
| Growth Market Reports | Claims Photo Estimating AI for Property Market | Global | $1.49B (2024) to $6.33B (2033) | 0.20 |
| Verified Market Reports | Fire and Water Restoration Service Market | Global | $16.47B (2025) to $31.17B (2033) | 0.25 |
| Market Research Intellect | Fire And Water Restoration Service Market | Global | $16.5B (2024) to $25.8B (2033) | 0.25 |
| Future Market Report | Property Restoration Services Market | Global | $12.1408B (2025) to $20.3103B (2033) | 0.25 |
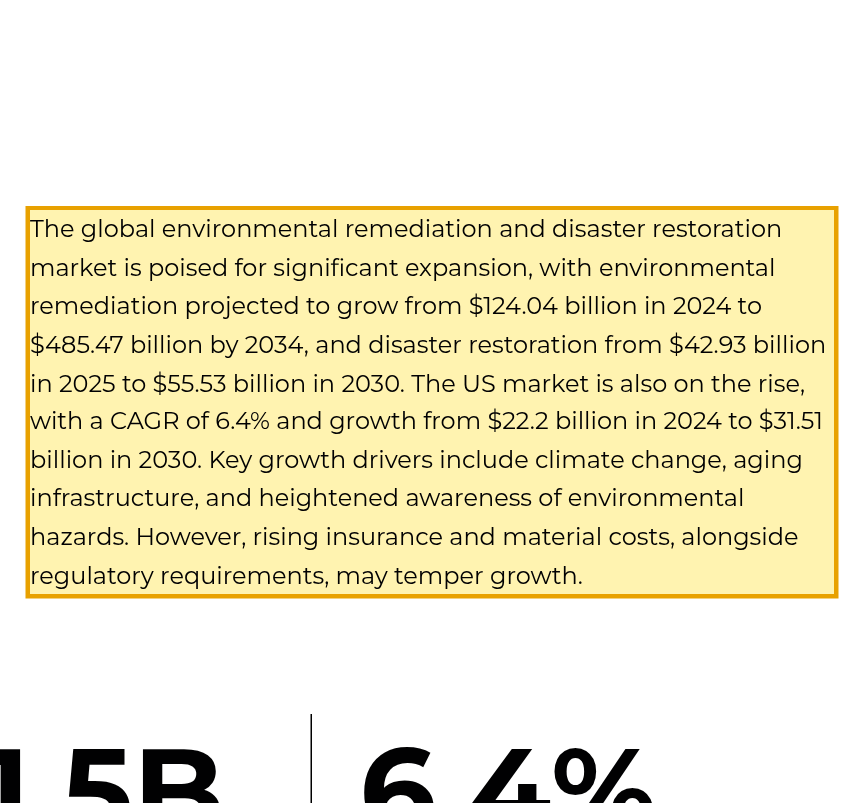
| Bainbridge | Restoration & Remediation industry report | Global | $42.93B (2025) to $55.53B (2030) | 0.35 |
| Bainbridge | Restoration & Remediation industry report | US | $22.2B (2024) to $31.51B (2030) | 0.28 |
| IBISWorld | Damage Restoration Services in the US | US | $7.7B (2026) to $7.7B (2026) | 0.32 |
| HTF MI (htfmarketinsights.com) | Fire damage restoration Market + Water damage restoration Market | Global | $31.7B (2025) to $76.5B (2033) | 0.06 |
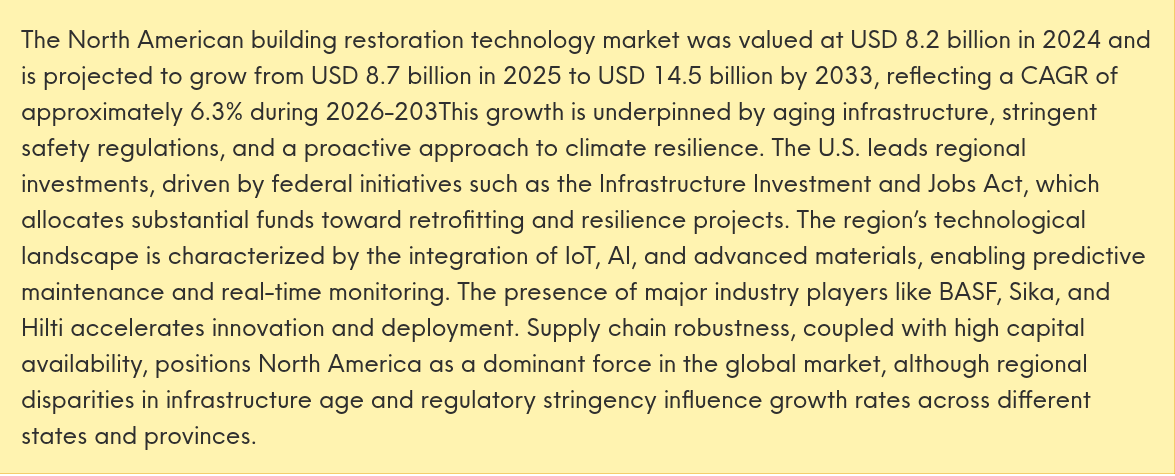
| Verified Market Reports | Building Restoration Technology Market | North America | $8.7B (2025) to $14.5B (2033) | 0.07 |
| Verified Market Reports | Building Restoration Technology Market | Global | $12.5B (2025) to $25B (2034) | 0.06 |
| Business Research Insights | Building Restoration Technology Market | Global | $146.32B (2026) to $249.53B (2035) | 0.04 |
| Cognitive Market Research | Building Restoration and Maintenance Technology Market | Global | $130.958B (2025) to $251.741B (2033) | 0.06 |
| DataHorizzon Research | Building Restoration Service Market | Global | $56.8B (2024) to $98.5B (2033) | 0.10 |
Five reports size restoration technology directly. Ten size restoration services or very broad building restoration, and for those we had to estimate the technology slice. Three examples of what the sources actually say:
The method in plain English
- Line every forecast up on 2033. Some stop in 2030 and some run to 2035. We moved each one to 2033 using its own growth rate, give or take 1.5 percentage points, because nobody’s growth rate is exact.
- Convert US-only figures to global. The US is 25% to 42% of the world market depending on the report, so we sampled across that range.
- Translate each report into “technology.” A software report only covers part of the technology market, so we scaled it up. A services report covers far more than technology, so we took a slice of it, somewhere between 6% and 25% with 14% most likely. A heritage “building restoration” report gets an even thinner slice, 2% to 10%.
- Allow for sloppy methods. Every draw gets some random error, and the error is bigger for publishers whose pages contradict themselves.
- Draw 200,000 times. Each draw picks one source, with better-fitting and more credible sources picked more often, then applies all of the above. The spread of the 200,000 answers is the result.
The simulation is seeded (20261010), so it gives the same answer every time it runs. A second seed moves the median by less than $0.05 billion.
Results and sensitivity
Across all draws, the middle of the distribution is about $8.2 billion, half of the draws fall between $4.7 and $12.0 billion, and 80% fall between $2.8 and $16.6 billion. That is a wide range, and it is wide because the sources disagree about what the market even is.
Pooling the sources a different way (averaging all of them in every draw instead of picking one) gives a tighter $7.4 billion median. For the US alone, the median is about $2.7 billion.
Then we changed one assumption at a time to see what moves the answer:
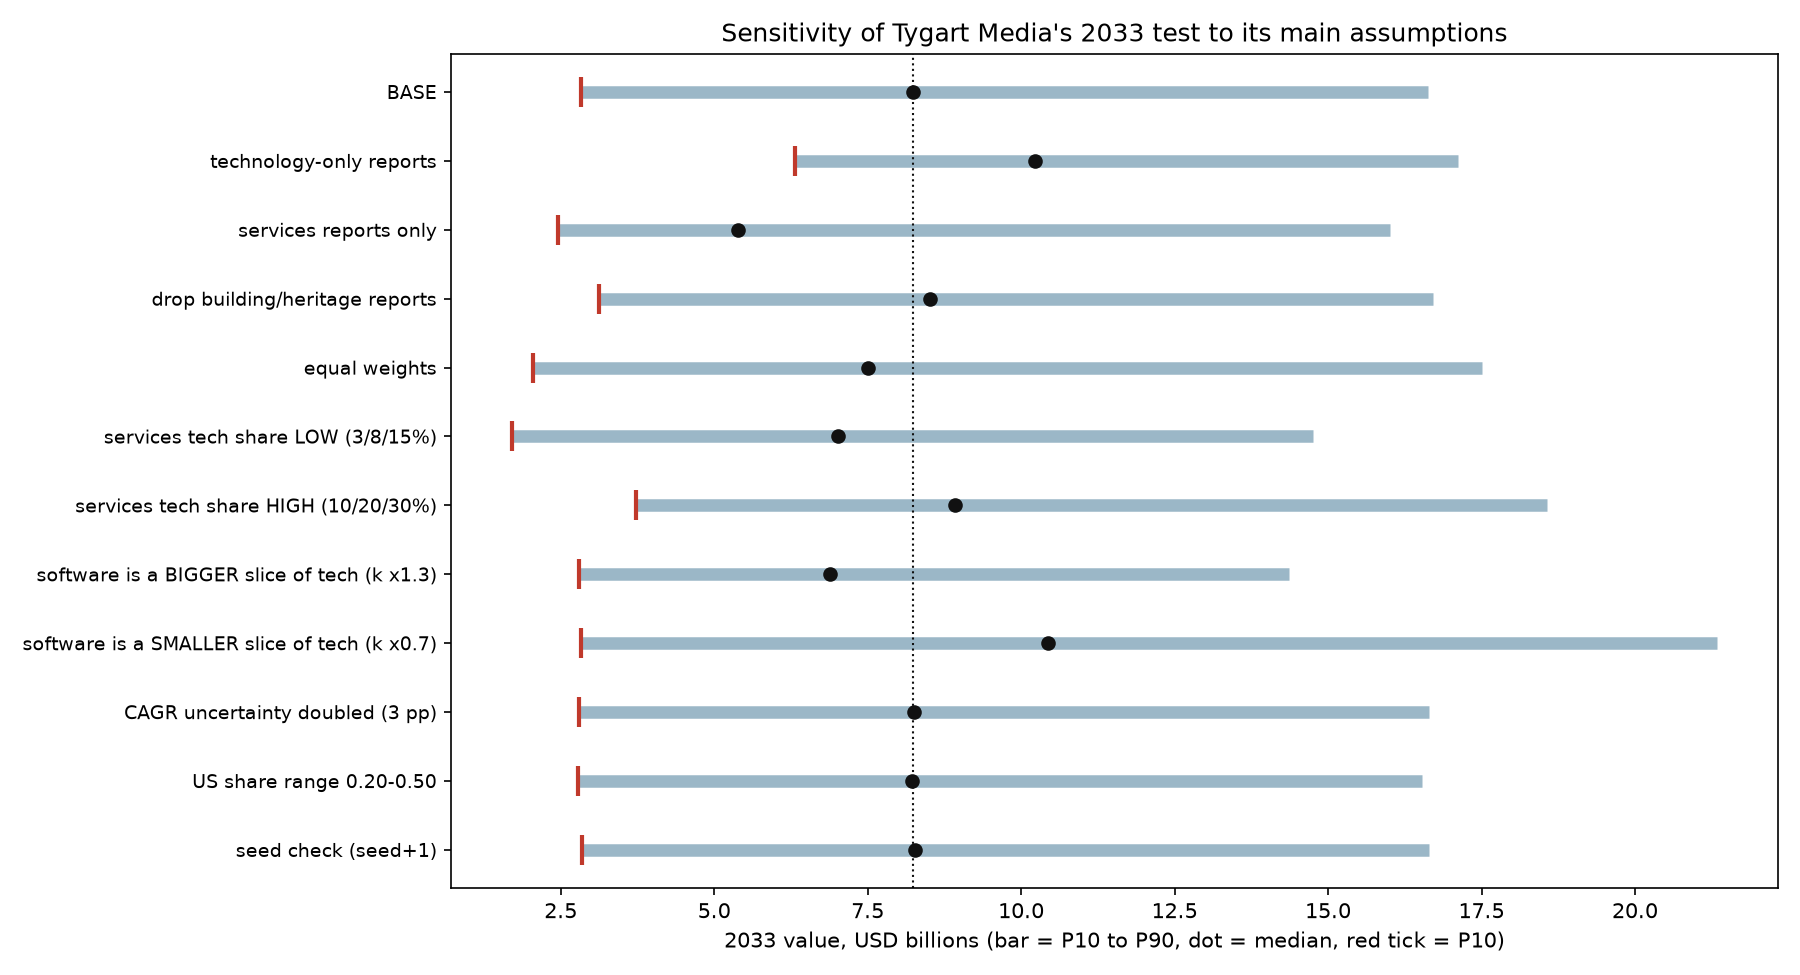
- Using only the technology reports raises the median to $10.2 billion. Using only the services reports lowers it to $5.4 billion. This is the biggest swing in the whole test.
- Assuming technology takes a smaller share of services spending gives $7.0 billion. A bigger share gives $8.9 billion.
- Weighting every source equally gives $7.5 billion.
- Doubling the growth-rate uncertainty or widening the US share range barely changes anything.
- Dropping any single source keeps the median between $7.7 and $8.8 billion, so no one report drives the result.
Why $8.5 billion: it is the nearest .5 figure to the median, it sits between the two pooling methods, and it stays inside the middle range in every sensitivity case. If you need a number that is very unlikely to overstate the market, use the safest figure, $2.5 billion.
Limitations
- The technology data is thin. Only five public reports size restoration technology directly. They come from syndicated publishers that don’t publish their methods, and they overlap: the same estimating software vendors appear in several of them.
- The two biggest assumptions are ours. How much of restoration services spending goes to technology, and how much of the technology market is software, have no published measurement. We set honest ranges and showed what happens when they move.
- Some sources contradict themselves. One “building restoration technology” page gives a $25 billion global figure for 2034 but regional 2033 figures that add up to about $58 billion. Another lists two different 2035 totals. We gave those pages very little weight.
- The weights are editorial judgment. The equal-weight check shows how much that matters, about $0.7 billion on the median.
- No paid reports. We only used figures that are publicly visible, so we did not buy any full analyst reports.
- This is a forecast of forecasts. It can’t be more reliable than the reports it is built on. Treat it as a reasoned range, not a fact.
Every source we used
- Dataintelo: Property Restoration Software Market (updated May 2026) (used, technology). link
- Growth Market Reports: Emergency Restoration Management Platform Market (used, technology). link
- HTF Market Intelligence: Restoration Management Software Market (to 2033) (used, technology). link
- Growth Market Reports: Property Claims Estimation Software Market (used, technology). link
- Growth Market Reports: Claims Photo Estimating AI for Property Market (used, technology). link
- Verified Market Reports: Fire and Water Restoration Service Market (updated May 24 2026) (used, services). link
- Market Research Intellect: Fire And Water Restoration Service Market (used, services). link
- Future Market Report: Property Restoration Services Market (2026-2033) (used, services). link
- Bainbridge: Restoration & Remediation industry report (used, services). link
- Bainbridge: Restoration & Remediation industry report (US) (used, services). link
- IBISWorld: Damage Restoration Services in the US (Aug 2026) (used, services). link
- HTF MI (htfmarketinsights.com): Fire damage restoration Market + Water damage restoration Market (summed) (used, services). link and link
- Verified Market Reports: Building Restoration Technology Market (updated May 25 2026) – North America section (used, building or heritage). link
- Verified Market Reports: Building Restoration Technology Market (updated May 25 2026) – global headline (used, building or heritage). link
- Business Research Insights: Building Restoration Technology Market (updated Aug 27 2026) (used, building or heritage). link
- Cognitive Market Research: Building Restoration and Maintenance Technology Market (used, building or heritage). link
- DataHorizzon Research: Building Restoration Service Market (used, building or heritage). link
- Bainbridge: Restoration & Remediation industry report (checked, not used; Different industry (environmental cleanup, NAICS 562910-type), not property damage restoration). link
- Coherent Market Insights: Mold Remediation Service Market 2026-2033 (checked, not used; Sub-segment only (already inside fire/water/property restoration totals)). link
- Research Intelo: Predictive Maintenance for Buildings Market (checked, not used; One of the drivers named in post 169, but it is facility-maintenance tech, not restoration). link
- Dataintelo: Air Movers Market (used to set the technology-share bounds). link
- JBKnowledge (via Procore): Construction Technology Report (2021) (used to set the technology-share bounds). link
- Associated General Contractors of America / Sage: 2016 Construction Outlook (press release Jan 6 2016) (used to set the technology-share bounds). link
- Data Insights Market: Restoration Management Software (USD 945M to 1.60B by 2030, 9.3%) (checked, not used; Excluded because the page could not be verified). link
Prepared by Tygart Media in October 2026. This page will be updated if better technology-specific data becomes available.
Leave a Reply