Tag: Property Damage Restoration

  • Restoration Technology Market Projection: Our 2033 Test

    Restoration Technology Market Projection: Our 2033 Test

    Our own test, not a third-party figure. We could not find any published forecast that sizes the technology side of property restoration for 2033, so we built one from the forecasts that do exist. Here is the answer up front.

    • Most likely (median): about $8.2 billion global restoration technology spend in 2033. When we need a figure ending in .5, we use $8.5 billion.
    • Safest (P10, conservative): about $2.8 billion, or $2.5 billion rounded down to the nearest .5. There is a 90% chance the real number is higher.
    • High case (P90): about $16.6 billion.
    • All three numbers are Tygart Media’s own derived estimates from a 200,000-draw Monte Carlo simulation over 17 published forecasts. Please cite them as “Tygart Media’s own test,” not as a market-research figure.
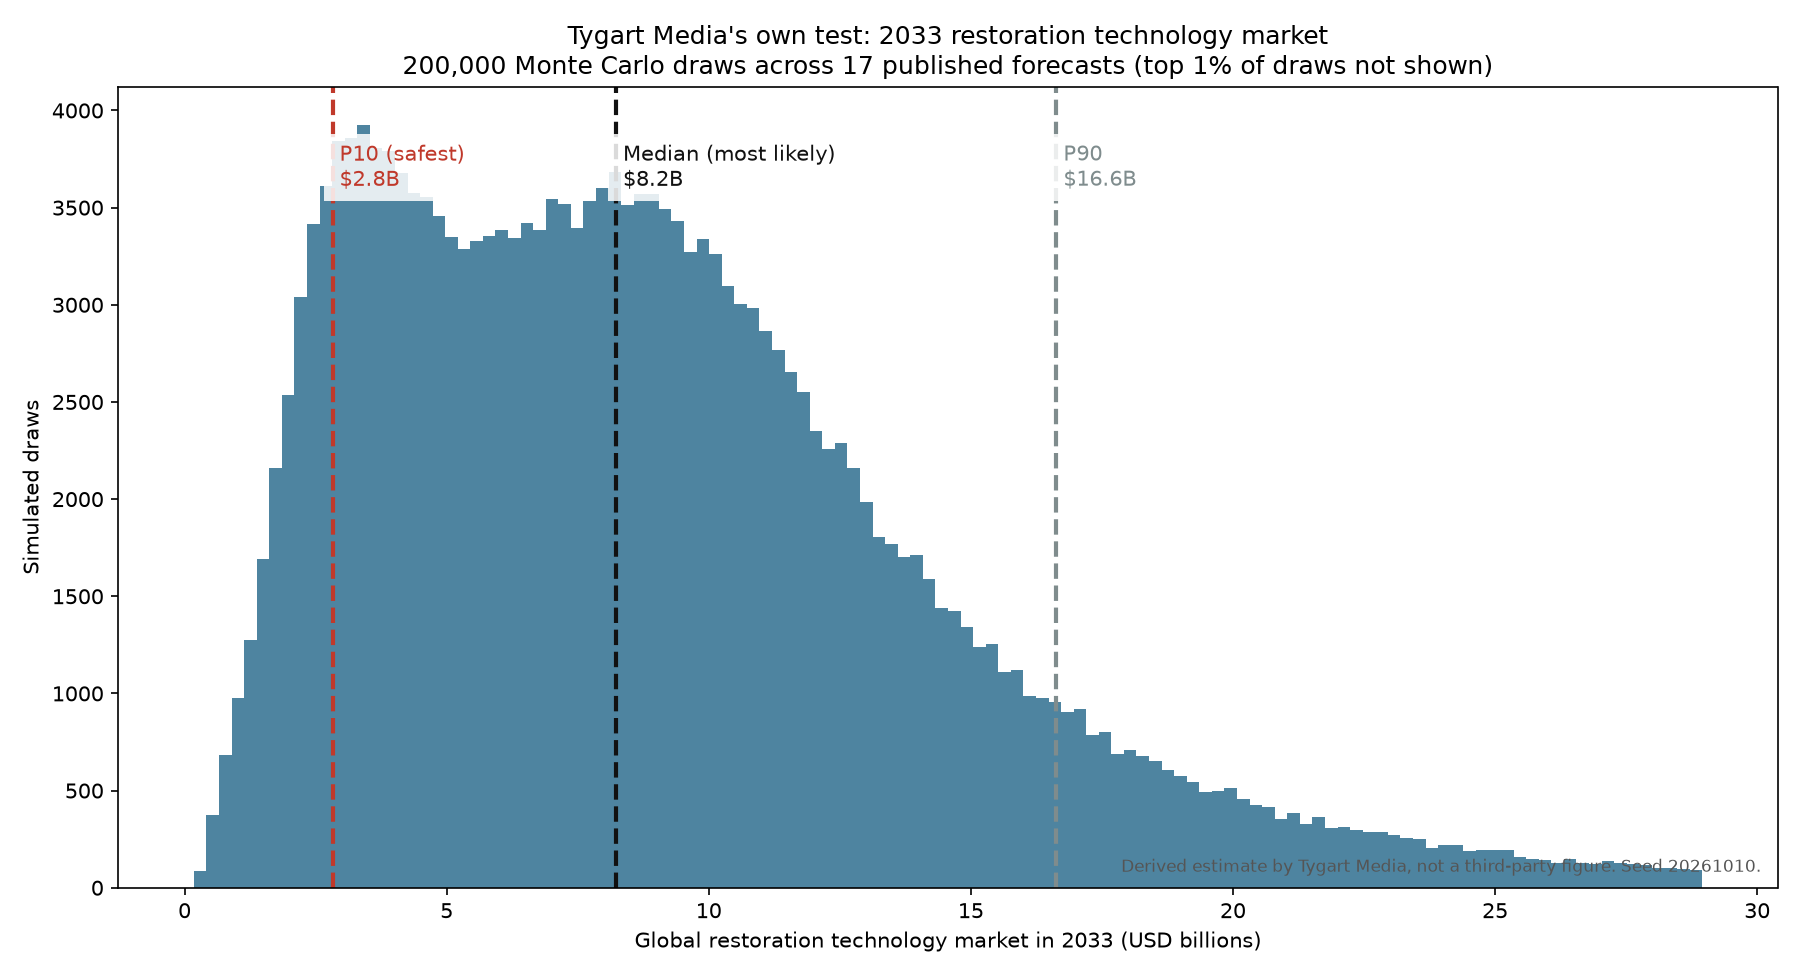
    Histogram of 200,000 simulated 2033 values for the global restoration technology market, with the P10 at about 2.8 billion dollars, the median at about 8.2 billion and the P90 at about 16.6 billion
    Our own test: 200,000 simulated 2033 values. Median about $8.2B, P10 about $2.8B, P90 about $16.6B.

    Why we ran this test

    An older post of ours on AI in disaster restoration said the restoration technology market would reach a figure “by 2033.” Somewhere along the way the number fell out of the sentence, and our saved revisions didn’t have it either. When we went looking for a source to restore it, we found a lot of forecasts for restoration services, a few for restoration software, and several reports called “building restoration technology” that turn out to be about stone, timber and church restoration. None of them measures what the sentence was about.

    So instead of guessing, we ran the numbers ourselves and are showing all the work.

    What we measured: global spending in 2033 on technology used to restore property after water, fire, mold and storm damage. That covers restoration and claims software and platforms, AI and photo-based damage assessment, drying and moisture equipment, and monitoring sensors. Figures are in US dollars.

    The sources

    PublisherWhat it measuresWherePublished figureWeight
    DatainteloProperty Restoration Software MarketGlobal$2.8B (2025) to $5.2B (2033)0.54
    Growth Market ReportsEmergency Restoration Management Platform MarketGlobal$2.15B (2024) to $5.38B (2033)0.40
    HTF Market IntelligenceRestoration Management Software MarketGlobal$0.6B (2025) to $1.5B (2033)0.40
    Growth Market ReportsProperty Claims Estimation Software MarketGlobal$1.85B (2024) to $4.25B (2033)0.30
    Growth Market ReportsClaims Photo Estimating AI for Property MarketGlobal$1.49B (2024) to $6.33B (2033)0.20
    Verified Market ReportsFire and Water Restoration Service MarketGlobal$16.47B (2025) to $31.17B (2033)0.25
    Market Research IntellectFire And Water Restoration Service MarketGlobal$16.5B (2024) to $25.8B (2033)0.25
    Future Market ReportProperty Restoration Services MarketGlobal$12.1408B (2025) to $20.3103B (2033)0.25
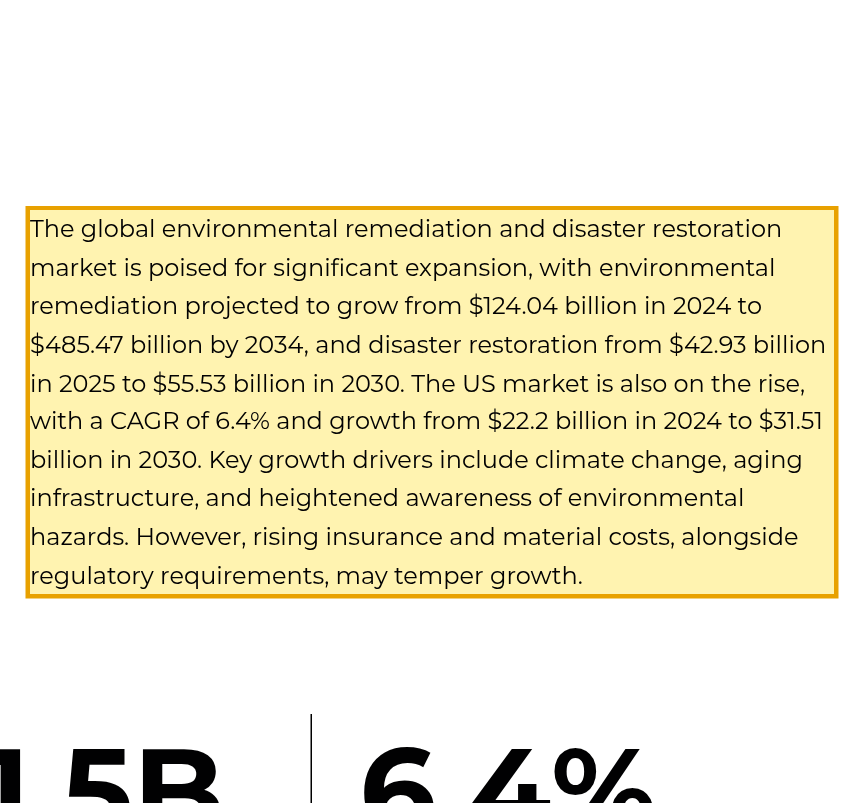
    BainbridgeRestoration & Remediation industry reportGlobal$42.93B (2025) to $55.53B (2030)0.35
    BainbridgeRestoration & Remediation industry reportUS$22.2B (2024) to $31.51B (2030)0.28
    IBISWorldDamage Restoration Services in the USUS$7.7B (2026) to $7.7B (2026)0.32
    HTF MI (htfmarketinsights.com)Fire damage restoration Market + Water damage restoration MarketGlobal$31.7B (2025) to $76.5B (2033)0.06
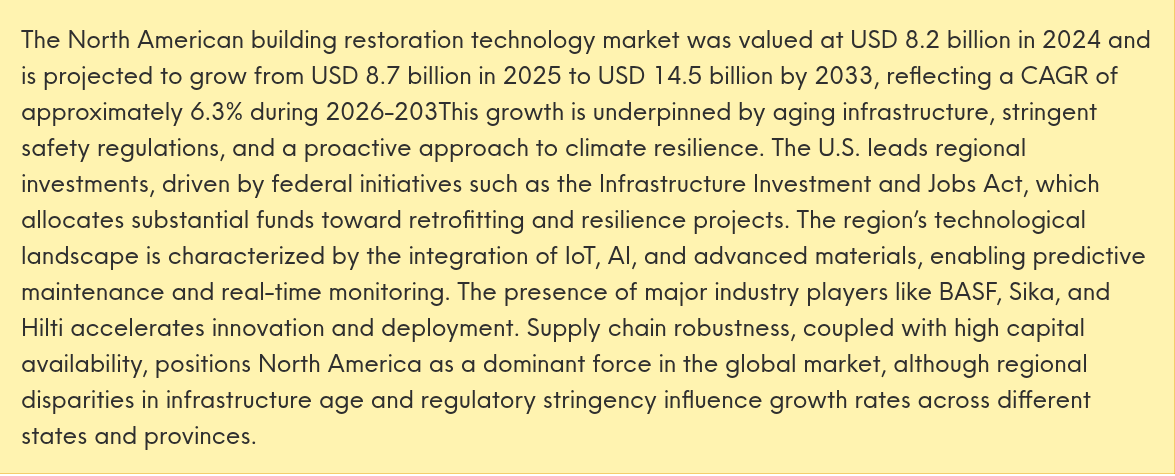
    Verified Market ReportsBuilding Restoration Technology MarketNorth America$8.7B (2025) to $14.5B (2033)0.07
    Verified Market ReportsBuilding Restoration Technology MarketGlobal$12.5B (2025) to $25B (2034)0.06
    Business Research InsightsBuilding Restoration Technology MarketGlobal$146.32B (2026) to $249.53B (2035)0.04
    Cognitive Market ResearchBuilding Restoration and Maintenance Technology MarketGlobal$130.958B (2025) to $251.741B (2033)0.06
    DataHorizzon ResearchBuilding Restoration Service MarketGlobal$56.8B (2024) to $98.5B (2033)0.10
    The 17 forecasts used in the simulation. Weight = how well the scope fits (0 to 1) × how credible and internally consistent the page is (0 to 1). We checked every figure on the live page on October 10, 2026.

    Five reports size restoration technology directly. Ten size restoration services or very broad building restoration, and for those we had to estimate the technology slice. Three examples of what the sources actually say:
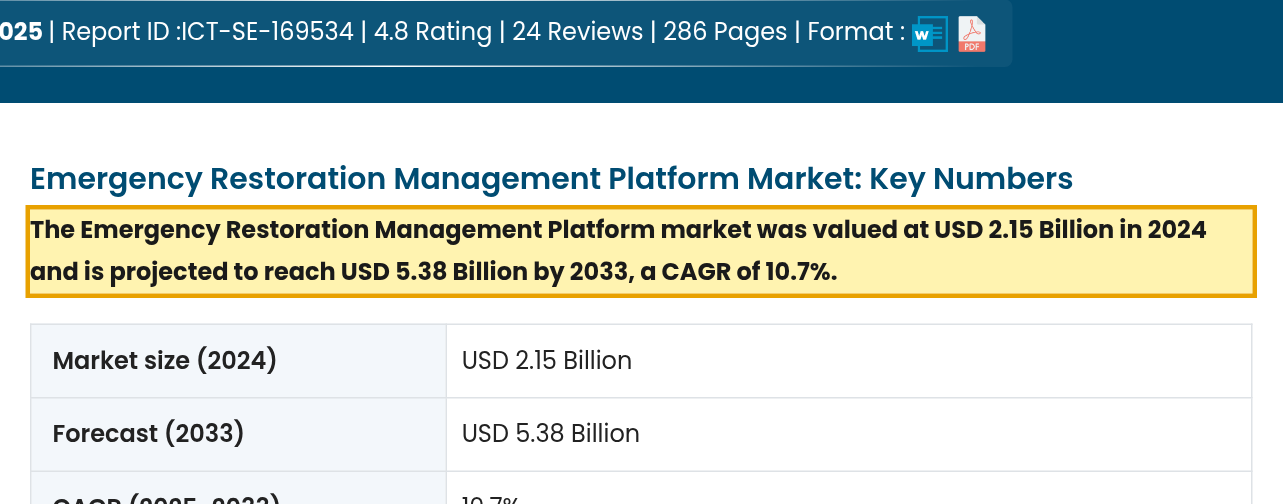
    Screenshot of the Growth Market Reports page stating the Emergency Restoration Management Platform market was 2.15 billion dollars in 2024 and is projected to reach 5.38 billion by 2033
    A technology-only report: restoration management platforms. Source: Growth Market Reports (screenshot Oct 10, 2026).
    Screenshot of the Bainbridge summary stating disaster restoration grows from 42.93 billion dollars in 2025 to 55.53 billion in 2030 and the US market from 22.2 billion in 2024 to 31.51 billion in 2030
    A services report: the whole restoration industry, not just its technology. Source: Bainbridge (screenshot Oct 10, 2026).
    Screenshot of the Verified Market Reports paragraph stating the North American building restoration technology market is projected to grow to 14.5 billion dollars by 2033
    A “building restoration technology” report that is really about heritage and structural work. The headline on the same page says $12.5B (2025) to $25B (2034) for the whole world. Source: Verified Market Reports (screenshot Oct 10, 2026).

    The method in plain English

    1. Line every forecast up on 2033. Some stop in 2030 and some run to 2035. We moved each one to 2033 using its own growth rate, give or take 1.5 percentage points, because nobody’s growth rate is exact.
    2. Convert US-only figures to global. The US is 25% to 42% of the world market depending on the report, so we sampled across that range.
    3. Translate each report into “technology.” A software report only covers part of the technology market, so we scaled it up. A services report covers far more than technology, so we took a slice of it, somewhere between 6% and 25% with 14% most likely. A heritage “building restoration” report gets an even thinner slice, 2% to 10%.
    4. Allow for sloppy methods. Every draw gets some random error, and the error is bigger for publishers whose pages contradict themselves.
    5. Draw 200,000 times. Each draw picks one source, with better-fitting and more credible sources picked more often, then applies all of the above. The spread of the 200,000 answers is the result.

    The simulation is seeded (20261010), so it gives the same answer every time it runs. A second seed moves the median by less than $0.05 billion.

    Results and sensitivity

    Across all draws, the middle of the distribution is about $8.2 billion, half of the draws fall between $4.7 and $12.0 billion, and 80% fall between $2.8 and $16.6 billion. That is a wide range, and it is wide because the sources disagree about what the market even is.

    Pooling the sources a different way (averaging all of them in every draw instead of picking one) gives a tighter $7.4 billion median. For the US alone, the median is about $2.7 billion.

    Then we changed one assumption at a time to see what moves the answer:
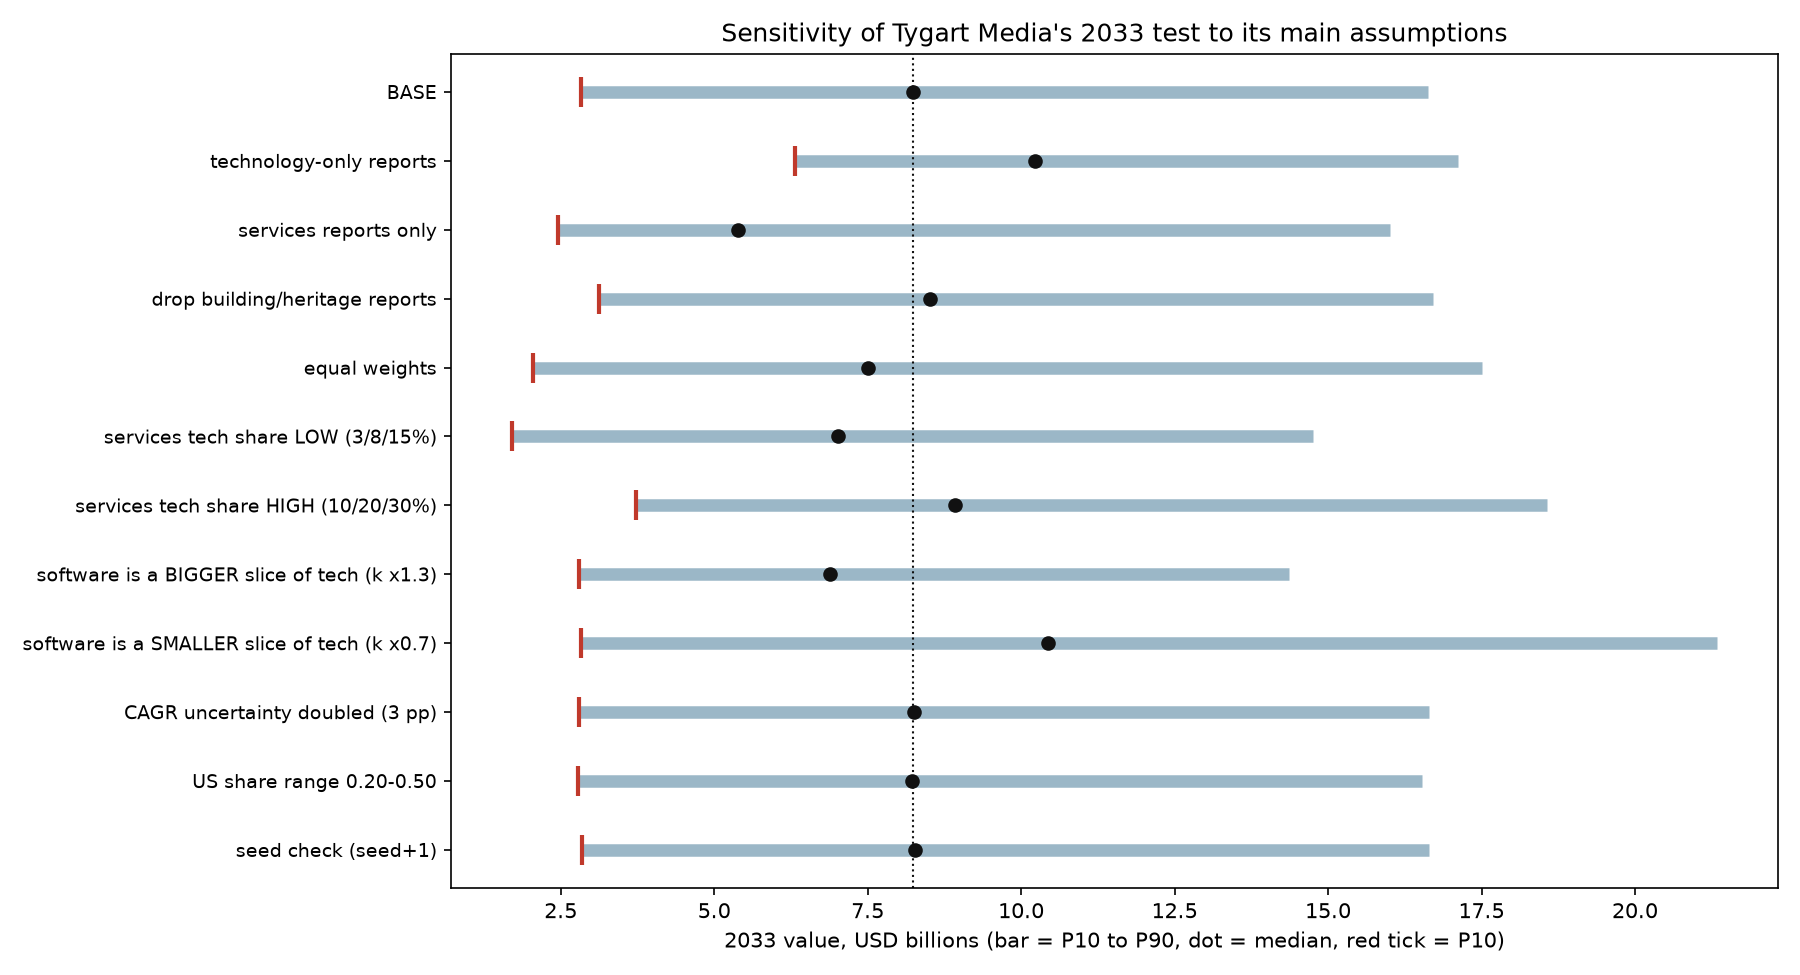
    Sensitivity chart showing the 2033 median and P10 to P90 range under eleven alternative assumptions, with medians between about 5.4 and 10.4 billion dollars
    How the 2033 answer moves when we change one assumption at a time. Bar = P10 to P90, dot = median.
    • Using only the technology reports raises the median to $10.2 billion. Using only the services reports lowers it to $5.4 billion. This is the biggest swing in the whole test.
    • Assuming technology takes a smaller share of services spending gives $7.0 billion. A bigger share gives $8.9 billion.
    • Weighting every source equally gives $7.5 billion.
    • Doubling the growth-rate uncertainty or widening the US share range barely changes anything.
    • Dropping any single source keeps the median between $7.7 and $8.8 billion, so no one report drives the result.

    Why $8.5 billion: it is the nearest .5 figure to the median, it sits between the two pooling methods, and it stays inside the middle range in every sensitivity case. If you need a number that is very unlikely to overstate the market, use the safest figure, $2.5 billion.

    Limitations

    • The technology data is thin. Only five public reports size restoration technology directly. They come from syndicated publishers that don’t publish their methods, and they overlap: the same estimating software vendors appear in several of them.
    • The two biggest assumptions are ours. How much of restoration services spending goes to technology, and how much of the technology market is software, have no published measurement. We set honest ranges and showed what happens when they move.
    • Some sources contradict themselves. One “building restoration technology” page gives a $25 billion global figure for 2034 but regional 2033 figures that add up to about $58 billion. Another lists two different 2035 totals. We gave those pages very little weight.
    • The weights are editorial judgment. The equal-weight check shows how much that matters, about $0.7 billion on the median.
    • No paid reports. We only used figures that are publicly visible, so we did not buy any full analyst reports.
    • This is a forecast of forecasts. It can’t be more reliable than the reports it is built on. Treat it as a reasoned range, not a fact.

    Every source we used

    • Dataintelo: Property Restoration Software Market (updated May 2026) (used, technology). link
    • Growth Market Reports: Emergency Restoration Management Platform Market (used, technology). link
    • HTF Market Intelligence: Restoration Management Software Market (to 2033) (used, technology). link
    • Growth Market Reports: Property Claims Estimation Software Market (used, technology). link
    • Growth Market Reports: Claims Photo Estimating AI for Property Market (used, technology). link
    • Verified Market Reports: Fire and Water Restoration Service Market (updated May 24 2026) (used, services). link
    • Market Research Intellect: Fire And Water Restoration Service Market (used, services). link
    • Future Market Report: Property Restoration Services Market (2026-2033) (used, services). link
    • Bainbridge: Restoration & Remediation industry report (used, services). link
    • Bainbridge: Restoration & Remediation industry report (US) (used, services). link
    • IBISWorld: Damage Restoration Services in the US (Aug 2026) (used, services). link
    • HTF MI (htfmarketinsights.com): Fire damage restoration Market + Water damage restoration Market (summed) (used, services). link and link
    • Verified Market Reports: Building Restoration Technology Market (updated May 25 2026) – North America section (used, building or heritage). link
    • Verified Market Reports: Building Restoration Technology Market (updated May 25 2026) – global headline (used, building or heritage). link
    • Business Research Insights: Building Restoration Technology Market (updated Aug 27 2026) (used, building or heritage). link
    • Cognitive Market Research: Building Restoration and Maintenance Technology Market (used, building or heritage). link
    • DataHorizzon Research: Building Restoration Service Market (used, building or heritage). link
    • Bainbridge: Restoration & Remediation industry report (checked, not used; Different industry (environmental cleanup, NAICS 562910-type), not property damage restoration). link
    • Coherent Market Insights: Mold Remediation Service Market 2026-2033 (checked, not used; Sub-segment only (already inside fire/water/property restoration totals)). link
    • Research Intelo: Predictive Maintenance for Buildings Market (checked, not used; One of the drivers named in post 169, but it is facility-maintenance tech, not restoration). link
    • Dataintelo: Air Movers Market (used to set the technology-share bounds). link
    • JBKnowledge (via Procore): Construction Technology Report (2021) (used to set the technology-share bounds). link
    • Associated General Contractors of America / Sage: 2016 Construction Outlook (press release Jan 6 2016) (used to set the technology-share bounds). link
    • Data Insights Market: Restoration Management Software (USD 945M to 1.60B by 2030, 9.3%) (checked, not used; Excluded because the page could not be verified). link

    Prepared by Tygart Media in October 2026. This page will be updated if better technology-specific data becomes available.

  • Storm Updates: Arizona + Southeastern Utah Flash Flood Outbreak — Tuesday, September 16, 2026

    This is a live storm update and search-demand pulse for Tuesday, September 16, 2026. A monsoon outbreak produced two flash-flood clusters: eight NWS Flash Flood Warnings across Arizona (issued 10:27–11:51 AM MST) covering Maricopa County (Phoenix metro), Pinal County, Pima County (Tucson area), Gila County, and Coconino County (Labyrinth/Face Canyon watersheds), plus two warnings for southeastern Utah’s San Juan County drainages south of Lake Powell (issued 12:01 and 12:34 PM MDT). Several Arizona warnings were tagged life-threatening, with 0.5–1.5 inches already fallen and rates up to 2 inches per hour.

    Flash flooding in desert washes and slot-canyon country moves fast. Verify local conditions with the National Weather Service before travel. Turn around, don’t drown.

    Cluster 1 — Arizona

    Warnings spanned Phoenix metro through Tucson and north into Coconino watersheds. Heavy monsoon cells dumped short-duration, high-rate rain onto urban pavement and desert soils that shed runoff into washes and underpasses.

    Arizona Search Demand (measured live)

    Google Trends pulls (live browser, no CAPTCHA) show East Valley hire-intent leading the state:

    SignalWindowReading
    water damage restoration mesa az7d+850%
    water damage restoration mesa7d+450%
    Mesa (city topic)7d+400%
    Glendale (city topic)7d+250%
    Cost (topic, seed: flood damage repair)7d+250%
    flood damage restoration30d+170%
    water damage restoration phoenix az7d / 30dBreakout
    flood damage restoration near me / flood restoration near me / flood restoration companies30dBreakout

    Trending Now (Arizona, past 7d): “flood watch” 20K+ searches / +1,000% (active); “flash flood warning” 500+ / +1,000% and 200+ / +800%. Hottest metros: Phoenix AZ 100 · Yuma AZ–El Centro CA 81 · Tucson (Sierra Vista) AZ 67. City-level breakout query language also hit Tempe, Scottsdale, Tucson, and Phoenix AZ.

    Cluster 2 — Southeastern Utah

    Two warnings covered San Juan County drainages south of Lake Powell, including Labyrinth Canyon — life-threatening flash flooding of slot canyons and dry washes.

    Utah Search Demand (measured live)

    SignalWindowReading
    emergency water damage restoration30d+4,350%
    water damage restoration services30d+1,400%
    water damage restoration services near me30d+1,100%
    water damage restoration near me30d+750%
    water damage restoration service near me30dBreakout
    flood damage restoration near me / flood damage restoration7dBreakout
    flood restoration salt lake city30dBreakout
    water mitigation company30dBreakout

    What Homeowners Should Do in the First Hours

    • Stop the source if safe: Do not enter flowing washes or standing water near electrical panels.
    • Document high-water marks before cleanup for insurance.
    • Extract before you dry: Mud and silt first; air movers over wet sediment spread contamination.
    • Vet “near me” companies: Ask for IICRC certification, Category 3 blackwater protocol, and written moisture maps — East Valley and Utah “near me” breakouts show hire-intent, not DIY research.
    • Ask the cost question early: Arizona Cost topic +250% on flood damage repair means carriers and deductibles will dominate the next conversation.

    Sources and Verification

    Official data verified against National Weather Service Flash Flood Warnings for Arizona and southeastern Utah (10 warnings, new to the day’s watermark); Google Trends Arizona and Utah regional datasets (7-day and 30-day windows), measured live via browser with no CAPTCHA blocks.

    Informational brief only — not an official warning broadcast. Monitor NOAA Weather Radio and local county emergency management for evacuation and shelter orders.

  • Storm Updates: 2.00″ Hail in Michigan, 83 MPH Gusts in Montana, Enhanced Risk — Wednesday, September 2, 2026

    Current Hotspots & Active Risk Zones

    For Wednesday, September 2, 2026, the NOAA Storm Prediction Center (SPC) indicates a peak convective risk level of Enhanced Risk (ENH). Primary convective threats include localized damaging straight-line winds, isolated severe hail cores, and convective storm clusters across active sectors.

    There are currently 35 active severe weather watches and warnings tracked nationwide across the National Weather Service network.

    Recent Impact & Local Storm Reports (Past 12–24 Hours)

    Preliminary Local Storm Reports (LSR) compiled by NOAA/SPC indicate 227 notable severe hail, wind, or tornado events over the preceding 24-hour cycle:

    • Tornado (3 ENE Serenada, TX): UNK — [Landspout] Pictures and videos of a landspout with a weak shower in the vicinity between SH 195 and I-35 to the north of Georgetown. Estimated time based on reports a (EWX)
    • Severe Wind (3 WNW Warren, PA): Damaging Gusts — Corrects previous tstm wnd dmg report from 3 WNW Warren. Multiple trees down around the 1900 block of Follett Run Road. (CTP)
    • Severe Wind (Oakfield, NY): Damaging Gusts — Trees down in Elba. (BUF)
    • Severe Wind (8 NNE Tionesta, PA): Damaging Gusts — Trees and wires down. (PBZ)
    • Severe Wind (Harmonsburg, PA): Damaging Gusts — Tree down on a residence on Kendra Lane. (CLE)
    • Severe Wind (3 SSW Grand Valley, PA): Damaging Gusts — Multiple trees down along Selkirk Road. (CTP)
    • Severe Wind (Ceresco, NE): Damaging Gusts — Multiple tree branches down and on houses in Ceresco. Also some windows blown out of a business. Time estimated from radar. (OAX)
    • Severe Wind (3 WNW Warren, PA): Damaging Gusts — Multiple trees down around the 1900 block of Follett Run Road. (CTP)
    • Severe Wind (Batavia, NY): Damaging Gusts — Several hundred power outages in and around Batavia caused by tree limbs and/or damage to electrical lines. (BUF)
    • Severe Wind (Leicester, NY): Damaging Gusts — Trees down. (BUF)
    • Severe Wind (6 WNW Brockway, PA): Damaging Gusts — Trees down. (PBZ)
    • Severe Wind (Livonia, NY): Damaging Gusts — Trees down. (BUF)
    • Severe Wind (5 E Brandy Camp, PA): Damaging Gusts — Tree down over road at the block of 6100. (CTP)
    • Severe Wind (2 NNE Rockton, PA): Damaging Gusts — Corrects previous tstm wnd dmg report from 2 NNE Rockton. Tree and wires down across roadway at intersection of Winterburn Road and Anderson Creek Road. (CTP)
    • Severe Wind (2 NNW Falls Creek, PA): Damaging Gusts — Trees down. (PBZ)

    24–48 Hour Near-Term Outlook

    The Day 2 convective outlook highlights a peak risk level of Slight Risk (SLGT). Mitigation contractors and commercial property maintenance directors should maintain situational awareness as frontal boundaries advance across central and eastern sectors.

    Restoration Operator Notes & Tactical Recommendations

    • Mitigation Fleet Staging: Ensure industrial LGR dehumidifiers, HEPA air scrubbers, and high-velocity axial air movers are tested and loaded for rapid deployment in active convective sectors.
    • Commercial Moisture Audits: Proactively reach out to commercial property accounts, facility managers, and healthcare operators in zip codes impacted by ≥1.25″ hail or ≥60 mph gusts to evaluate roof membrane integrity and rooftop HVAC condenser coils.
    • Emergency Board-Up & Tarping: Prepare roll stock poly, 2×4 lumber, and sandbags for immediate emergency envelope stabilization following severe wind gusts.
    • Field Safety Protocol: Remind field mitigation crews that flash flood waters are classified as Category 3 (black water) bio-hazard contamination requiring full PPE and specialized containment.

    Official Sources & Attribution

    Data compiled from official public datasets provided by the NOAA Storm Prediction Center (SPC) Convective Outlooks, National Weather Service (NWS) Active Alerts API, and preliminary Local Forecast Office Storm Reports.

    Operational Disclaimer: This is a public-data summary for restoration professionals’ situational awareness only. It is not an official weather forecast. Always verify with the National Weather Service, local NWS forecast offices, and official watches/warnings. Preliminary storm reports are unfiltered and subject to change. Do not make critical life-safety or structural dispatch decisions solely based on this brief.

  • The Profit Detective Playbook

    The Profit Detective Playbook

    The Profit Detective Playbook

    $497

    Delivered by email after checkout.

    Buy Now →

    Secure checkout via Square — all major cards accepted

    You can copy this method and do it yourself. Pull your own P&L. Score the five leak zones. Cost ten jobs. Age the AR. Run a 90-day reset on one leak. Buy Now is the packaged course: seven modules, the linked tools, and the exercises so you are not assembling the curriculum from scratch.

    This is the self-paced DIY version of the Profit Detective Diagnostic. Restoration owners doing $1M-$15M who suspect they are leaving money on the table and want a repeatable way to find it before hiring a consultant.

    How it works

    Seven modules. Each one teaches a leak zone, then hands you a tool to do the detective work on your own business. Work one module a week or binge it. Do the exercises. That is where the money is.

    1. The Profit Detective Method (plus the Restoration Profitability Pyramid)
    2. Estimating & Scope Leaks
    3. Job Costing & Margin Leaks
    4. Cash Flow & Collections Leaks
    5. Sales & Conversion Leaks
    6. Leadership & Overhead Leaks
    7. The 90-Day Restoration Reset

    Think like a detective, not an optimist

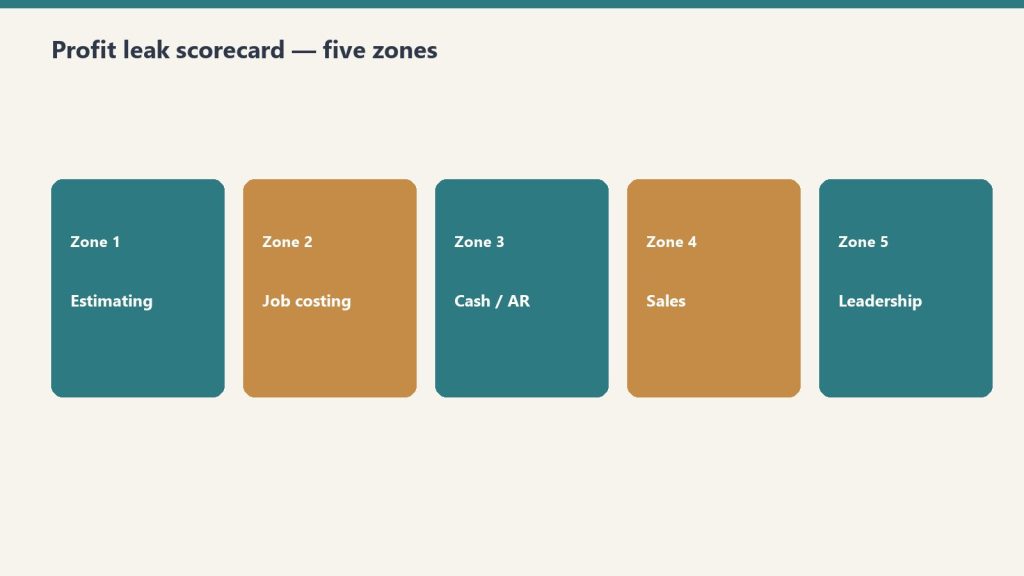
    Five zone panels: estimating, job costing, cash/AR, sales, leadership
    Think like a detective — score the five zones before you guess.

    Most owners run on opinion. “We’re busy, so we must be profitable.” A detective wants evidence. The method’s three habits:

    1. Evidence over opinion. Pull the number before you defend the story.
    2. Follow the money. A dollar of revenue passes through five checkpoints before it becomes profit. Find which checkpoint it is escaping at.
    3. Assume a leak exists. You are not asking if. You are asking where and how big.

    The playbook’s teaching: in 150+ restoration companies, every one was leaking somewhere between 5% and 15% of revenue. Not because the owners were lazy. Because nobody was looking. A $4M shop leaking a conservative 8% is $320,000 a year. That is the method’s example math, not a promise about your shop.

    The Restoration Profitability Pyramid

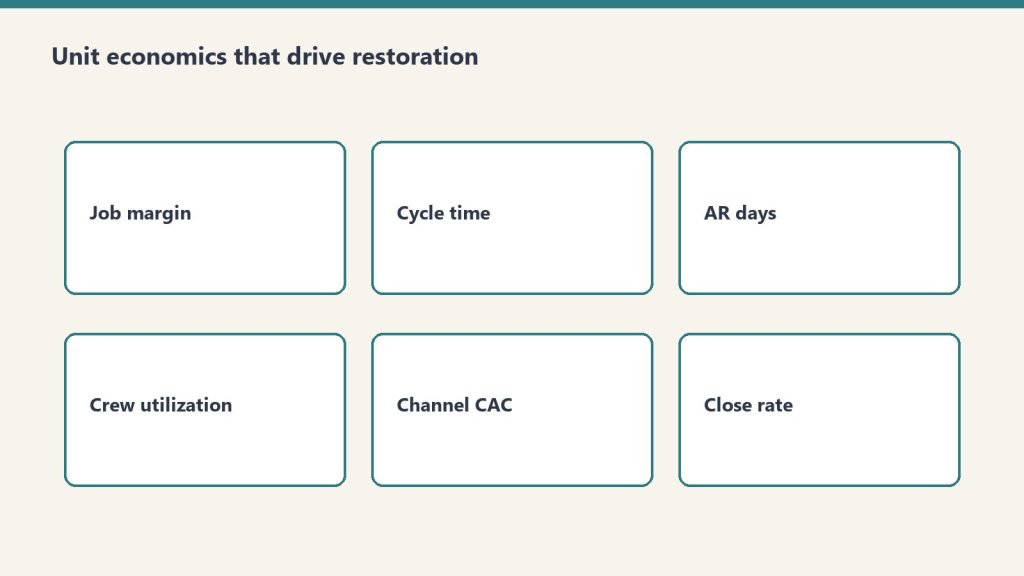
    Six cards covering job margin, cycle time, AR days, utilization, CAC, close rate
    Profitability pyramid starts with unit economics, not slogans.

    Four stacked layers. Revenue at the bottom. Gross margin above it. Net profit above that. At the top: owner freedom (cash, time, the ability to walk away from the truck).

    Most owners spend 90% of their energy on the bottom layer. More leads, more trucks, more revenue. The rule: climb the pyramid from the middle, not the bottom. A 3-point improvement in gross margin on $4M is $120,000, and it costs nothing in new marketing. Growing revenue 3 points to get the same dollars means more jobs, more risk, more chaos. Ask: can I make this dollar worth more before I chase another one?

    What “normal” looks like (starting case file)

    Pull two documents: trailing-12 P&L, and a job-costing report for your last 20-30 completed jobs (revenue, labor, materials, subs, equipment). If your software cannot produce job-level margin, that is your first finding.

    • Gross margin: healthy mitigation 45-55%; blended with reconstruction 35-45%. Below 35% blended is a margin leak.
    • Net profit: a well-run shop nets 10-20%. Single digits means the leak is real and findable.
    • Overhead: if fixed overhead is eating more than 25-30% of revenue, Zone 5 is calling.
    • AR over 90 days: more than 15-20% of receivables past 90 is a Zone 3 bleed.

    Circle anything outside those ranges. That is spotting where the evidence disagrees with the story.

    The five zones, and how to work each one

    1. Estimating & scope

    Money left in the estimate. If it is not documented, you ate it. The line items that vanish most often: detach & reset, PPE, monitoring / daily site visits, containment, equipment days, after-hours / emergency service, content manipulation.

    The discipline: review every job’s final cost against the original estimate, tagged by estimator and job type. Filter jobs where the biggest leak is Scope/Estimate. Find the repeating miss, not the outlier. Coach that one habit.

    What good looks like: final cost within about ±5% of estimate on most jobs, because the scope was right the first time. A weekly variance review, by estimator.

    2. Job costing & margin

    Four cost buckets: labor, equipment, materials, subs. Labor is the #1 leak (hours over estimate, unbilled drive and idle time, milked T&M). Equipment sits on closed jobs, unbilled. Materials slip. Subs compress margin when the invoice exceeds what you billed the carrier.

    Run a mid-job margin check at the halfway point of every significant job. Close-out cost every job within 3-5 days of the final visit, not at month-end. Log last 10 closed jobs with all four buckets. Sort by true gross margin. Name the money-losers. Flag every job where actual labor beat estimate by more than 10%. Write one sentence on the worst one: what leaked, and in which bucket.

    3. Cash flow & collections

    You are the customer’s bank. DSO = (Accounts Receivable ÷ Total Credit Revenue) × Number of Days. Age the buckets: 0-30 leave it; 31-60 watch; 61-90 a human on the phone this week; 90+ is a write-off countdown.

    Collections cadence with a name and a day: Day 0 confirm receipt; Day 14 friendly status; Day 30 escalate by phone; Day 45 owner or controller in writing; Day 60 formal demand path. One person owns the list. Same standing time every week. Track submitted supplements to collection, not just to submission.

    4. Sales & conversion

    For the last 90 days, log qualified leads and jobs sold. Divide. That is your conversion rate. A rough number beats a shrug.

    Four leaks: missed business-hours calls; no source attribution on paying jobs; quotes that get zero follow-up; slow speed-to-lead on emergency work. The playbook’s rule: every estimate gets a touch within 24 hours, then day 4, then day 8. Three touches before it is dead. Answer live, or call back within 10 minutes during business hours. Track quote status: Sent / Followed-Up / Won / Lost.

    5. Leadership & overhead

    If you disappeared for 30 days and the business grinds to a halt, you own a job, not an asset. Tag a typical week: $15/hour work vs $1,000/hour work. Audit subscriptions, idle trucks, and roles that were created for a person, not a need.

    The highest-leverage move in this zone: build one middle manager who can own the daily run. Run an owner-dependency audit. Pick the top 3 bottlenecks. Hand each one through a 1-3-1 (one issue, three options, one recommendation). Drain overhead while you are in there.

    The 90-Day Restoration Reset

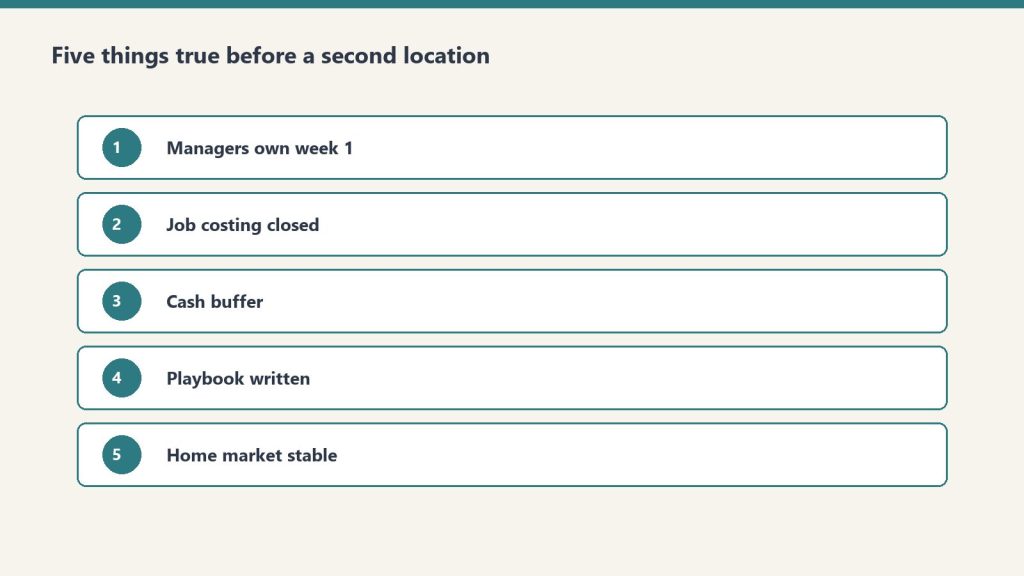
    Numbered checklist of five readiness conditions before opening location two
    90-day reset: fix the biggest leak, then the next.

    You will find leaks in all five zones. You do not have five projects. Rank by dollars at stake. One zone per quarter.

    1. Weeks 1-2: Measure & pick. Put a real dollar figure on the top leak. Write today’s baseline.
    2. Weeks 3-4: Install the fix. The specific playbook from that zone. New estimate checklist, job-costing review, weekly AR block, or lead-follow-up rule with a name on it.
    3. Weeks 5-8: Make it an SOP. One page. Hand it to the person who owns it. Watch it run for a month without you.
    4. Weeks 9-12: Review & lock. Re-pull the same number. Fold the metric into the dashboard. Only then turn to the next zone.

    Once a month, 30 minutes, same five numbers: gross margin %, net %, AR over 90, conversion %, overhead % of revenue. Same day each month. When a number drifts, you catch it in weeks.

    The playbook’s compounding example: a 3-point margin gain on a $3M shop is $90,000, at zero new marketing. Recovered margin funds the next fix.

    What you should be able to say out loud

    • “My gross margin is ___ %.” An actual number.
    • “My worst leak zone is ___.” Named from the Scorecard, not a hunch.
    • “I’m fixing one zone at a time.”
    • A written 90-day plan with a measured baseline and a lock-in date.
    • A monthly diagnostic already on the calendar.

    If you want the packaged course

    You can run the method from the outline above. Buy Now is the playbook delivered by email after checkout: the seven modules, the linked tools (Scorecard, Gap-Finder, KPI Dashboard, Claims Command Center, Leadership tools), and the detective-work exercises. Same Square button at the top of this page.

    This is an operational course. Not legal, insurance, or licensing advice. The dollar examples in the modules are teaching math, not a guarantee.

    Frequently Asked Questions

    Is there a refund policy?

    Because this is a digital product, all sales are final. If you have a problem with your purchase, email will@tygartmedia.com and we will sort it out.

    How is this delivered?

    Within 24 hours of purchase via email from will@tygartmedia.com. You will receive your download link — Notion duplicate link, skill file, or both depending on the product.

    Related on Tygart Media: profit leak scorecard · job-costing gap-finder · owner freedom kit.

  • Google Ads Analysis

    Google Ads Analysis

    Google Ads Analysis

    $250

    Delivered by email after checkout.

    Buy Now →

    Secure checkout via Square — all major cards accepted

    You can copy this method and do it yourself. Split campaigns by service. Load negatives before you spend another week. Match every landing page to its ad group. Compute fully-loaded cost per acquired job, not just CPC. Buy Now is the packaged analysis delivered by email after checkout, so you are not assembling the read from a blank spreadsheet.

    Restoration PPC is an engineering problem, not a set-it-and-forget-it expense. Emergency water-damage keywords have been reported as high as $250 per click in competitive metros. Average emergency restoration keywords more commonly land in the $40-$150 range depending on geography. At those CPCs, structure and landing pages decide whether the phone pays you or you subsidize the auction.

    How to run the analysis

    1. Open the account. List every campaign, ad group, and the landing URL each ad actually hits.
    2. Mark the single-campaign trap if you see it: one campaign, one ad group, water / mold / fire / flood keywords fighting each other, every ad pointing at the homepage.
    3. Pull Search Terms for the last 30-60 days. Tag wasted queries (jobs, DIY, training, equipment rental).
    4. Check bidding against conversion volume. Under 30 conversions a month in a campaign is a different tool than 30+.
    5. Open each landing page on a phone. Does the H1 match the ad? Is click-to-call above the fold?
    6. Write fully-loaded cost per acquired job by channel: spend ÷ booked jobs from that channel, then layer close rate. CPC from the dashboard is not that number.

    1. Kill the single-campaign trap

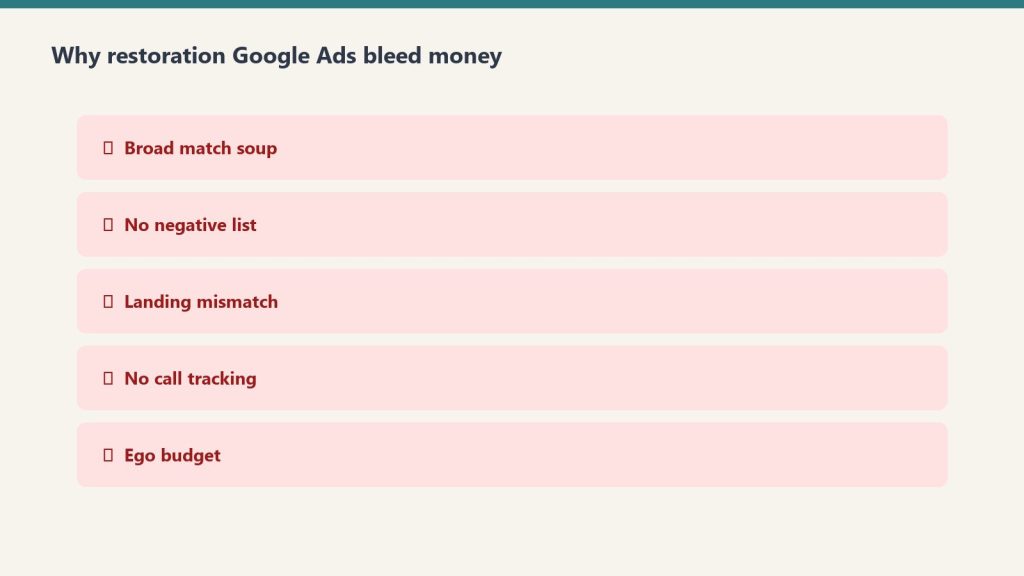
    Red checklist of five reasons restoration Google Ads waste budget
    Kill the single-campaign trap first.

    The most common setup: one campaign, one ad group, a mix of water damage, mold removal, fire restoration, and flood cleanup keywords all fighting each other. Every click gets the same generic ad. Every ad points to the homepage.

    Quality Score is built on expected click-through rate, ad relevance, and landing page experience. When you stuff water damage and fire restoration into the same ad group, ad relevance tanks for both. A Quality Score of 9 can outrank a competitor bidding twice as much at a 5. Poor structure can inflate CPC by 30% or more while delivering fewer qualified leads.

    Split by service. Each ad group 10-20 tightly related keywords. Every keyword in the group has to fit the same ad and the same landing page. If they do not, split them.

    • Campaign 1. Emergency water damage. Ad groups for emergency water extraction, burst pipe, basement flooding, sewage backup. Separate ad copy. Landing page that opens with emergency water damage, not the homepage.
    • Campaign 2. Fire and smoke restoration. Fire damage, smoke damage, soot removal. Different call to action. Fire jobs are longer projects, a different sales conversation.
    • Campaign 3. Mold remediation. Mold testing, black mold removal, mold inspection. Often a separate buyer with a different timeline.

    Give Performance Max its own campaign and its own budget if you run it. PMax black-box reporting will otherwise hide whether Search is working.

    2. Negative keywords: the bill you are not seeing

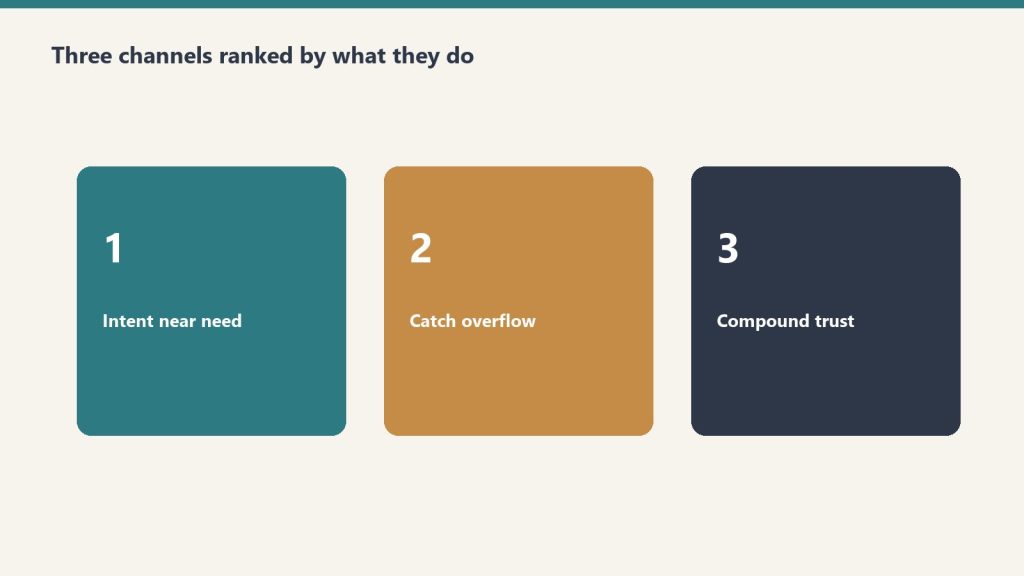
    Three ranked panels: intent near need, catch overflow, compound trust
    Negatives are the bill you are not seeing.

    Most restoration PPC campaigns have a weak or nonexistent negative list. Every day without one, you pay for job seekers (“water damage restoration jobs near me”), DIY researchers (“how to do water damage restoration yourself”), students looking for training, and equipment renters who are not calling you for service.

    Campaigns that actively manage negatives see a reported 10-20% lower wasted spend and a 5-15% conversion-rate lift. On a $10,000/month budget, that is $1,000-$2,000 a month currently going to irrelevant clicks.

    Build a seed negative list before the campaign launches. Pull Search Terms weekly for the first 60 days. Add exact-match negatives first. Only go broader if the data supports it. Over-blocking with broad-match negatives will starve volume you actually want.

    3. Bidding: stop fighting the machine

    A large share of Google Ads spend now runs through Smart Bidding (Target CPA, Target ROAS, Maximize Conversions). Advertisers using AI bidding have been reported at roughly 22% lower cost per conversion versus manual CPC on average. For restoration, the right tool depends on data:

    • Under 30 conversions per month in a campaign. Maximize Clicks with a CPC cap while you accumulate signal. Smart Bidding starved of conversions produces garbage.
    • 30+ conversions per month. Move to Target CPA. Set the target from actual job margins, not aspirational ones. If a water job averages $12,000 and you close 25% of qualified leads, a $300 CPL target can still profit. If you close under 15%, fix sales before you fix bidding.
    • Large campaigns with consistent job data. Target ROAS becomes viable only if revenue tracking is actually wired into Google Ads. Most restoration accounts do not have that configured.

    The problem is rarely the channel. It is losing track of where the leads went after the phone call.

    4. The landing page has to match the ad

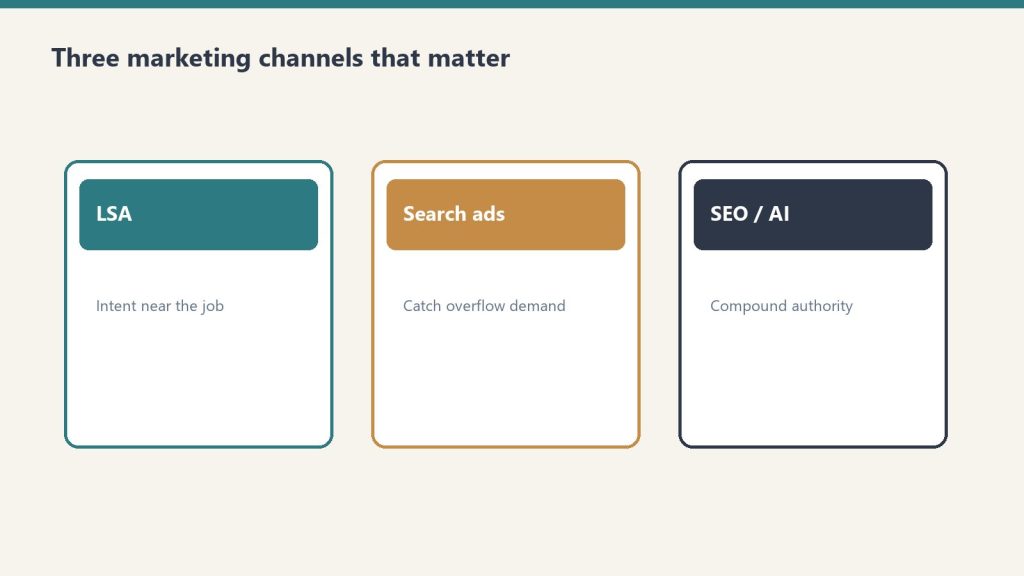
    Three cards for LSA, search ads, and SEO/AI authority channels
    Landing page must match the ad — or you paid for confusion.

    If the ad says “Emergency Basement Flooding, 24/7 Response” and the landing page is the homepage with a hero of a happy family and a form below the fold, you are burning the click you just paid for.

    A restoration PPC landing page needs: the emergency service name in the H1 above the fold; a click-to-call number prominent on mobile; a response-time claim only if you can back it up; one short form (name, phone, zip, issue); proof (reviews, IICRC, insurance logos).

    Do not send PPC traffic to the homepage. Do not build one landing page for all services. Match the ad to the page, the page to the ad group, the ad group to the keyword cluster. That chain is where Quality Score lives.

    5. Channel mix and the number that actually matters

    Three channels do the heavy lifting. LSA (pay per qualified call; reported restoration CPL roughly $80-$200 depending on the write-up) is the highest-ROI paid lever for most residential operators, with a catch: Google ended credits for “job type not serviced” and “geo not serviced” in 2025, so junk leads come out of your pocket. Search Ads (reported CPL $150-$400+ structured, $400-$700+ not) buy control LSA does not have: commercial work, specific service lines, overflow when LSA hits a daily cap, brand defense. If you are spending more than $5,000 a month on Search and you do not have LSAs set up, that is the first fix. SEO is the compounding asset. Restoration SEO in competitive metros typically takes 12-18 months. Treat reported ranges as ranges, not promises.

    Cost-per-lead is the number every vendor reports. The number that matters is fully-loaded cost per acquired job: CPL divided by channel-specific close rate, plus CSR labor on the call, plus processing, minus franchise or TPA fee if it applies. Most shops have CPL from the platform and revenue from the job software, and the two systems have never talked. Fix that before you change a single bid.

    Budget ballparks (Search only, reported)

    • Mid-size market (pop. 200K-500K): $3,000-$6,000/month to generate 15-30 leads
    • Major metro (pop. 1M+): $8,000-$15,000/month to maintain consistent visibility
    • Specific suburb or tight service area: $1,500-$3,000/month if geo is tight and Quality Score is managed

    These are Search figures. They are ballparks from the published method, not a quote for your market.

    Done when

    You can show separate service campaigns, a negative list with at least 50 entries, a dedicated landing page for each major service, and a fully-loaded acquired-job cost by channel. If your current agency cannot show those four, the account is not being run as an engineering problem.

    If you want the packaged analysis

    You can run the six steps from the outline above on your own login. Buy Now is the analysis delivered by email after checkout. Same Square button at the top of this page.

    Marketing and operational read only. Not a media-buy, legal, or insurance engagement. Reported CPC and CPL ranges move by metro and by month. Use your own numbers.

    Related on Tygart Media: restoration Google Ads · marketing stack.

  • Albi vs DASH for Water Damage Restoration Companies (2026)

    Albi vs DASH for Water Damage Restoration Companies (2026)

    Last verified: October 11, 2026. Albi’s published pricing (Base $60/user/month, Pro $100/user/month, $6,000/year minimum) re-confirmed against albiware.com’s pricing page on this check — the June 2026 figures still hold.

    Water damage restoration is a distinct segment of the restoration market. The workflow is moisture-driven — readings, drying curves, equipment logs, IICRC compliance — and the job type demands tools that were built with mitigation in mind, not just general construction project management. This comparison looks at how Albi and Cotality DASH handle water damage work specifically, using only data from each vendor’s own site.

    All data sourced from albiware.com and cotality.com, June 9, 2026.

    Head-to-head for water damage restoration

    Side-by-side comparison cards for Albi and DASH water damage workflows
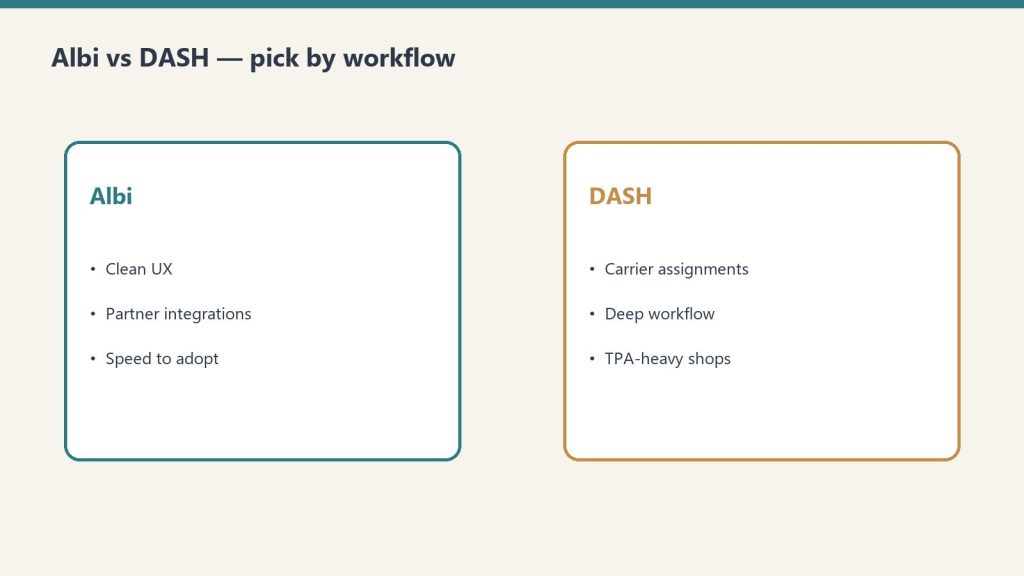
    Pick by workflow — UX speed vs carrier-depth.
    FactorAlbiCotality DASH
    Moisture tracking✅ DryBook 2.0 — built in✅ Via Cotality Mitigate (native integration)
    IICRC S500 alignmentYes (DryBook)Yes (Mitigate + Compliance Manager)
    Xactimate integrationPro seats only ($100/seat/mo)Yes (native, all plans)
    Insurance/TPA workflowModerate — open API + Xactimate on ProStrong — native Cotality ecosystem + Claims Connect
    Mobile offline modeAlbi Mobile (sync when online)True offline — saves locally, syncs later
    Pricing$60 Base / $100 Pro per seat/month; $6K/yr minContact for quote: (866) 774-3282
    Minimum commitment$6,000/year (4 seats)No public minimum — contact Cotality
    QuickBooksOnline + Desktop (Pro seats)Online + Desktop
    Encircle integrationYesYes
    CompanyCamYesNot listed on vendor site
    Support response time7-minute average (per albiware.com)Contact support at cotality.com/support
    CustomizationHigh — built by restorers for restorersModerate — workflow follows DASH structure

    Albi’s water damage strengths

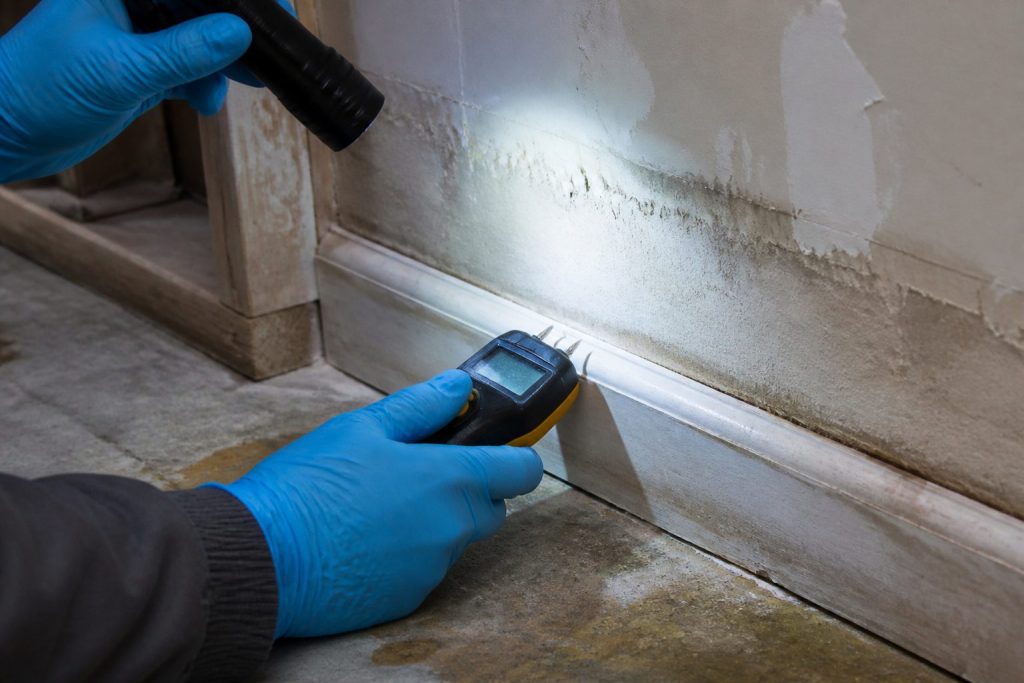
    Gloved hands using a pin-type moisture meter on wet drywall during inspection
    Albi’s strength shows up when techs move fast on moisture documentation.

    Albi was built by restoration contractors, and the water damage workflow shows it. DryBook 2.0 is a purpose-built moisture tracking tool built directly into the Albi platform — not a third-party integration. Field techs log moisture readings, track drying equipment placement, and document the drying curve without switching apps. This matters because moisture documentation is the core evidence for insurance claims on water damage jobs.

    Albi also includes Albi Capture, a newer floor plan tool that’s useful for documenting affected areas precisely. For water damage documentation, accurate floor plans that map equipment placement and affected zones are increasingly expected by carriers.

    The customization angle is real for water damage shops with specific workflows. Albi lets you build custom fields, custom report templates, and custom stages that mirror exactly how your company documents a Category 3 water loss differently from a Category 1. DASH enforces more standardized structure.

    One hard number: Albi’s published support response time is 7 minutes (per albiware.com). For water damage work where a field tech encounters a documentation question mid-job, that matters more than it would for a slower construction workflow.

    DASH’s water damage strengths

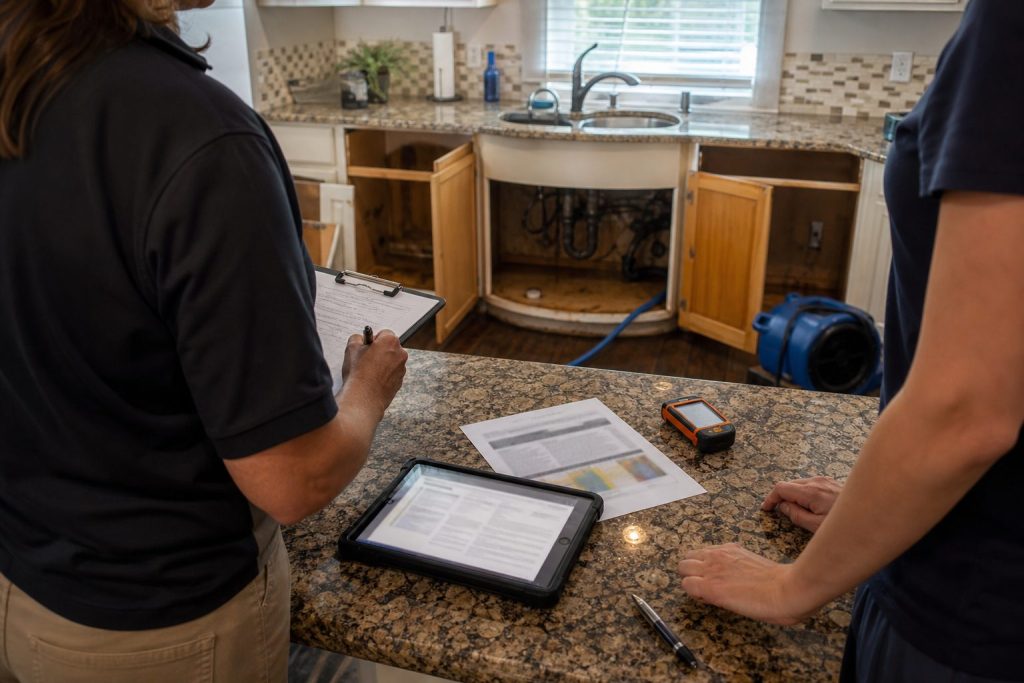
    Clipboard and tablet on a kitchen counter during an insurance adjuster walkthrough after water loss
    DASH’s strength shows up when assignments and adjusters drive the day.

    DASH’s advantage on water damage is the insurance side of the equation. The Compliance Manager builds carrier-specific documentation requirements into field checklists — before your tech leaves the job, DASH has guided them through exactly what the carrier needs. For high-volume insurance water damage work (burst pipes, appliance failures routed through Contractor Connection or similar TPAs), this reduces supplement disputes and documentation rejections.

    For mitigation-specific workflow, Cotality offers Cotality Mitigate as a native add-on — it handles moisture mapping, equipment tracking, and IICRC S500-aligned drying documentation, and feeds directly into the DASH job file. Running both as part of the Cotality ecosystem means your mitigation data lives alongside your job file without import/export friction.

    The offline mobile capability is also a real differentiator for water damage work. Water-damaged structures — flooded basements, saturated wall cavities, HVAC shutdowns — frequently have poor cellular coverage. DASH’s mobile app saves documentation locally and syncs when service returns. Field techs can capture photos, readings, and notes even without a signal.

    The decision for water damage operators

    If your water damage book is primarily insurance-driven (30%+ of revenue from carriers/TPAs) and you work with Contractor Connection, Code Blue, or Cotality-ecosystem TPAs, DASH is the stronger choice. The carrier integration depth and Mitigate add-on are built for this exact workflow.

    If your water damage work is retail-heavy, or you want deep customization in how you document and report mitigation workflows, or you’re a growing shop that values responsive support and transparent per-seat pricing, Albi is the stronger starting point. DryBook 2.0 is purpose-built, and the $6K annual minimum is knowable — you can budget for it without a demo-call sales process.

    Frequently Asked Questions

    Is Albi or DASH better for water damage restoration companies?

    It depends on your revenue mix. DASH (Cotality) is better if you derive 30%+ of revenue from insurance carriers and TPAs — its native Xactimate/XactAnalysis connection and Cotality property data ecosystem give it structural advantages for insurance workflow. Albi is better if you are retail-heavy, want a customizable platform, or need built-in moisture mapping tools like DryBook 2.0. Albi was built by restoration contractors specifically for the water damage workflow.

    Does Albi have moisture tracking for water damage jobs?

    Yes. Albi includes DryBook 2.0, a dedicated moisture tracking and drying management tool built into the platform. It tracks moisture readings, drying equipment, and IICRC S500-aligned documentation for water damage jobs. This is part of the core Albi platform, not an add-on.

    Does DASH have water mitigation tools?

    Yes. Cotality offers a separate product called Cotality Mitigate specifically for water mitigation workflow — it is distinct from DASH but integrates natively with it. DASH also connects natively with Cotality Mitigate for contractors who want both job management and dedicated mitigation documentation in one ecosystem.

    How much does Albi cost for a water damage restoration company?

    Per albiware.com/albi-pricing as of June 2026: Base seats are $60/user/month (field technician features including DryBook 2.0 and field documentation). Pro seats are $100/user/month (adds invoicing, Xactimate/XactAnalysis integration, advanced CRM, accounting integrations). Minimum annual subscription is $6,000 (4 seats required: 2 Base + 2 Pro). Onboarding starts at $1,000 one-time.

    What is Cotality DASH’s water mitigation integration?

    Cotality DASH integrates natively with Cotality Mitigate, a dedicated software product for water mitigation workflow. Mitigate handles moisture mapping, equipment tracking, and IICRC S500-aligned drying documentation. Running both DASH and Mitigate from the same Cotality ecosystem means mitigation data flows directly into the job file without manual entry.

    Does Albi integrate with Xactimate for water damage estimates?

    Yes, on Pro seats. Per albiware.com/albi-pricing, Albi Pro seats ($100/user/month) include Xactimate and XactAnalysis integration. If you’re writing Xactimate estimates for water damage jobs and submitting them to XactAnalysis for carrier review, you need Pro seats for your estimating staff. Base seats ($60/user/month) do not include Xactimate.

    Which platform has better mobile tools for water damage field crews?

    Both are strong. DASH’s mobile app has true offline mode — documentation saves locally and syncs when cellular is restored, which matters in water-damaged structures with poor connectivity. Albi Mobile covers time clock, scheduling, field documentation, moisture readings via DryBook, and photo capture. For crew-heavy water damage shops, Albi’s combined DryBook + mobile workflow is purpose-built for the job type; DASH’s offline reliability is the edge in connectivity-challenged environments.

  • Best Restoration Software Integrations with Xactimate (2026)

    Best Restoration Software Integrations with Xactimate (2026)

    Last verified: October 2026.

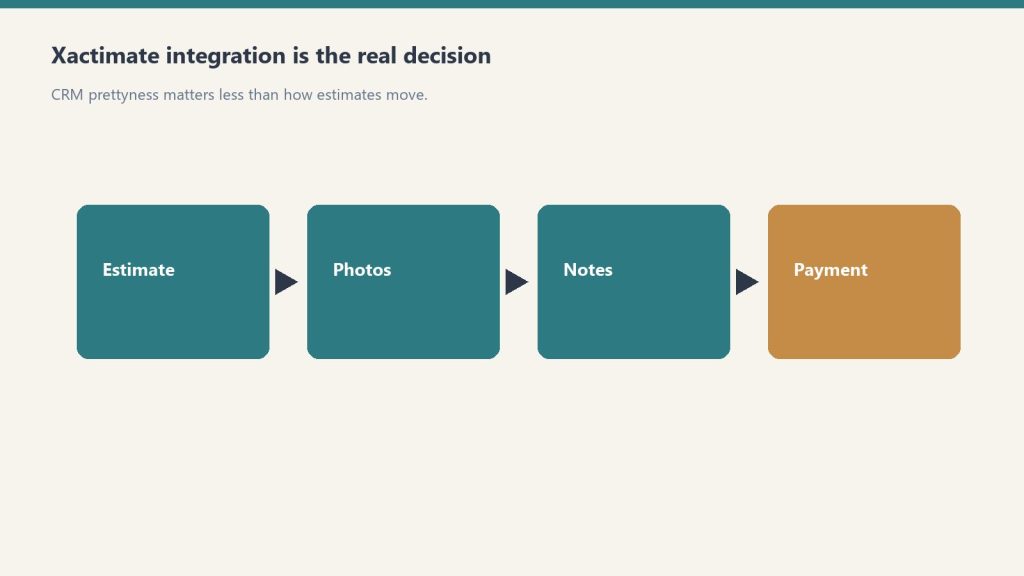
    Xactimate is the estimating standard for the restoration insurance industry. If you do insurance work, your job management software needs to connect to it. The good news: all four major restoration platforms now offer Xactimate integration. The details — which plan tier, how the data flows, and what XactAnalysis access looks like — vary significantly.

    Everything below is sourced directly from vendor websites last verified October 2026. No third-party review sites, no aggregated data — primary sources only.

    Xactimate integration by platform

    Flow from estimate to photos to notes to payment emphasizing integration
    Xactimate integration by platform — the real software decision.
    Platform Xactimate XactAnalysis Plan requirement Notes
    Cotality DASH ✅ Yes ✅ Yes All plans (contact for quote) Native via Cotality/CoreLogic ecosystem; deepest carrier integration
    Xcelerate ✅ Yes ✅ Yes All plans (contact for quote) Verisk integration — automates cost analysis, accesses Verisk cost database
    Albi ✅ Yes ✅ Yes Pro seats only ($100/seat/mo) Not available on Base seats ($60/seat/mo); confirm seat mix before signing
    PSA (Canam Systems) ✅ Yes ✅ Yes All plans (flat team pricing) Also integrates with CoreLogic Symbility

    What Xactimate integration actually does

    A real Xactimate integration means your job management platform can receive estimate data from Xactimate and push completed estimates into XactAnalysis for carrier review — without your estimator manually exporting, reformatting, and uploading files. The workflow looks like: scope is written in Xactimate → estimate pushes to your job management system → job management system submits to XactAnalysis → carrier reviews and approves.

    Without integration, that same process involves manual exports, file conversions, and email threads that cost 30–60 minutes per large job. On a company doing 40 insurance jobs a month, that is 20–40 hours of friction per month that a proper integration eliminates.

    Cotality DASH: deepest carrier integration

    Clipboard and tablet on a kitchen counter during an insurance adjuster walkthrough after water loss
    DASH: deepest carrier integration.

    DASH’s Xactimate integration is the most native of the four platforms because Cotality (formerly CoreLogic) is embedded in the same property data ecosystem that insurance carriers and TPAs operate in. Contractor Connection, Code Blue, and other TPAs that run on CoreLogic infrastructure connect directly. The Compliance Manager in DASH builds carrier-specific documentation requirements into field checklists — so field techs are capturing exactly what each carrier needs, before the adjuster asks for it.

    DASH also integrates with Claims Connect (per cotality.com), which is specifically for streamlining the claims intake and communication workflow between contractors and carriers.

    Xcelerate: full Verisk stack plus the widest integration breadth

    Xcelerate’s Xactimate integration (via Verisk) automates cost analysis and provides access to Verisk’s database of cost data, materials, and labor rates for accurate estimates. Beyond Xactimate, Xcelerate’s verified integration list from xlrestorationsoftware.com includes: Zapier, Encircle, CompanyCam, Matterport, QuickBooks, DocuSketch, Clean Claims, Microsoft 365, Gmail, Google Calendar, RingCentral, Power BI, and TSheets. For shops that need Xactimate plus a wide ecosystem of field tools, Xcelerate’s breadth is a genuine advantage.

    Albi: Xactimate available — on Pro seats only

    Albi added Xactimate and XactAnalysis integration, but it is gated to Pro seats ($100/user/month). Base seats ($60/user/month) do not include it. Per albiware.com/albi-pricing, the full integration list on Pro seats includes: Xactimate, XactAnalysis, iCAT, Kahi, Encircle, CompanyCam, Eagleview, CleanClaims, QuickBooks Online, QuickBooks Desktop, and Sage.

    If you’re evaluating Albi for an insurance-heavy operation, make sure you run your user count through the Pro seat model — enough Pro seats to cover your estimating staff, Base seats for field techs.

    PSA: flat pricing plus Symbility

    PSA (Canam Systems) integrates with Xactimate, XactAnalysis, and CoreLogic Symbility. The Symbility integration is a differentiator — Symbility is used by a segment of carriers who don’t use Xactimate, and having both means PSA can serve contractors who work with multiple carrier systems. PSA’s flat team pricing means Xactimate integration doesn’t get more expensive as your team grows — unlike per-user platforms where adding estimators compounds the cost.

    The bottom line on Xactimate integration

    Side-by-side comparison cards for Albi and DASH water damage workflows
    Bottom line: buy the workflow your estimators live in.

    If you’re choosing a restoration platform primarily based on Xactimate integration quality, the ranking is: DASH for deepest carrier ecosystem connection, Xcelerate for widest overall integration breadth alongside Xactimate, PSA for flat pricing at scale with Symbility coverage, Albi for flexibility — but verify your Pro seat count covers all estimating staff before signing.

    If the software question is settled, the next one is whether your operation is. TPAs don’t just check your Xactimate integration — they audit your documentation discipline, response times, and back-office capacity before you ever see program work. Run the 17-point TPA Readiness Checklist →

    Frequently Asked Questions

    Which restoration software integrates with Xactimate?

    All four major restoration platforms integrate with Xactimate as of June 2026. Cotality DASH integrates natively through the Cotality/CoreLogic ecosystem. Xcelerate integrates with Verisk’s Xactimate and XactAnalysis (per xlrestorationsoftware.com). Albi integrates with Xactimate and XactAnalysis on Pro seats ($100/user/month) per albiware.com/albi-pricing. PSA (Canam Systems) integrates with Xactimate and XactAnalysis per canamsys.com.

    What is XactAnalysis and how does it differ from Xactimate?

    Xactimate is Verisk’s estimating software — it is where restoration contractors build scope of loss estimates using Verisk’s database of cost data, materials, and labor rates. XactAnalysis is Verisk’s claims management platform — it is where insurance carriers and TPAs receive, review, and approve those estimates. Integrating with both means your job management software can push estimates to XactAnalysis for carrier review without manual export/import.

    Does Albi integrate with Xactimate?

    Yes, as of June 2026. Per albiware.com/albi-pricing, Albi Pro seats ($100/user/month) include Xactimate and XactAnalysis integration. This is a Pro-seat-only feature — Base seats ($60/user/month) do not include it. If Xactimate integration is critical to your workflow, confirm you have sufficient Pro seats in your Albi plan.

    Does PSA (Canam Systems) integrate with Xactimate?

    Yes. Per canamsys.com, PSA integrates with Xactimate, XactAnalysis, and CoreLogic Symbility. PSA is a full ERP for restoration with flat team-based pricing, making it cost-effective for larger teams that need Xactimate integration at scale without per-user fees compounding.

    What restoration software has the best Xactimate integration?

    Cotality DASH has the deepest Xactimate integration because DASH sits inside Cotality — the former CoreLogic, rebranded in March 2025 — whose property-data ecosystem is what most carriers already run on. For pure Xactimate workflow — pushing estimates from the field into XactAnalysis for carrier review — DASH’s native connection has the least friction. For shops that want Xactimate integration plus broader non-insurance tool connections, Xcelerate’s full integration list is wide.

    Can I run a restoration company without Xactimate integration?

    Yes, if your work is primarily retail or cash-pay rather than insurance. Albi serves many retail-focused restoration contractors effectively without Xactimate as the core workflow. However, if more than 30% of your revenue flows through insurance carriers or TPAs, Xactimate integration is essentially required — it is the language insurers speak for scope of loss.


  • Cotality DASH vs Xcelerate: Honest 2026 Head-t (2026)

    Cotality DASH vs Xcelerate: Honest 2026 Head-t (2026)

    Two of the four serious restoration platforms in 2026 — Cotality DASH and Xcelerate — serve fundamentally different operators. DASH was built inside the insurance ecosystem. Xcelerate was built by someone who ran restoration operations and wanted the software to make his crews better by default. This is the comparison for owners who’ve narrowed it down to these two.

    All data below is sourced directly from cotality.com and xlrestorationsoftware.com as of June 2026.

    Side-by-side comparison

    Side-by-side comparison cards for Albi and DASH water damage workflows
    Side-by-side: pick by assignment depth vs lean stack.
    FactorCotality DASHXcelerate
    Built forInsurance-heavy, TPA-reliant operatorsProcess-discipline operators, multi-location, franchises
    Parent companyCotality (formerly CoreLogic, publicly traded)Independent
    Xactimate integrationYes (native via Cotality ecosystem)Yes (Verisk’s Xactimate & XactAnalysis)
    Mobile appiOS + Android, true offline modeiOS + Android, real-time field-to-office sync
    SecurityAICPA SOC 2 Type II certifiedSOC 2 Type 2 certified (independently audited)
    QuickBooksOnline + DesktopYes
    MatterportYesYes
    DocuSketchYesYes
    EncircleYes (via Cotality ecosystem)Yes
    CompanyCamNot listed on vendor siteYes
    RingCentralNot listed on vendor siteYes
    Microsoft 365Not listed on vendor siteYes (Office 365)
    Power BINot listed on vendor siteYes
    PricingContact for quote: (866) 774-3282Contact for quote: (423) 405-6417
    CustomizationModerate — workflow follows DASH architectureLow by design — best practices are the default
    CAT/offline workStrong — true offline mobile syncStrong — real-time field-to-office sync

    Where DASH wins

    Clipboard and tablet on a kitchen counter during an insurance adjuster walkthrough after water loss
    Where DASH wins: carrier assignments and adjuster flow.

    If TPA volume is above 30% of your revenue, DASH wins this comparison and it isn’t close. The Cotality ecosystem connects to Contractor Connection, Code Blue, and other TPA networks that live inside the CoreLogic/Cotality data world. Job files auto-populate with Cotality property data using AI — verified address details, property history, and risk data are loaded before your first site visit. The Compliance Manager builds carrier-specific checklists directly into field workflows, which means a tech in the field is guided through the exact documentation a specific carrier needs before the adjuster ever reviews it.

    DASH’s true offline mobile mode is also a genuine advantage in CAT work. If you’re running crews in a disaster zone without reliable cellular, DASH saves documentation locally and syncs when service returns. That is not a minor feature when your crew is documenting a $200,000 job in a basement with no signal.

    Where Xcelerate wins

    Gloved hands using a pin-type moisture meter on wet drywall during inspection
    Where Xcelerate wins: Verisk-native lean shops.

    If you want the software to make your team better operators, Xcelerate is the choice. The platform was designed by someone who spent years running restoration operations and wanted to solve the consistency problem — the reason two crews from the same company can produce dramatically different results on similar jobs. Xcelerate’s answer is SOP-driven checklists and stage gates that make best practices the path of least resistance.

    Xcelerate’s integration depth is also notably wider than DASH on non-insurance tools. The full verified integration list (per xlrestorationsoftware.com) includes: Zapier, Encircle, CompanyCam, Matterport, QuickBooks, DocuSketch, Clean Claims, Microsoft 365, Gmail and Google Calendar, RingCentral, Xactimate/XactAnalysis, Power BI, and TSheets. The built-in CRM includes referral tracking, sales leaderboards, and route planning — tools that DASH doesn’t surface as prominently.

    The growth marketing angle is also more developed: Xcelerate offers lead-gen websites, Google Business Profile listings, city-specific landing pages, and a digital marketing platform as part of its product suite. If you’re building a retail book rather than living off TPA volume, this matters.

    Where neither wins

    Neither DASH nor Xcelerate publishes pricing. Both require a demo call to get a number. If you need to make a quick cost comparison, that’s a friction point — you’ll need to run both through their sales process before you can run the numbers. For price-sensitive operators above 15 users, PSA (Canam Systems) with flat team pricing deserves a spot in the demo cycle before you commit.

    The decision

    Pick DASH if your revenue is insurance-led, you work with TPAs inside the Cotality ecosystem, or you run CAT work where offline mobile sync matters. Pick Xcelerate if you are retail-heavy, want process discipline baked into the default workflow, need broader non-insurance integrations, or are building a multi-location operation where consistency across branches is the problem to solve.

    Frequently Asked Questions

    What is the main difference between Cotality DASH and Xcelerate?

    DASH (by Cotality) is built around the insurance restoration ecosystem — it connects natively to Xactimate, XactAnalysis, and the broader Cotality/CoreLogic data platform. Xcelerate was built by a former restoration general manager and focuses on operational discipline: profitability tracking, SOP-driven checklists, and stage-gate workflows baked into the default experience. DASH bends to the insurance world; Xcelerate bends to process rigor.

    Which is better for insurance restoration work — DASH or Xcelerate?

    DASH wins for insurance-heavy operators. Its native connections to Xactimate, XactAnalysis, Claims Connect, and the Cotality property data platform mean TPA jobs flow through with minimal friction. Xcelerate also integrates with Xactimate and XactAnalysis (per xlrestorationsoftware.com/xcelerate-integration-partners), but the Cotality ecosystem depth gives DASH a structural advantage for carriers and TPAs.

    Does Xcelerate integrate with Xactimate?

    Yes. Per xlrestorationsoftware.com/xcelerate-integration-partners, Xcelerate integrates with Verisk’s Xactimate and XactAnalysis, automating cost analysis and giving access to Verisk’s database of cost data, materials, and labor rates for accurate estimates.

    What integrations does Cotality DASH have?

    Per cotality.com as of June 2026, DASH integrates with QuickBooks Online, QuickBooks Desktop, Sage 100, Sage 300, Claims Connect, Matterport, DocuSketch, Cotality CRM, and Cotality Mitigate. It also connects to Xactimate and XactAnalysis through the Cotality ecosystem.

    Is Xcelerate or DASH better for multi-location restoration companies?

    Xcelerate explicitly markets to multi-location and franchise operators, with SOP-driven checklists and standardized workflows designed to ensure consistent outcomes across branches. DASH also supports multi-location operations through centralized job management and compliance workflows. Xcelerate’s edge is in making operational consistency the default rather than something you have to configure.

    Which restoration software has better mobile capabilities — DASH or Xcelerate?

    Both offer strong mobile apps. DASH’s mobile app (iOS and Android) features true offline mode — data saves locally and syncs when connectivity is restored, which is critical in disaster zones. Xcelerate’s field-to-office sync ensures crew updates and photos are visible to the office in real time. DASH’s offline functionality is a genuine differentiator for CAT work.

    How do DASH and Xcelerate compare on security?

    Both platforms meet SOC 2 Type 2 / Type II standards. Cotality DASH is AICPA SOC 2 Type II certified (per cotality.com). Xcelerate meets SOC 2 Type 2 standards with independent audit (per xlrestorationsoftware.com). Both are enterprise-grade on data security.

  • 2025 RIA TPA Scorecard: Best & Worst Restoration Programs

    2025 RIA TPA Scorecard: Best & Worst Restoration Programs

    Updated October 2026: The 2025 edition (released April 2025) is the latest RIA TPA Scorecard — no 2026 edition has been published. Since the survey, Alacrity’s managed repair division became an independent company, Altimeter Solutions Group (January 2026, backed by BV Investment Partners), and Worley acquired Alacrity Renovation Services from Lowe’s. Scores below reflect the 2025 survey as published.

    If you work insurance program work, this is the one report you should actually read. Every year, the Restoration Industry Association’s Advocacy and Governmental Affairs committee surveys contractors who have worked with TPAs in the past 12 months. No vendor marketing. No TPA spin. Just anonymous contractor ratings across 8 categories that actually matter: value, claims process, contractor support, scoring clarity, guidelines, credentialing, claim volume, and geographic coverage.

    The 2025 results are in. 379 contractors rated 13 TPAs. The industry average sits at 2.7 out of 5 — a 54% satisfaction rate. That’s not a ringing endorsement of the TPA model, but it tells you something more useful: the spread between programs is significant, and knowing who’s at the top and who’s at the bottom changes your program strategy.

    Here’s the breakdown, with the data that matters.

    The Leaderboard: Who Contractors Actually Trust

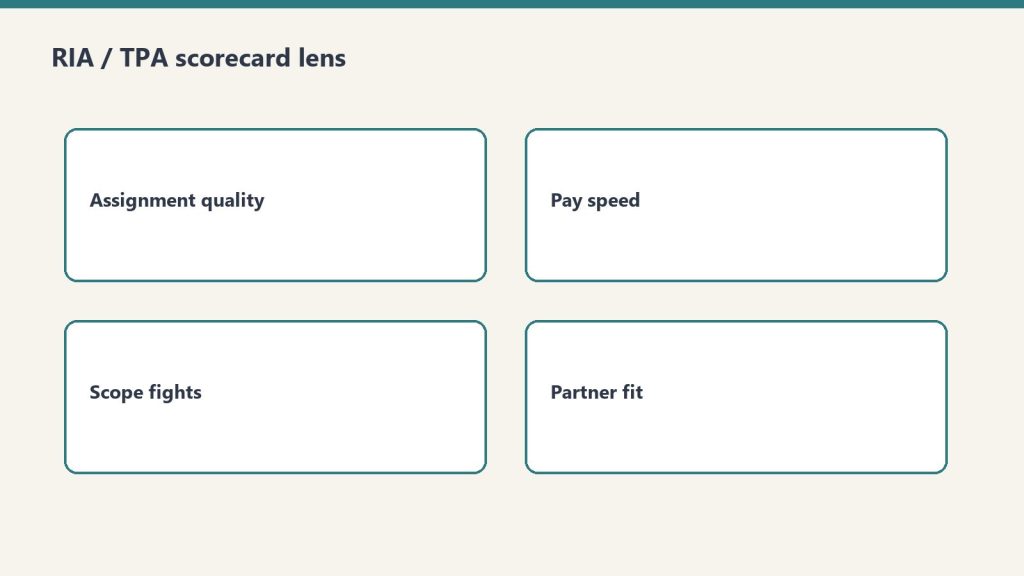
    Four cards: assignment quality, pay speed, scope fights, partner fit
    Score TPAs on what contractors feel — not the brochure.

    ONCORE Claims Network: 3.1 stars — #1 for the third consecutive year. This is the benchmark. ONCORE (formerly CORE) outperforms everyone across nearly every category: 3.4 on credentialing (the highest of any TPA), 3.3 on guidelines, 3.2 on value, and 3.0 on contractor support — the only TPA to crack 3.0 in that category. Claim volume is their soft spot at 2.7, which contractors consistently flag: the program is good, but there aren’t enough jobs to go around. If you can get in and get volume, this is the cleanest program to run.

    Lionsbridge: 3.0 stars. Tied with Sedgwick for second and rising. Lionsbridge improved 3% since 2022 and scores well on guidelines (3.1) and claims process (3.1). It operates as a CCA Global Partners cooperative — meaning members get access to significant group buying power on equipment, credit card processing, and supplies in addition to leads. The program is selective and built for established contractors. Their claim volume score of 2.4 is the weak link, but the jobs they do send tend to be cleaner to close.

    Sedgwick: 3.0 stars. The highest geographic coverage of any TPA at 3.2, tied with Alacrity and Contractor Connection. Sedgwick is a large TPA that manages claims for major commercial carriers. Their value score improved from 2022 and holds at 3.2. Contractor support fell slightly to 2.8, which is still above average. Sedgwick’s biggest contractor complaint: they want better advocacy with carriers when scope disputes arise (34% of contractors flagged this as their top improvement priority).

    The Middle of the Pack

    Westhill Global: 2.9 stars (+27% from 2022). The biggest mover in the 2025 report. Westhill climbed from 2.3 to 2.9, the largest percentage gain of any TPA. They earned the highest credentialing score in that category at 3.2, and their value rating jumped from 2.0 to 3.0. What drove it? Contractors report that Westhill made meaningful process improvements and the program became easier to actually manage. Watch this one — if the trajectory continues, they’ll be in the top tier in 2027.

    Preferred Repair Network (PRN) / Hancock Group: 2.9 stars (down from 3.5 in 2022). The biggest drop in the report. PRN was the top-rated TPA in 2022. Two years later they’ve fallen 17% across all categories — contractor support cratered from 3.5 to 2.7. The program score fell sharply (from 3.5 to 3.0), guidelines dropped, and claim volume expectations are down 23%. Contractors aren’t abandoning the program — the claim volume and geographic scores are still reasonable — but something changed in how the program is managed. If you’re heavily weighted in PRN, the trend line warrants attention.

    Direct Claims Management Group (DCMG): 2.8 stars (+12% from 2022). DCMG improved across the board and earned the highest scoring clarity rating (3.1) and tied for the top value rating. Their communication scores are better than average, and they’re rated best-in-class for not requiring contractors to take estimate-only projects. Smaller program footprint, but if you’re in their coverage area, worth evaluating.

    Alacrity Solutions/Alacrity Nexxus: 2.7 stars (down 4%). The largest program by claim volume alongside Contractor Connection — and that volume score (2.7) is their strongest asset. Contractors use Alacrity for the jobs, not the relationship. The program scored 2.3 on contractor support, the second lowest of any TPA. Key contractor complaints: 38% want better advocacy with carriers, 34% want overhead and profit addressed, 33% want more flexibility in guidelines. Alacrity knows this and has invested in contractor relations improvements (rebranding from the original Altimeter structure), but the needle hasn’t moved enough to show in the scores yet.

    The Programs That Are Losing Contractor Confidence

    Clipboard and tablet on a kitchen counter during an insurance adjuster walkthrough after water loss
    Programs losing confidence usually lose it in the scope fight.

    Brightserv: 2.6 stars (flat). No change from 2022. Contractors score timely payment as a weak point (29% flag it), and contractor support (2.3) needs work. The program hasn’t gotten worse, but in a field where others are improving, flat is a problem.

    HOMEE: 2.6 stars (new to 2025 survey). Debuted slightly below average with a concerning claim volume score of 1.8 — the lowest of any TPA. Contractor support is at 2.6, and 46% of contractors rate “improve partnership with TPA” as their top request. As a tech-forward TPA operating in the gig-economy model, HOMEE is a different kind of program — useful for certain contractors but not a primary revenue source for established restoration companies.

    Contractor Connection (Crawford): 2.6 stars. The most widely used TPA in the restoration industry — 289 contractor responses, the largest sample in the survey. Geographic coverage ties for highest (3.2), claim volume ties for highest (2.7), and they’re among the best for timely payment (only 8% of contractors flag slow payment, one of the lowest rates). The problem is everything else. Contractor support sits at 2.2 — second lowest. Contractor advocacy with carriers is the top complaint at 42%. Guidelines flexibility is flagged by 39% of contractors. They send the most work. They’re also the most frustrating to work with. The calculation you have to make: is the volume worth the margin compression and administrative friction?

    Accuserve (formerly CodeBlue): 2.1 stars — last place. The lowest-rated TPA in the 2025 report, and it’s not close. Accuserve scores below 2.0 on value (1.9), scoring clarity (1.9), claims process (1.9), and contractor support (1.9). The only category where they score above 2.5 is credentialing (2.6). Fifty percent of contractors working with Accuserve say providing pricing consistent with market value is their top requested improvement — double the industry average. This program has structural problems that go beyond management tweaks.

    What the Numbers Actually Tell You

    The overall industry average of 2.7 out of 5 means most contractors are running TPA work that’s tolerated, not preferred. The five most important things contractors want from TPAs — in order of importance they rated themselves: claims process efficiency (4.4/5 importance), contractor support/advocacy (4.2), claim volume (4.2), value/ROI (4.2), and guidelines flexibility (4.1). On every single one of those, TPAs are delivering somewhere between 2.3 and 2.9. There’s a consistent gap between what contractors need and what they’re getting.

    The other number worth noting: 53% of restoration firms now report zero TPA revenue, up from 45% the prior year. That’s not a blip — it’s a structural shift. Contractors who built their own lead channels through Google LSA, direct plumber and agent referrals, and organic SEO are generating work at better margins without the administrative overhead. The TPA model still works, but fewer operators are treating it as their primary revenue strategy.

    How to Build Your TPA Program Intelligently

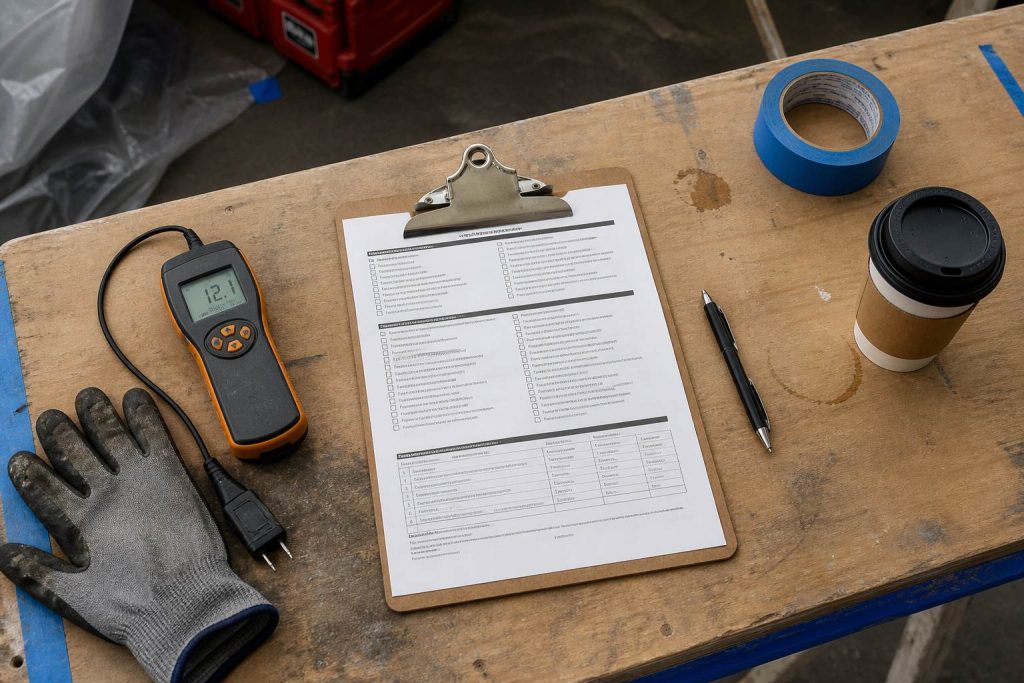
    Restoration SOP clipboard with checklist, moisture meter, and gloves on a jobsite table
    Build your TPA mix like a checklist — not a hope.

    The operators who do TPA work profitably aren’t in every program — they’re in two or three that fit their capacity, their geographic footprint, and their operational model. Here’s the framework:

    Use the RIA scorecard as a filter, not a verdict. A 3.1 from ONCORE doesn’t mean the program works in your market — claim volume (2.7) is the constraint. A 2.6 from Contractor Connection doesn’t mean you walk away from the largest volume source in the country. But it does mean you know where the friction is going to come from before you budget for it.

    Cap TPA revenue at 40-50% of total revenue. The moment more than half your revenue runs through a program, the TPA controls your business. They can change pricing, add administrative requirements, or reduce your zip code coverage — and you have no leverage. Keep direct work as your floor, TPA work as your upside.

    Track margin per TPA, not aggregate TPA margin. The programs that send the most work aren’t always the ones generating the most gross profit. A company doing $800K in Contractor Connection work at 28% gross margin is generating less than a company doing $300K in ONCORE work at 44% gross margin. Build a simple spreadsheet that tracks average gross margin per job by program. You’ll know within 90 days which programs deserve more of your capacity.

    Document your TPA scorecard complaints. The RIA survey directly affects how TPA programs are managed — TPA executives receive this data and respond to it. If you’re running program work and experiencing consistent friction with a specific TPA, log it and participate in the next RIA survey. That’s not altruism. That’s how contractors collectively move the needle on program terms.

    TPA Readiness Checklist

    TPAs don’t just score your work — they audit your back office before you ever get a job. Check every box that’s true for your company. Be honest; the TPA’s credentialing team will be.

    Your readiness score 0 of 17

    Check the boxes to see where you stand.

    Self-assessment, not a guarantee — every TPA publishes its own credentialing requirements. Use this to find your gaps before their auditor does.

    The Bottom Line

    If you’re choosing between TPA programs in 2025, the data is clear: ONCORE leads, Lionsbridge and Sedgwick are solid programs for contractors who qualify, and Westhill Global is the most improved. Contractor Connection sends the most work but has the worst contractor support score. Accuserve has structural problems that pricing alone won’t fix.

    Don’t build your business on programs. Build your business on direct marketing, strong referral relationships, and operational capability — then let TPA work be the fill you take when capacity allows. The contractors who get that order right keep their margins. The ones who get it backwards spend their careers negotiating scope with adjusters they’ll never win against.

    Source: RIA 2025 TPA Scorecard Report, Restoration Industry Association Advocacy and Government Affairs Committee. Survey conducted anonymously among 379 restoration contractors.

    THE RESIDENTIAL-TO-COMMERCIAL BRIDGE · PART 2 OF 3

    Compliance: prove your back office can handle program work

    Certifications get you in the door; TPA-grade documentation keeps you there. Xactimate fluency, S500/S520-standard documentation, and audit-ready admin are the price of commercial program revenue. Final step: aim your marketing where commercial clients actually are.

    ← Part 1: Training — the certification roadmap

    Part 3: Marketing — from residential clicks to commercial networking →

    Related on Tygart Media: RCP guide · contractor ESG clauses · FM ESG frameworks.

  • Restoration Company Valuation: 2026 Multiples & PE Buyers

    Restoration Company Valuation: 2026 Multiples & PE Buyers

    If you own a restoration company today, you are sitting on the most attractive asset class in the home services sector — and the buyers know it. Private equity has deployed more than $6 billion across 50+ restoration platforms since 2018, and the consolidation wave that started with brands like ServiceMaster and BELFOR is now grinding through the middle market. Regional operators doing $5M to $25M in revenue are getting unsolicited LOIs every quarter. Most owners have no idea what their business is actually worth, what they could be doing right now to add a turn or two to their multiple, or which buyer in the market is the right exit for their specific situation.

    This is the bottom-line guide. No fluff. What buyers pay, what they discount for, and what to fix before the call.

    What restoration companies are actually selling for in 2026

    Valuation in restoration is driven by size, revenue mix, and operating quality — in roughly that order. The brackets break down like this:

    • Owner-operator shops ($500K–$2M revenue, $150K–$400K SDE): 2.3x–3.5x SDE. These are individual-buyer or local-strategic deals. The owner is the business; the buyer is essentially buying a job with a customer list.
    • Established multi-tech operations ($2M–$10M revenue, $400K–$1.5M EBITDA): 3.5x–5.5x EBITDA. This is where most PE add-on activity happens. Buyer expects you to be transferable.
    • Multi-location regional platforms ($10M–$50M revenue, $1.5M–$5M EBITDA): 5.5x–8.0x EBITDA. Now you are platform-grade. TPA program participation, named carrier relationships, and 24/7 infrastructure matter heavily here.
    • Premium platforms ($12M+ EBITDA, multi-state, modern operating system): 7x–11x+ EBITDA. This is the HighGround-to-Knox-Lane tier. Rare air, but it exists.

    To translate: a $1M SDE owner-operator is looking at roughly $2.8M–$3M at sale. A $3M EBITDA regional with a clean TPA book and a working second-in-command is looking at $18M–$24M. The gap between those two numbers is mostly operational discipline, not revenue.

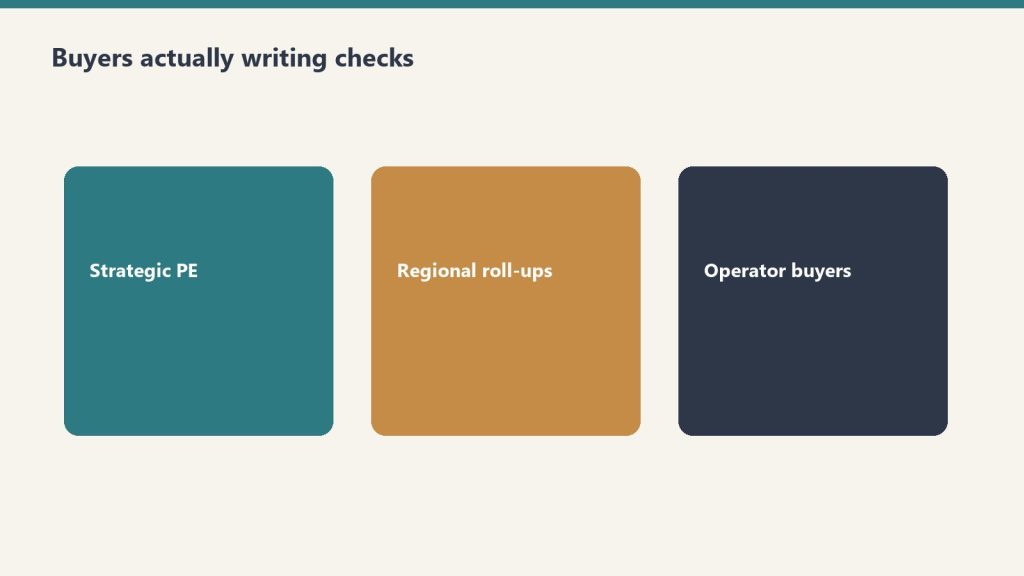
    The buyers actually writing checks right now

    Three buyer types: strategic PE, regional roll-ups, operator buyers
    Know who is writing checks before you polish the teaser.

    The named platforms most active in restoration add-ons through 2025 and into 2026 include:

    • Morgan Stanley Capital Partners (American Restoration): An 8-brand roll-up across 10 states, headquartered in Dallas. Acquired by MSCP after building out residential and commercial mitigation in regional markets. Looking for tuck-ins that fit the regional brand model.
    • Knox Lane (HighGround): 13 acquisitions in 5 years before exit. Aggressive on multiples for the right strategic geography.
    • LP First Capital / Align Collaborate (Rewind Restoration): Newer platform, launched with the Icon Restoration acquisition in Rochester Hills, Michigan. Stated goal of building one of the largest residential restoration businesses in the US — meaning they are at the early, hungry stage of a platform.
    • Osceola Capital (Fortify Restoration): Platform launched mid-2025. First add-on was Beach Contracting in South Florida. Focused on structural restoration and southeast geography.
    • Crossplane Capital (Mooring USA): Dallas-based PE shop that took Mooring private. Commercial-leaning thesis.

    None of these buyers want a vendor brochure. They want clean books, low owner dependence, and a story about how revenue keeps coming after closing.

    What buyers actually grade you on

    Six cards: repeatable jobs, clean books, bench depth, channel mix, owner optional, risk controls
    Buyers grade transferability — same scorecard as valuations.

    Pretend you are sitting in the LOI meeting. The questions on the buyer’s checklist, in order of how much they move the multiple:

    1. Revenue mix. Buyers want recurring service contracts, TPA program participation, and managed-repair work. They penalize reconstruction-heavy mix (lower gross margins) and they penalize catastrophe-heavy revenue. The savvy ones expect CAT work to represent no more than 15–20% of total revenue — anything north of that gets discounted as unpredictable.
    2. TPA and carrier relationships. A documented Contractor Connection, Alacrity, Code Blue, or PSA program book — with active job volume and clean compliance history — is worth real multiple turns. A regional platform with $4M–$12M EBITDA and a strong TPA book is the difference between a 6x deal and an 8x deal.
    3. Owner dependence. If you sign every estimate, talk to every adjuster, and make every hiring call, your business is not transferable. Most buyers want a turnkey, profitable operation, and creating SOPs that remove yourself from the daily grind is the single highest-ROI thing you can do in the 18 months before a sale.
    4. Financial cleanliness. Multiples above the median require demonstrably above-median EBITDA margin and clean financial documentation that survives a third-party Quality of Earnings review. If your bookkeeper is your spouse and your books are on QuickBooks with no monthly close, you will get repriced in due diligence.
    5. Management depth. A strong GM, an operations lead, and a finance person who isn’t you. Buyers will request to meet key employees during due diligence and may want to adjust transition terms based on who is staying.

    The things that quietly destroy your multiple

    Red list of deal killers including owner dependency and messy AR
    Quiet destroyers of multiple look a lot like deal killers.

    Sellers walk into deals not knowing these compress them by 1–2 turns:

    • Reconstruction-heavy revenue mix with low gross margin.
    • No TPA program participation — meaning revenue is fully dependent on local marketing and referrals.
    • Weak 24/7 response infrastructure (no real on-call rotation, no after-hours dispatch).
    • Paper-based or hybrid workflow with no modern job management system.
    • Single-territory exposure with no expansion playbook.
    • Lapsed or thin IICRC certifications across the technician base.
    • Concentration risk — one TPA or one big carrier representing more than 25% of revenue.

    The timeline that wrecks sellers

    Due diligence typically runs 30 to 90 days and is the most intensive phase of any restoration sale. Owners who go into LOI without having done their own internal QoE, their own SOP documentation, and their own legal cleanup almost always get retraded. Sometimes the retrade is mild — $200K off the headline number. Sometimes the buyer walks. The sellers who hold their price are the ones who showed up ready: trailing twelve-month EBITDA reconciled monthly, contracts organized, employee agreements in place, tax returns matching financials, and a clean cap table.

    Most restoration deals take six to twelve months from first conversation to close. If you are thinking about an exit in 2027, the time to start is now.

    The honest bottom line

    If you are under $2M in revenue, an owner-operator, and reconstruction-heavy: your real exit number is probably $400K–$800K, not the $2M figure you’ve been telling yourself. Sell to a local strategic, take three years of earn-out, and get to your number that way.

    If you are $3M–$10M with a working TPA book and a real management bench: you are exactly what every active PE platform is shopping for. Get a Quality of Earnings done now, fix the obvious holes, and start taking the calls. There are a dozen named buyers with active mandates, and the market for quality regional restoration assets is the strongest it has ever been.

    If you are $12M+ EBITDA with multi-state coverage and a modern operating system: you are not selling a business, you are negotiating a platform price. Hire a sell-side advisor who has actually closed restoration deals — not a generalist broker. The difference between a competitive process and a one-buyer conversation is two turns of EBITDA, which on your numbers is real money.

    The window for premium restoration exits is open. It will not stay open forever. Climate-driven loss frequency is up roughly 35% since the 1990s, which is fueling buyer enthusiasm — but interest rates and PE fundraising cycles will eventually cool the market. Sellers who prepare now will catch this wave. Sellers who wait for “the right time” will sell into a softer market.

    The right time is when your business is ready, not when the market is hot. The good news is the market is hot and the operational work to be ready is straightforward. Get started.

    Related on Tygart Media: Starlink on a water job · S500 in the van · local SEO for restoration.