
The Profit Detective Playbook
$497
Delivered by email after checkout.
Secure checkout via Square — all major cards accepted
You can copy this method and do it yourself. Pull your own P&L. Score the five leak zones. Cost ten jobs. Age the AR. Run a 90-day reset on one leak. Buy Now is the packaged course: seven modules, the linked tools, and the exercises so you are not assembling the curriculum from scratch.
This is the self-paced DIY version of the Profit Detective Diagnostic. Restoration owners doing $1M-$15M who suspect they are leaving money on the table and want a repeatable way to find it before hiring a consultant.
How it works
Seven modules. Each one teaches a leak zone, then hands you a tool to do the detective work on your own business. Work one module a week or binge it. Do the exercises. That is where the money is.
- The Profit Detective Method (plus the Restoration Profitability Pyramid)
- Estimating & Scope Leaks
- Job Costing & Margin Leaks
- Cash Flow & Collections Leaks
- Sales & Conversion Leaks
- Leadership & Overhead Leaks
- The 90-Day Restoration Reset
Think like a detective, not an optimist
Most owners run on opinion. “We’re busy, so we must be profitable.” A detective wants evidence. The method’s three habits:
- Evidence over opinion. Pull the number before you defend the story.
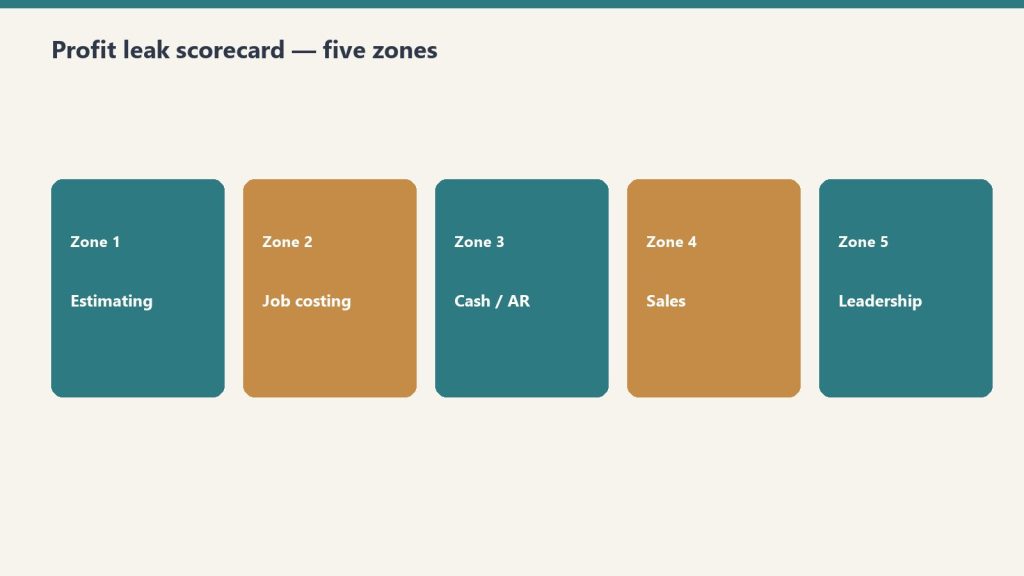
- Follow the money. A dollar of revenue passes through five checkpoints before it becomes profit. Find which checkpoint it is escaping at.
- Assume a leak exists. You are not asking if. You are asking where and how big.
The playbook’s teaching: in 150+ restoration companies, every one was leaking somewhere between 5% and 15% of revenue. Not because the owners were lazy. Because nobody was looking. A $4M shop leaking a conservative 8% is $320,000 a year. That is the method’s example math, not a promise about your shop.
The Restoration Profitability Pyramid
Four stacked layers. Revenue at the bottom. Gross margin above it. Net profit above that. At the top: owner freedom (cash, time, the ability to walk away from the truck).
Most owners spend 90% of their energy on the bottom layer. More leads, more trucks, more revenue. The rule: climb the pyramid from the middle, not the bottom. A 3-point improvement in gross margin on $4M is $120,000, and it costs nothing in new marketing. Growing revenue 3 points to get the same dollars means more jobs, more risk, more chaos. Ask: can I make this dollar worth more before I chase another one?
What “normal” looks like (starting case file)
Pull two documents: trailing-12 P&L, and a job-costing report for your last 20-30 completed jobs (revenue, labor, materials, subs, equipment). If your software cannot produce job-level margin, that is your first finding.
- Gross margin: healthy mitigation 45-55%; blended with reconstruction 35-45%. Below 35% blended is a margin leak.
- Net profit: a well-run shop nets 10-20%. Single digits means the leak is real and findable.
- Overhead: if fixed overhead is eating more than 25-30% of revenue, Zone 5 is calling.
- AR over 90 days: more than 15-20% of receivables past 90 is a Zone 3 bleed.
Circle anything outside those ranges. That is spotting where the evidence disagrees with the story.
The five zones, and how to work each one
1. Estimating & scope
Money left in the estimate. If it is not documented, you ate it. The line items that vanish most often: detach & reset, PPE, monitoring / daily site visits, containment, equipment days, after-hours / emergency service, content manipulation.
The discipline: review every job’s final cost against the original estimate, tagged by estimator and job type. Filter jobs where the biggest leak is Scope/Estimate. Find the repeating miss, not the outlier. Coach that one habit.
What good looks like: final cost within about ±5% of estimate on most jobs, because the scope was right the first time. A weekly variance review, by estimator.
2. Job costing & margin
Four cost buckets: labor, equipment, materials, subs. Labor is the #1 leak (hours over estimate, unbilled drive and idle time, milked T&M). Equipment sits on closed jobs, unbilled. Materials slip. Subs compress margin when the invoice exceeds what you billed the carrier.
Run a mid-job margin check at the halfway point of every significant job. Close-out cost every job within 3-5 days of the final visit, not at month-end. Log last 10 closed jobs with all four buckets. Sort by true gross margin. Name the money-losers. Flag every job where actual labor beat estimate by more than 10%. Write one sentence on the worst one: what leaked, and in which bucket.
3. Cash flow & collections
You are the customer’s bank. DSO = (Accounts Receivable ÷ Total Credit Revenue) × Number of Days. Age the buckets: 0-30 leave it; 31-60 watch; 61-90 a human on the phone this week; 90+ is a write-off countdown.
Collections cadence with a name and a day: Day 0 confirm receipt; Day 14 friendly status; Day 30 escalate by phone; Day 45 owner or controller in writing; Day 60 formal demand path. One person owns the list. Same standing time every week. Track submitted supplements to collection, not just to submission.
4. Sales & conversion
For the last 90 days, log qualified leads and jobs sold. Divide. That is your conversion rate. A rough number beats a shrug.
Four leaks: missed business-hours calls; no source attribution on paying jobs; quotes that get zero follow-up; slow speed-to-lead on emergency work. The playbook’s rule: every estimate gets a touch within 24 hours, then day 4, then day 8. Three touches before it is dead. Answer live, or call back within 10 minutes during business hours. Track quote status: Sent / Followed-Up / Won / Lost.
5. Leadership & overhead
If you disappeared for 30 days and the business grinds to a halt, you own a job, not an asset. Tag a typical week: $15/hour work vs $1,000/hour work. Audit subscriptions, idle trucks, and roles that were created for a person, not a need.
The highest-leverage move in this zone: build one middle manager who can own the daily run. Run an owner-dependency audit. Pick the top 3 bottlenecks. Hand each one through a 1-3-1 (one issue, three options, one recommendation). Drain overhead while you are in there.
The 90-Day Restoration Reset
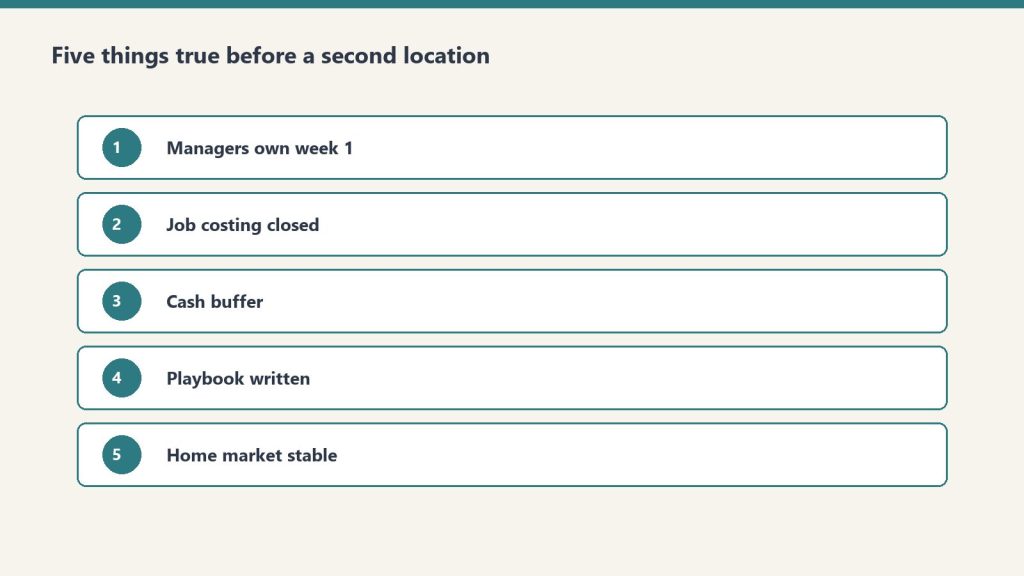
You will find leaks in all five zones. You do not have five projects. Rank by dollars at stake. One zone per quarter.
- Weeks 1-2: Measure & pick. Put a real dollar figure on the top leak. Write today’s baseline.
- Weeks 3-4: Install the fix. The specific playbook from that zone. New estimate checklist, job-costing review, weekly AR block, or lead-follow-up rule with a name on it.
- Weeks 5-8: Make it an SOP. One page. Hand it to the person who owns it. Watch it run for a month without you.
- Weeks 9-12: Review & lock. Re-pull the same number. Fold the metric into the dashboard. Only then turn to the next zone.
Once a month, 30 minutes, same five numbers: gross margin %, net %, AR over 90, conversion %, overhead % of revenue. Same day each month. When a number drifts, you catch it in weeks.
The playbook’s compounding example: a 3-point margin gain on a $3M shop is $90,000, at zero new marketing. Recovered margin funds the next fix.
What you should be able to say out loud
- “My gross margin is ___ %.” An actual number.
- “My worst leak zone is ___.” Named from the Scorecard, not a hunch.
- “I’m fixing one zone at a time.”
- A written 90-day plan with a measured baseline and a lock-in date.
- A monthly diagnostic already on the calendar.
If you want the packaged course
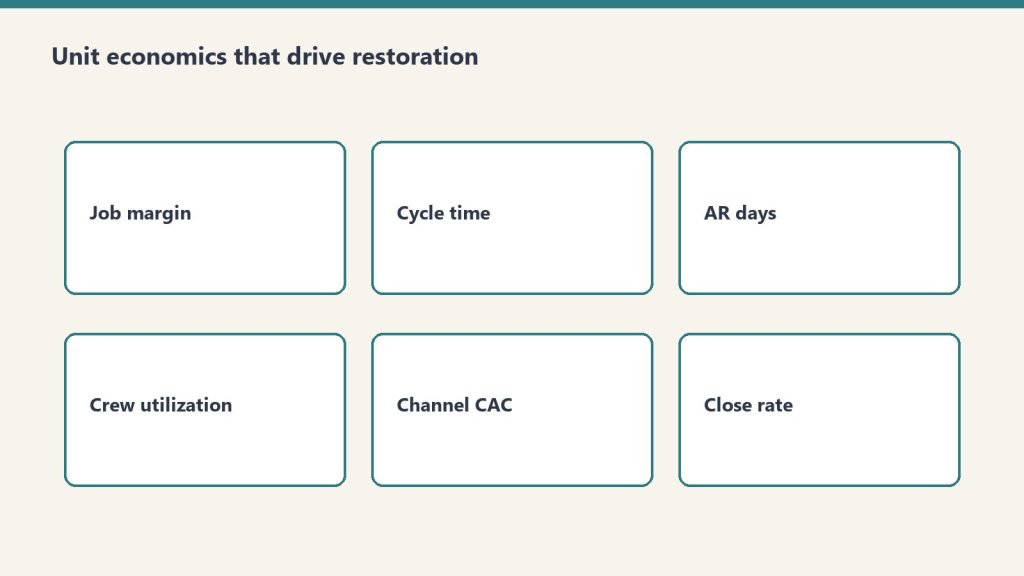
You can run the method from the outline above. Buy Now is the playbook delivered by email after checkout: the seven modules, the linked tools (Scorecard, Gap-Finder, KPI Dashboard, Claims Command Center, Leadership tools), and the detective-work exercises. Same Square button at the top of this page.
This is an operational course. Not legal, insurance, or licensing advice. The dollar examples in the modules are teaching math, not a guarantee.
Frequently Asked Questions
Is there a refund policy?
Because this is a digital product, all sales are final. If you have a problem with your purchase, email will@tygartmedia.com and we will sort it out.
How is this delivered?
Within 24 hours of purchase via email from will@tygartmedia.com. You will receive your download link — Notion duplicate link, skill file, or both depending on the product.
Related on Tygart Media: profit leak scorecard · job-costing gap-finder · owner freedom kit.
Leave a Reply