Tag: Risk Management

  • Restoration Labor Burden: The True Cost Destroying Margins

    Restoration Labor Burden: The True Cost Destroying Margins

    What is labor burden in restoration? Labor burden is the total employer cost of an employee beyond base wages — including payroll taxes, workers’ compensation premium, benefits, paid time off, training, and non-billable time. In restoration, a fully burdened labor rate is typically 35 to 55 percent above base wage, with workers’ compensation alone often adding 8 to 15 percent depending on state and classification.


    Most restoration owners can quote their crew’s hourly wage. Far fewer can quote the actual cost of an hour of crew labor with full burden loaded. The gap between those two numbers is where a large chunk of restoration margin quietly disappears.

    This is the number that does not show up until you go looking for it. And when you go looking — pulling every cost element the company actually pays on top of base wage — the picture is consistently ten to twenty percent more expensive than most owners expect.

    What Makes Up Labor Burden
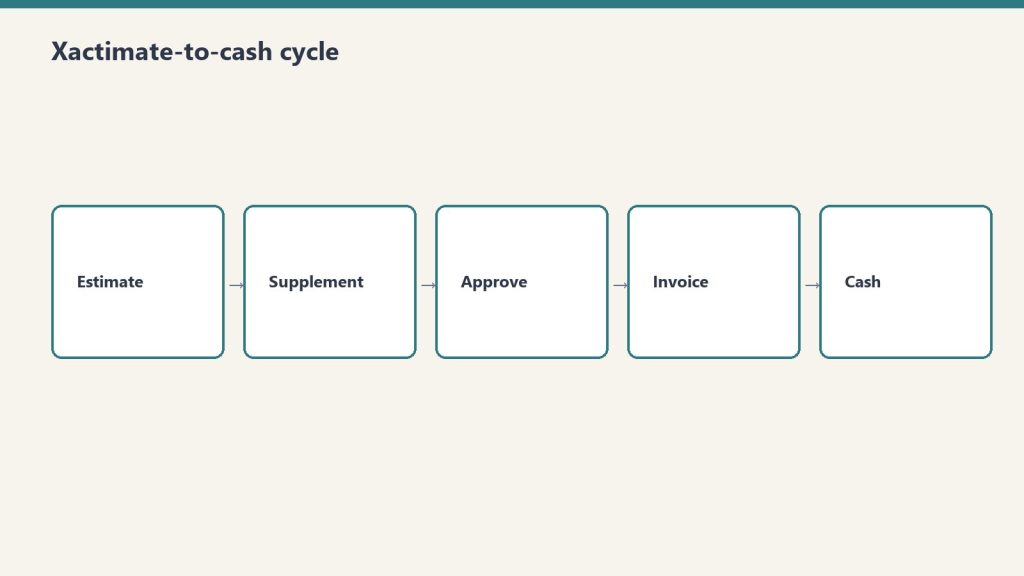
    Five-step flow from estimate to supplement, approve, invoice, cash
    What makes up labor burden.

    Base wage is one line item. Fully burdened labor rate includes everything the employer actually spends to put an employee in the field for a billable hour.

    Payroll taxes. Federal and state unemployment, Social Security, Medicare. Typically 7 to 10 percent on top of wage depending on state.

    Workers’ compensation premium. This is where restoration’s burden math gets aggressive. WC rates for restoration field classifications run significantly higher than office classifications — commonly 8 to 15 percent of wage, sometimes higher in certain states or for certain work categories. A single bad claim can push experience modifications upward and make the rate even higher for years.

    Health insurance and benefits. Health coverage, dental, vision, life insurance. For restoration companies offering competitive benefits, 10 to 20 percent on top of wage.

    Retirement plan contributions. If the company matches 401(k) contributions or funds a similar plan, typically 3 to 6 percent.

    Paid time off. Vacation, sick leave, holidays. A crew member earning $25 an hour who gets three weeks of PTO plus seven holidays a year is being paid roughly 10 percent of total hours for time when they are not working. That is not a wage line — it is a cost the company carries.

    Training and certification. IICRC certifications, continuing education, safety training, vendor-specific platform training. This is billable-adjacent time that the company pays for without direct revenue attached. Meaningful on an annual basis.

    Non-billable field time. Travel between jobs, material pickup, equipment staging, morning and end-of-day procedures, weather delays, waiting on authorization. The crew member is on the clock but not producing billable hours. For a well-run operation, this might be 15 percent of total on-the-clock hours. For a poorly-run one, it can be 30 percent or more.

    Stacked together, these cost layers push a $25-per-hour wage to an effective cost of $38 to $45 per hour before the company even thinks about what margin it needs to add to produce profit.

    Why This Matters for Pricing

    Clipboard and tablet on a kitchen counter during an insurance adjuster walkthrough after water loss
    Why this matters for pricing.

    When a restoration company estimates a job, the labor line is usually calculated by multiplying expected hours by some hourly rate. If that rate is base wage, every estimate is systematically understating the actual cost of labor. Every job is quietly running at a margin below what the estimate showed.

    The correction is straightforward in concept: cost labor at fully burdened rate in every estimate. The correction is harder in practice because it requires the company to actually calculate its fully burdened rate, update it at least annually, and integrate it into the estimating workflow. Most restoration companies do not do this systematically.

    The companies that do are often surprised by what happens when they convert. Estimates that used to show 45 percent gross margin suddenly show 32 percent. Estimates that used to show 35 percent suddenly show 22 percent. These are not new numbers — they are the numbers the company has been living on all along. The only thing that changed is the visibility.

    Once visibility is in place, decisions start shifting. Pricing on categories with unacceptable fully-loaded margin gets adjusted upward. Categories of work with consistently unfavorable labor economics get deprioritized. Training investments that improve productivity get better ROI cases because the actual labor cost they reduce is now a visible number.

    The Workers’ Comp Layer Is Its Own Discipline

    Workers’ compensation deserves specific attention because it is the burden category where sophisticated management produces the most leverage.

    The premium itself is rate times payroll times experience modification factor. The rate is set by state rating bureaus and varies by job classification — field crew classifications for restoration work carry meaningfully higher rates than office classifications. The experience modification factor (the “mod”) reflects the company’s claims history relative to similar-sized companies in similar classifications. A clean safety record over time drives the mod below 1.0, which reduces premium. A series of claims drives it above 1.0, which increases premium.

    Restoration companies with well-run safety programs, disciplined incident reporting, active return-to-work protocols, and clean claims histories routinely pay 20 to 40 percent less in workers’ comp premium than similar companies without those practices. That is real money — often tens of thousands of dollars annually — and it is entirely within operational control.

    The specialist to engage here is not a restoration coach. It is a commercial insurance broker who specializes in contractors, paired with a safety consultant or fractional HR function who knows how to run the programs that drive mod favorably. This is one of the clearest examples of the local specialist principle in financial operations.

    Non-Billable Time Is the Hidden Cost Layer

    The category most restoration owners underestimate is non-billable field time. Crew members who are on the clock but not producing billable hours are a cost that shows up in labor burden but often does not get tracked as a specific number.

    A crew that starts its day at 7 AM, gets to the first job at 8 AM, takes a legitimate 30-minute lunch, spends 45 minutes at end of day loading out and returning to the shop, and is paid through 5 PM has billable hours somewhere between six and seven out of ten clock hours. That is not laziness. That is the structure of the day. But if the company is tracking productivity as though every clock hour is billable, the actual productivity number is 30 to 40 percent worse than the metric suggests.

    The operational practice that addresses this is honest tracking of billable versus non-billable time, route optimization to reduce between-job transit, better morning and end-of-day procedures to compress non-revenue time, and honest expectations of what crew productivity actually looks like on a real job day. The goal is not to eliminate non-billable time — it is impossible — but to understand it, minimize the avoidable portion, and cost it into labor burden honestly.

    Where to Start
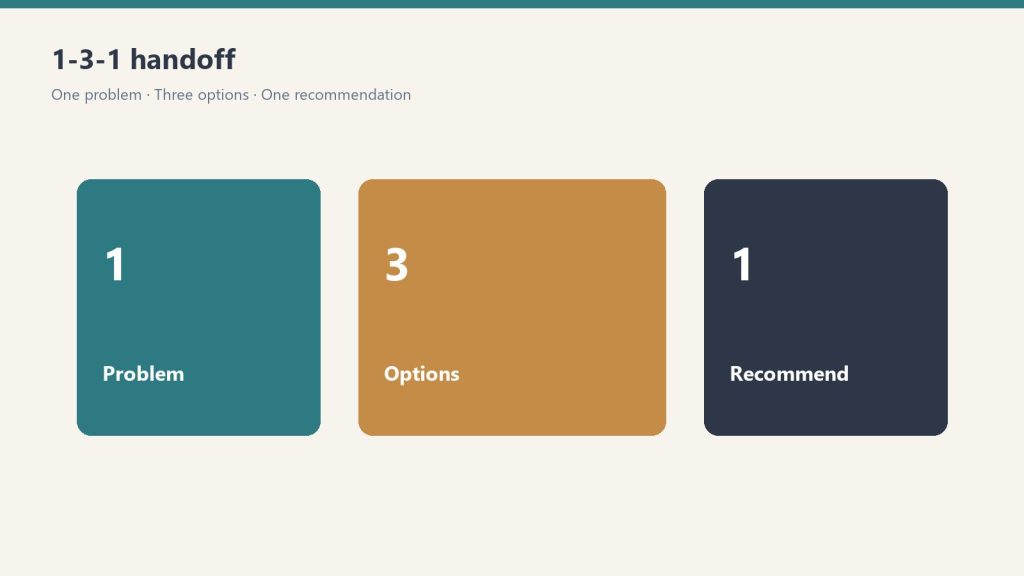
    Three panels showing one problem, three options, one recommendation
    Where to start.

    If you have not calculated a fully burdened labor rate for your company in the last year, that is the starting project this quarter.

    Pull the trailing twelve months of actual labor cost — wages, payroll taxes, workers’ comp premium, benefits, PTO, training, and any other employee-related spend. Divide by the trailing twelve months of productive billable hours (not total hours, billable hours). That is your current fully burdened rate.

    Compare that rate to the rate you are currently using in estimates. If there is a gap — and there almost always is — that gap is the margin your estimating system is systematically overstating.

    Update the rate in your estimating platform. Rerun the last ten closed jobs with the correct labor cost and see what happens to margin. Use the insight to inform pricing decisions, training investments, and program work acceptance.

    Do this annually going forward. Workers’ comp premiums shift. Benefit costs rise. Wage competition tightens. The labor burden rate from two years ago is not the rate today. The companies that keep it current make better decisions than the ones that do not.


    Related on Tygart Media: overhead allocation · cash flow & profit · Xactimate labor efficiency.

    Frequently Asked Questions

    What is labor burden in restoration? The total employer cost of an employee beyond base wages — including payroll taxes, workers’ compensation premium, benefits, retirement contributions, paid time off, training, and non-billable time.

    What is a typical labor burden rate in restoration? Fully burdened labor is typically 35 to 55 percent above base wage for restoration field workers. Workers’ compensation alone often adds 8 to 15 percent depending on state and classification, and benefits plus payroll taxes typically add another 15 to 25 percent.

    How do I calculate my fully burdened labor rate? Sum all trailing twelve-month employee-related costs (wages, payroll taxes, WC premium, benefits, retirement contributions, PTO, training) and divide by productive billable hours. The result is the rate to use in estimating and job costing.

    Why does workers’ comp matter so much in restoration labor burden? Because restoration field classifications carry meaningfully higher rates than office classifications, and a company’s claims history directly affects its experience modification factor. A clean safety record and strong return-to-work practices can reduce premium by 20 to 40 percent over time.

    What is non-billable time and how does it affect labor cost? Non-billable time is hours crew members are on the clock but not producing billable hours — transit between jobs, material pickup, equipment staging, morning and end-of-day procedures. Well-run operations run at 15 percent non-billable. Poorly-run operations can hit 30 percent or more, which substantially increases effective labor cost per billable hour.

    Should I include PTO in labor burden calculations? Yes. Paid time off is a cost the company pays without receiving billable hours in return, which means it is a real component of the cost per productive hour. Excluding it from burden calculations understates true labor cost.


    Tygart Media on restoration — an analyst-operator body of work on the systems that separate compounding restoration companies from busy ones. No client names. No brand placements. Just the operating standard.
  • Restoration Overhead Allocation: Calculate True Job Costs

    Restoration Overhead Allocation: Calculate True Job Costs

    What is overhead allocation in restoration? Overhead allocation is the practice of distributing the company’s indirect costs — facility, administrative staff, software, vehicles, insurance, ownership salary — across individual jobs so that each job bears its share of the total cost of running the business. Without overhead allocation, job-level gross margin is a misleading number because it ignores the fixed cost layer every job must cover.


    A restoration company quotes a water mitigation job at $8,500 with an expected gross margin of 42 percent. The job runs clean. Labor comes in at budget. Materials and equipment land on target. Subcontractor work is minimal. The owner looks at the close-out report and sees a 42 percent gross margin, just as forecast.

    The job did not actually make 42 percent. It made something less than that — because none of the overhead the company runs on a monthly basis is reflected in the gross margin calculation. The facility rent, the accounting staff, the dispatcher, the software subscriptions, the vehicles, the insurance, the owner’s compensation — all of that is absorbed at the P&L level, not at the job level. Which means the 42 percent gross margin is the starting point, not the ending point.

    Restoration companies that do not allocate overhead to jobs make strategic decisions on the wrong number. They accept program work that looks profitable at the gross margin line and is not profitable at the fully-loaded level. They expand service lines that look contributive and are actually dilutive. They price jobs based on a margin model that leaves the overhead contribution to chance.

    What Overhead Allocation Actually Does

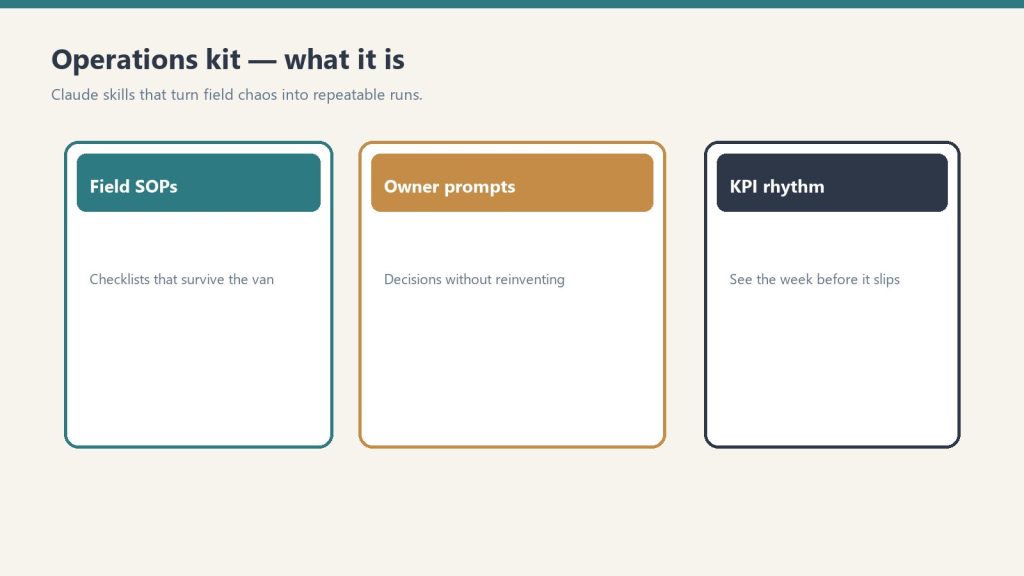
    Three cards for field SOPs, owner prompts, and KPI rhythm in an operations kit
    What overhead allocation actually does.

    Overhead allocation is the accounting practice of distributing the company’s indirect costs — the ones not directly attributable to a specific job — across all jobs in a systematic way. The goal is to produce a fully-loaded job-level cost number that reflects what it really costs the company to deliver each job, not just the variable costs.

    The mechanics are straightforward. Calculate the company’s total annual overhead — every cost that is not direct labor, direct materials, direct equipment, or direct subcontractor cost. Divide that number by the company’s annual revenue (or some other allocation base such as direct labor hours or direct cost). The result is an overhead rate, typically expressed as a percentage, that gets applied to every job.

    If a company has $750,000 in annual overhead and $5 million in annual revenue, the overhead rate is 15 percent. Every job the company runs is carrying that 15 percent load. The water mitigation job quoted at $8,500 is allocating $1,275 to overhead before any profit drops to the bottom line. Gross margin of 42 percent — $3,570 — turns into a contribution after overhead of $2,295. A very different number.

    Why Most Restoration Companies Skip This

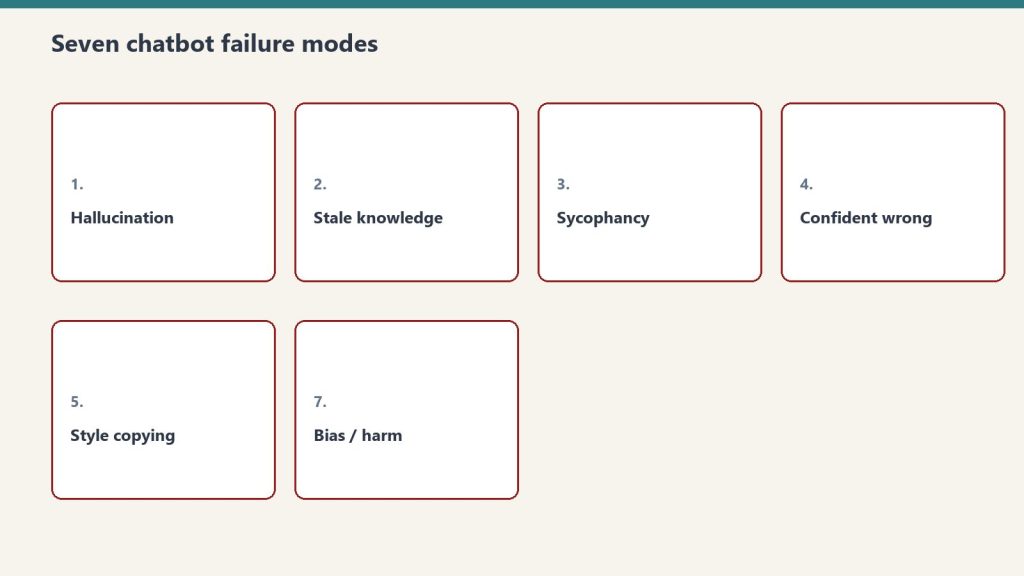
    Seven cards naming common AI chatbot failure modes
    Why most restoration companies skip this.

    Overhead allocation is one of those financial disciplines that feels complicated on day one and obvious after six months. Most restoration companies never get to day one for two reasons.

    The first is that overhead allocation adds a step to every job cost calculation, and without a clear protocol it becomes one more thing the ops team does not have time for. If it is not systematized, it does not happen.

    The second is cultural. Restoration owners who grew up in the trade tend to think about jobs in terms of direct cost — labor, materials, equipment, subs. Allocated overhead feels like an accounting abstraction that does not reflect “real” operating cost. The feeling is understandable. The consequence is that the decisions made without allocated overhead are decisions made on a partial number.

    What You Need to Calculate the Rate

    Calculating a defensible overhead rate requires a clean view of the company’s fixed cost structure. The categories typically included in overhead are:

    Facility costs — rent, utilities, property maintenance for offices, shops, and warehouses.

    Administrative staff — accounting, dispatch, office management, executive assistance, and any other non-billable staff.

    Software and technology — job management systems, accounting systems, CRM, estimating platforms, and infrastructure.

    Vehicles and fleet — payments, insurance, fuel, and maintenance for any vehicles not directly assigned to a billable crew.

    Professional services — accounting, legal, banking, insurance brokerage fees.

    Ownership compensation — the portion of owner salary and benefits not directly tied to billable work.

    Marketing — website, content, advertising, sponsorships, and related spend.

    Indirect equipment — equipment held in inventory that is not directly allocated to jobs.

    General insurance — liability, workers’ comp allocations not captured in burdened labor, umbrella coverage.

    Sum those categories across a trailing twelve months. Divide by annual revenue (the simplest base) or by direct labor hours (more sophisticated, better for labor-intensive operations). The result is the rate you allocate to every job going forward.

    How It Changes Decisions

    Three panels showing one problem, three options, one recommendation
    How it changes decisions.

    Once overhead is allocated at the job level, a different picture of the business emerges.

    Jobs that looked profitable on gross margin turn out to be barely contributing after overhead. Service lines that looked like growth opportunities turn out to be underwater at the fully-loaded level. Program work that was accepted at attractive gross margin turns out to be losing money once the compliance overhead is included. Categories of residential work that felt marginal turn out to be the most profitable segment in the business.

    None of these observations are possible without allocated overhead. With it, strategic decisions sharpen. Pricing moves in categories where the fully-loaded margin is too thin. Program contracts get renegotiated when the number comes up for review. Service line investment shifts toward the segments producing real contribution. Over a year or two, the company’s margin trend moves — not because anything dramatic happened, but because the decisions got better.

    Overhead Allocation and the Post-Mortem

    Overhead allocation pairs directly with the every-job post-mortem. The post-mortem reviews estimated-vs-actual margin on every closed job. If the margin numbers on the report are gross only, the review is working with a partial picture. If they are fully-loaded — gross margin minus allocated overhead — the review sees what the company is actually earning on each job.

    This is the difference between a post-mortem that produces operational lessons and a post-mortem that produces financial strategy. Operational lessons come from gross-level data. Financial strategy comes from fully-loaded data.

    A company serious about compounding installs both the overhead allocation and the post-mortem, and uses them together.

    Common Mistakes

    A few consistent mistakes show up when companies install overhead allocation for the first time.

    Wrong allocation base. Using revenue as the allocation base is simple but can distort results when different service lines have very different revenue-to-labor ratios. Using direct labor hours is often better for labor-intensive work. Using direct cost is sometimes the cleanest base overall. Pick the base that reflects the actual driver of overhead consumption in the specific company.

    Static rate never updated. The overhead rate calculated at the start of year one is almost certainly wrong by year three. Overhead grows. Revenue mix shifts. The rate needs to be reviewed and recalibrated at least annually and ideally quarterly for fast-growing companies.

    Allocated too aggressively. Including costs in overhead that should be direct — for example, putting project management time in overhead when it should be allocated to specific jobs — inflates the rate and distorts every job’s margin picture. Define the direct/indirect boundary carefully.

    Used as a finance exercise, not an operating practice. If the overhead rate lives in the CFO’s spreadsheet and never shows up on a job cost report, it has no effect on the company. Integrating allocated overhead into the live job cost data is what makes the practice operationally useful.

    Where to Start

    If overhead is not currently allocated at the job level in your company, start with the trailing twelve months.

    Pull the P&L. Identify every cost that is not directly tied to a specific job. Sum those categories. Calculate the rate as a percentage of revenue. Apply that rate to the last fifty closed jobs and recalculate job-level margin on a fully-loaded basis.

    The pattern that emerges will tell you where the real profitability is in the business — and where it is not. Some of what you find will be uncomfortable. All of it will be more useful than the gross-margin-only picture you were working from before.

    Integrate the allocated overhead into every future job cost report. Recalibrate the rate quarterly for the first year, then annually. Use the fully-loaded numbers in the weekly post-mortem and in every strategic pricing or program decision.

    Within two quarters, the company starts making different decisions. Within a year, the margin trend reflects it.


    Related on Tygart Media: cash flow & profit · labor burden · company revenue.

    Frequently Asked Questions

    What is overhead allocation in a restoration company? The practice of distributing indirect costs — facility, administrative staff, software, vehicles, insurance, ownership compensation, marketing, professional services — across individual jobs through a calculated overhead rate, producing a fully-loaded cost number for each job.

    Why does overhead allocation matter? Because job-level gross margin without allocated overhead is a misleading number. Strategic decisions about pricing, service mix, and program acceptance made on gross margin alone often move the company in the wrong direction once the overhead layer is included.

    What is a typical overhead rate for restoration companies? Typically 15 to 25 percent of revenue for mid-sized restoration companies, though the correct rate for a specific company depends on its cost structure, scale, and operating model. The rate should be validated against the company’s actual trailing overhead, not benchmarked against industry averages.

    What allocation base should I use? Revenue is the simplest and works well for most restoration companies. Direct labor hours is better for labor-intensive operations where labor is the primary driver of overhead consumption. Direct cost is the cleanest academic base but requires more sophisticated tracking. Pick the base that reflects the actual cost driver in your operation.

    How often should the overhead rate be updated? At least annually. For fast-growing companies or companies undergoing material changes in service mix, quarterly review is appropriate. A stale rate produces decisions based on outdated cost structure and quietly drifts the company’s margin picture.

    Do I need sophisticated accounting software to allocate overhead? No. The rate calculation is arithmetic. Applying the rate to each job cost report is a formula. The discipline matters more than the software — a spreadsheet-driven practice run consistently produces better results than an expensive system that no one uses.


    Tygart Media on restoration — an analyst-operator body of work on the systems that separate compounding restoration companies from busy ones. No client names. No brand placements. Just the operating standard.
  • Restoration Cash Flow: Why Profitable Companies Go Broke

    Restoration Cash Flow: Why Profitable Companies Go Broke

    What is the difference between cash flow and profit in restoration? Profit is the difference between revenue and costs on the P&L. Cash flow is the actual movement of money in and out of the bank. In restoration, profit can be strong while cash flow is in crisis because carriers and TPAs often take 60 to 180 days to pay invoices while payroll, materials, and subs are paid weekly or on net-30. A profitable restoration company can run out of cash without ever having a margin problem.


    The most common financial shock a growing restoration company encounters is not a bad quarter on the P&L. It is a Friday morning where the company is profitable on paper and does not have enough cash in the bank to make payroll.

    This is the restoration industry’s defining financial paradox. The company has earned the money. The carriers and commercial clients owe the money. The receivables are clean. And the bank balance does not care about any of that, because none of that money has arrived yet.

    Understanding the mechanism — and installing the disciplines that manage around it — is one of the more important financial skills a restoration owner develops. The alternative is learning it the expensive way.

    Why the Paradox Exists

    Seven cards naming common AI chatbot failure modes
    Why the paradox exists.

    A restoration company’s economic engine has a built-in timing mismatch. On the cost side, money goes out on a predictable weekly or bi-weekly cycle — payroll, materials, equipment rentals, subcontractor progress payments, utilities, lease payments. These are not negotiable. They happen.

    On the revenue side, money comes in on a much slower and less predictable cycle. Insurance carriers take 45 to 120 days to pay a standard claim invoice. TPAs often take 60 to 180 days, sometimes longer. Commercial direct-pay clients can take anywhere from 30 to 90 days depending on their own payables practices. Homeowner out-of-pocket tends to be the fastest, but it is a small fraction of most companies’ revenue mix.

    The gap between those two cycles is the working capital requirement. For a restoration company doing $5 million in annual revenue, with an average payment cycle of 75 days, the working capital load at any moment is roughly one million dollars. That is the amount of cash the company has to have access to — through equity, retained earnings, or bank financing — just to run the business it already has.

    That is the paradox. Profitable companies routinely experience cash crises that have nothing to do with whether the company is making money. They have everything to do with the structural timing of when the money arrives.

    How the Paradox Kills Companies

    A restoration company dies of cash flow, not profitability. The pattern is consistent enough that it is almost a template.

    Phase one: the company is growing. Revenue is up. Margin is solid. The owner is reinvesting in equipment, crew, and market expansion. Working capital demand is growing faster than retained earnings.

    Phase two: a cash gap opens. A large job completes, gets invoiced, and the carrier takes 90 days to pay. Or a storm event produces a surge of work that has to be fronted before any of it bills. Or a new carrier program gets added with a 120-day payment cycle. The gap is manageable with a line of credit — but the line needs to be sized for the new reality, not the old one.

    Phase three: the owner delays the conversation with the bank because things feel fine this month. Revenue is up. Margin is solid. The next big check is just around the corner. Why go into debt when we are profitable?

    Phase four: the check is a week late. Or two weeks late. Or the carrier has a documentation question that will take another ten business days to resolve. And payroll is Friday.

    Phase five: emergency financing at premium rates, delayed payments to subcontractors that damage relationships, a conversation with key customers about payment plans that should never have been necessary. The company recovers — most do — but it has just spent money and relationships it did not need to spend, because the cash flow discipline was not installed before it was needed.

    The companies that compound do not get caught in this pattern. Not because they are luckier. Because they installed the discipline.

    The Separation of Profit from Cash

    The first operating discipline is simply to stop conflating the two numbers in your head.

    Profit is the signal that tells you whether the business model works. It is a lagging indicator — last month’s P&L reflects what happened months ago in pricing and productivity — but it is the right signal for asking is this business economically viable?

    Cash flow is the signal that tells you whether the business can continue operating next Friday. It is a real-time indicator — today’s bank balance reflects today’s collections and today’s payables — and it is the right signal for asking can we pay our obligations on time?

    These are two different questions with two different answers. A restoration company can be strongly profitable and in cash crisis at the same time. Another can be slightly unprofitable and cash-rich because it just collected on a backlog of aged receivables. Neither number is more important than the other. Both have to be watched, and they have to be watched with different instruments.

    The Four-Part Cash Discipline

    Clipboard and tablet on a kitchen counter during an insurance adjuster walkthrough after water loss
    The four-part cash discipline.

    A working cash flow discipline for a restoration company has four parts, run in parallel.

    A rolling 13-week cash forecast. Projected inflows by payer type, projected outflows by category, weekly beginning and ending balance. Updated weekly. This is the single most important cash management instrument a restoration company can build. It surfaces any cash gap at least 10 to 12 weeks before it becomes a crisis, while there is still time to respond calmly.

    AR aging by payer type, reviewed weekly. Not aggregate aging — payer-specific. Every week, identify which payers are drifting and why. Respond to drift immediately with the specific escalation playbook for that payer type.

    A banking stack sized to actual working capital load. A line of credit sized for peak working capital needs plus headroom, used strategically rather than reactively. Potentially supplemented by receivables financing or factoring instruments on specific categories of work where the math justifies them. Detailed in the cash discipline companion article.

    Progress billing on every job where it is structurally possible. Agreed scope tiers at the start of the job, invoiced as each tier completes, moving through the payment cycle independently. This one practice alone can reduce a restoration company’s effective DSO by weeks.

    Running all four in parallel is what separates companies that handle the cash paradox gracefully from companies that get eaten by it.

    What the Discipline Buys You

    A restoration company with a disciplined cash management practice does several things better than one without it.

    It can take on larger jobs with longer payment cycles without stress, because the working capital is pre-positioned. It can survive surge events — storms, CAT work, unexpected volume — without emergency financing. It can negotiate with subcontractors and vendors from a position of strength rather than as someone requesting extended terms. It can reinvest in equipment, people, and growth opportunities when they appear, rather than waiting for cash to arrive. It can sell, when the time comes, at a higher multiple because clean cash management is part of what sophisticated buyers are paying for.

    None of these outcomes are produced by being more profitable. They are produced by being more disciplined about the gap between profitability and cash.

    Where to Start

    Three panels showing one problem, three options, one recommendation
    Where to start.

    If you do not have an explicit cash flow discipline in place today, start this week.

    Build a rough 13-week rolling forecast — it does not have to be perfect. Project inflows by payer type against actual AR aging. Project outflows against the payment cycle you already run. Note the weeks where the projected ending balance is tight. Those are the weeks to focus on.

    Pull AR aging by payer type. Identify the two payer categories pulling hardest on working capital. Build a specific escalation playbook for each.

    Schedule a conversation with your primary banker. Walk through the working capital load, the current line size, and whether the line and related instruments are sized for the company as it exists today. If not, address the gap before you need the gap to be addressed.

    The cash flow paradox does not go away. It is structural to the restoration industry. What goes away is the risk of being caught by it — once the discipline is installed and running.


    Related on Tygart Media: overhead allocation · labor burden true cost · company revenue.

    Frequently Asked Questions

    What is cash flow in a restoration company? Cash flow is the actual movement of money in and out of the bank — collections from customers on one side, payments for payroll, materials, subcontractors, and operating expenses on the other. It is separate from profit, which is calculated on the P&L based on revenue earned and costs incurred regardless of when cash actually moves.

    How can a restoration company be profitable and still run out of cash? Because the timing gap between when revenue is earned and when payment actually arrives can be 60 to 180 days, while payroll, materials, and subs are paid weekly or on net-30. A profitable company can have all its cash tied up in receivables and not enough on hand to meet short-term obligations.

    What is a 13-week cash forecast? A rolling projection of weekly cash inflows and outflows for the next 13 weeks, updated weekly. It identifies cash gaps 10-12 weeks before they become crises and is the single most important cash management instrument a restoration company can build.

    What causes cash flow problems in restoration companies? Four main causes: slow-paying carriers and TPAs with 60-180 day payment cycles, fast growth that outpaces retained earnings, absence of structured progress billing on jobs that could support it, and lines of credit sized for smaller versions of the company rather than current operating scale.

    How much working capital does a restoration company need? A reasonable approximation is annual revenue divided by 365, multiplied by average days-to-payment across the payer mix. For a $5 million company with a 75-day average payment cycle, that is roughly one million dollars in working capital load. The actual number varies by revenue mix and operating cycle.

    Is it normal for a restoration company to use a line of credit? Yes — in almost every case. A properly sized line of credit is the foundational instrument for managing the structural cash gap in the restoration industry. Using it strategically is a sign of disciplined financial management, not distress.


    Tygart Media on restoration — an analyst-operator body of work on the systems that separate compounding restoration companies from busy ones. No client names. No brand placements. Just the operating standard.
  • Restoration Job Costing: The Hidden Cost of Missing Data

    Restoration Job Costing: The Hidden Cost of Missing Data

    What is job costing in restoration? Job costing is the practice of tracking every cost associated with a specific job — labor (fully burdened), materials, equipment, subcontractors, allocated overhead — against the revenue that job produced. It is not the same as tracking revenue by job. A restoration company without job-level cost actuals cannot know which job types are profitable, which estimators are accurate, or which SOPs are holding scope.


    There is a gap between what a restoration company’s P&L tells the owner and what the owner actually needs to know to run the business. The P&L aggregates everything to monthly or quarterly totals. The owner needs to know whether the last ten water mitigation jobs produced their target margin, whether the carrier program work is still profitable, and whether the estimator hired eighteen months ago is writing scopes that hold.

    Those questions can only be answered by job costing — and most restoration companies do not do it.

    The Difference Between Revenue-by-Job and Cost-by-Job

    Five-step flow from estimate to supplement, approve, invoice, cash
    The difference between revenue-by-job and cost-by-job.

    Almost every restoration company, even small ones, tracks revenue at the job level. Every invoice is associated with a job. Every payment gets applied to a job. The revenue side of job-level economics is usually clean.

    The cost side is where most restoration companies run blind. Labor hours charged to a specific job — sometimes tracked, sometimes not. Materials pulled for a job — often tracked on a work order, sometimes just billed to the month. Equipment deployed to a job — almost never tracked with a cost allocation. Subcontractor invoices tied to a job — usually yes, but often without the markup reconciled against what was billed to the customer. Allocated overhead — almost never applied at the job level.

    The result is a gap. The owner knows what each job invoiced. The owner does not know what each job cost. And without that second number, the first number is decoration.

    What the Gap Costs

    The first cost is invisible margin drift. A restoration company doing $5 million in revenue at a reported 45 percent gross margin may actually be running at 38 percent once labor is fully burdened, equipment depreciation is allocated, and subcontractor markup variance is reconciled. That seven-point gap is $350,000 a year — and the owner has no way to see it, or to find out which job types are driving it.

    The second cost is decision-making based on the wrong signal. When the owner does not know actual margin by job type, every strategic decision — whether to take on more of a category of work, whether to expand into a new service line, whether to accept a TPA program’s rate structure — gets made on revenue rather than contribution. Expanding into a category that looks profitable on revenue can turn out to be subsidizing the rest of the business on contribution. Owners who do not have job costing in place make this kind of mistake routinely and never know it.

    The third cost is estimator drift. Estimators who never see their estimates compared to actuals slowly drift toward estimates that close the work rather than estimates that produce the right margin. The drift happens quietly. Six months later, the company’s average margin on water mitigation has moved down two points. No one can say why. The estimator is writing the same kinds of scopes they have always written — except those scopes do not reflect the current labor rates, current material costs, or current productivity, because the feedback loop has never been installed.

    What a Minimum Job Cost Report Looks Like

    Three cards for field SOPs, owner prompts, and KPI rhythm in an operations kit
    What a minimum job cost report looks like.

    A restoration company does not need an enterprise-grade accounting system to do basic job costing. It needs a shared discipline that captures the following, at minimum, for every job:

    Revenue by line item (labor, materials, equipment, subcontractor markup) as invoiced.

    Labor hours at fully-burdened rate — wages plus payroll taxes, workers’ comp, benefits, paid time off, and a reasonable allocation for the non-billable time that is part of running a field workforce.

    Materials cost at purchased rate.

    Equipment utilization cost at an allocated rate per unit per day deployed.

    Subcontractor invoiced cost (and the spread between that and what was invoiced to the customer).

    An overhead allocation — typically a percentage of revenue, calibrated against the company’s actual overhead run rate.

    The report then shows estimated margin, actual margin, and variance. The variance is the most important number on the page.

    The Practice That Makes Job Costing Useful

    Job costing data sitting in a spreadsheet nobody reads is not doing any work. The discipline is built by using the data — every week, in the every-job post-mortem, against every job that closed that week.

    The review process is straightforward. Pull the job cost reports for the week. Rank them by margin variance — largest negative at the top, largest positive at the bottom. Walk through the top five negative-variance jobs. What happened. Was it scope capture, labor productivity, subcontractor markup, materials — what specifically drove the miss. Then walk through the top five positive-variance jobs with the same rigor. What happened there. What can be systematized.

    Over three months, the pattern becomes visible. Certain job types consistently miss. Certain estimators consistently hit or miss. Certain carrier programs produce systematically different outcomes than others. The pattern is what produces strategic action — pricing adjustments, training investments, program decisions. Without the pattern, strategy is guessing.

    The Owner’s Actual Margin Question

    The single most useful question an owner can ask themselves is: Can I tell you the actual gross margin on my last ten jobs — not the estimate, the actual — broken out by service line?

    If the answer is yes, the owner is running a business that has installed job-level cost visibility and is making strategic decisions on the strength of that data.

    If the answer is no, the owner is running a business that is operating on a P&L signal that is weeks or months behind the operating reality. Correcting that is the highest-leverage financial discipline the owner can install in the next ninety days. Everything else — pricing strategy, capacity planning, program decisions, growth investments — compounds off the quality of the job-level data underneath it.

    The discipline is not complicated. It is the documentation layer applied specifically to job economics. Install it. Use it in the weekly post-mortem. Watch the margin tighten within a quarter.

    Where to Start

    Three panels showing one problem, three options, one recommendation
    Where to start.

    If job costing is not a live practice in your company today, start with one service line.

    Pick the service line that represents the largest share of your revenue or the one whose margin you have the most uncertainty about. Build a simple job cost report for that service line: revenue, fully-burdened labor, materials, equipment at an allocated rate, subcontractor cost, and overhead allocation. Run it for the next thirty days of jobs in that service line.

    At the end of thirty days, pull the reports into the post-mortem and analyze the variance pattern. You will find things you did not know. Almost certainly, some of them will be worth material money once addressed.

    Extend to the second service line at ninety days. Extend to the third at six months. By month twelve, every job in the company has a cost report, every service line has a margin trend, and the company is operating on the real numbers instead of the P&L approximation. The decisions that get made from that point forward are made with visibility the company did not have before — and the financial trajectory of the business starts to reflect it.


    Frequently Asked Questions

    What is the difference between revenue-by-job and job costing? Revenue-by-job tracks what a job invoiced. Job costing tracks both revenue and actual cost — fully burdened labor, materials, equipment, subcontractors, and allocated overhead — to produce an actual margin number for each job. Most restoration companies track the first and not the second.

    What should a restoration job cost report include? At minimum: revenue by line item, labor at fully burdened rate, materials cost, equipment utilization at an allocated rate, subcontractor invoiced cost, overhead allocation, estimated margin, actual margin, and variance.

    How often should job cost reports be reviewed? Weekly, in a cross-functional post-mortem where estimating, ops, PM leadership, and billing walk through the week’s closed jobs together. Monthly review is too far downstream of the work to change estimator or operational behavior.

    What is fully burdened labor in restoration? Wages plus payroll taxes, workers’ compensation premium, benefits, paid time off, and an allocation for non-billable time (training, travel, downtime). Workers’ comp alone in restoration often adds 8-15 percent to the base wage. A restoration company costing labor at base wage is understating labor cost by 30 percent or more.

    What overhead allocation rate should I use? A rate calibrated against your company’s actual overhead run rate, expressed as a percentage of direct cost or revenue. Typical ranges are 15-25 percent of revenue for mid-sized restoration companies, but the correct number for your company depends on your specific cost structure and should be validated with your CPA or fractional CFO.

    How do I start job costing if I do not have sophisticated accounting software? Start with a spreadsheet on one service line. The software is not the barrier — the discipline is. Once the practice is installed and the team is using it, upgrading to a better system becomes a tooling decision rather than a cultural one.


    Tygart Media on restoration — an analyst-operator body of work on the systems that separate compounding restoration companies from busy ones. No client names. No brand placements. Just the operating standard.

  • Restoration Cash Flow: Billing, DSO, and Bank Strategies

    Restoration Cash Flow: Billing, DSO, and Bank Strategies

    How should restoration companies manage cash flow? Restoration companies should manage cash through four combined instruments: progress billing with agreed-upon scope tiers invoiced early and often, strict DSO discipline by payer type, a bank layer that finances the carrier-payment gap at acceptable rates, and strategic judgment about when to wait on high-margin jobs versus when to factor receivables for speed. Relying on any single instrument leaves money on the table.


    The restoration industry’s defining financial paradox is the gap between when revenue gets earned and when cash actually arrives. You front payroll weekly, you pay materials on net-30 or COD, you carry subcontractors, and you wait 60 to 180 days — sometimes longer — for the carrier or TPA to pay. A profitable restoration company can run itself into a cash crisis without ever having a margin problem.

    Most restoration owners treat this as a hazard of the industry. The ones who treat it as a problem to be engineered against — with a specific stack of financial instruments — outcompete the ones who do not.

    The Working Capital Reality

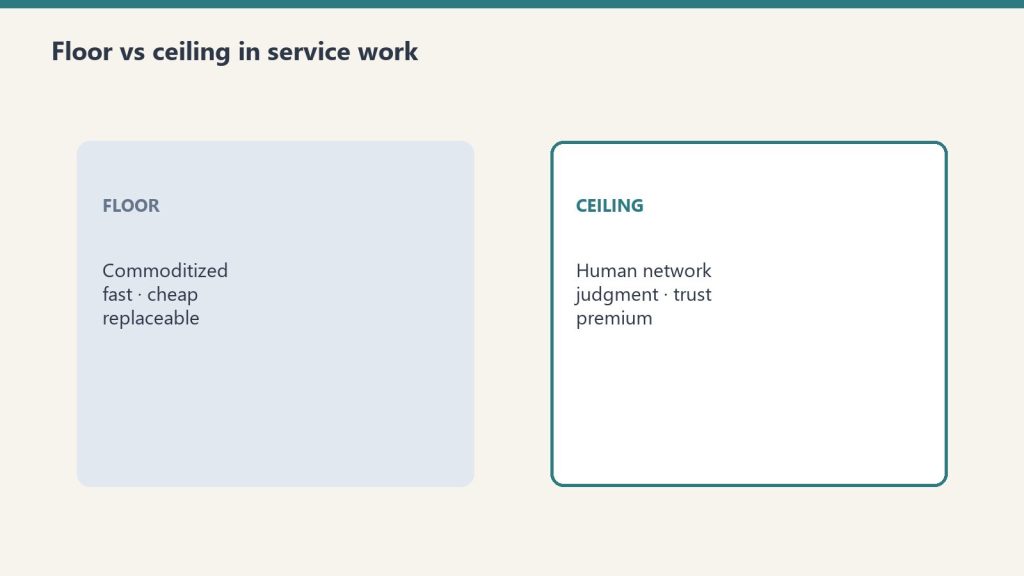
    Floor versus ceiling cards for commoditized work and human-network premium
    The working capital reality.

    Before getting to the solution, it helps to see the actual shape of the problem. A typical $5 million restoration company with insurance-driven revenue is carrying — at any moment — somewhere between $600,000 and $1.2 million in outstanding receivables, plus another significant amount in work-in-progress that has not yet been billed. That money is real. The company earned it. But it is not in the bank, and payroll is on Friday.

    For a company running on healthy margin and disciplined operations, this is manageable. For a company scaling fast, running tight on reserves, or exposed to a few slow-paying programs, the same working capital load is an existential problem. One unexpected large loss, one slow quarter, one carrier dispute, and the company is suddenly calling creditors.

    Cash discipline is what keeps that version of events from happening. It is not optional. It is not a CFO problem to solve quietly in the background. It is an operating discipline the owner has to own.

    Instrument One: Progress Billing on Agreed Tiers

    Clipboard and tablet on a kitchen counter during an insurance adjuster walkthrough after water loss
    Instrument one: progress billing on agreed tiers.

    The first and most underused instrument is progress billing against agreed-upon scope tiers — and it starts at the very beginning of the job, not at the end.

    Insurance carriers, commercial clients, and TPAs almost always want to know the number before they can move. Rough order of magnitude. Small scope that can be confirmed and approved right away. A clear path to subsequent tiers as the job evolves. A restoration company that can articulate this structure — this is the day-one scope at $X, the day-five estimate at $Y, the day-fifteen rebuild scope to be confirmed at $Z — is a restoration company that can invoice at the completion of each tier instead of waiting until the entire job closes.

    That is a cash-flow difference of weeks to months.

    The discipline works like this. On day one of the loss, the team commits to a small initial scope with an agreed dollar figure. Emergency services, initial mitigation, documentation setup. That tier invoices on day one or day two — not at the end of mitigation. On day three or four, the expanded mitigation scope gets agreed and committed. That tier invoices as it completes. On day fifteen or twenty, the reconstruction scope — which by now has had time to be properly estimated — gets committed and billed in progress milestones.

    Every tier is a real invoice that can move through the carrier’s payment cycle on its own timeline. The company is never waiting on the entire job to close before any cash arrives. It is running four or five parallel billing streams, each of which reduces the average days from work-performed to cash-received.

    The resistance to progress billing is almost always cultural, not contractual. “That is not how we do it” is not a policy — it is an inherited habit. Nearly every carrier, TPA, and commercial client will accept progress billing against agreed scope tiers if it is structured cleanly and documented well. The companies that do it get paid faster. The ones that do not are still waiting.

    Instrument Two: DSO Discipline by Payer Type

    Three panels showing one problem, three options, one recommendation
    Instrument two: DSO discipline by payer type.

    Aggregate DSO is almost useless. DSO by payer type is one of the most important numbers a restoration company tracks.

    Insurance direct, TPA-managed, commercial direct, homeowner out-of-pocket — each of these pays on a different cycle, with different friction points, and responds to different collection pressures. A restoration company that runs a single aggregate DSO number is flying blind. A company that tracks DSO by payer, by carrier, and by program knows exactly which relationships are pulling working capital down and which are contributing.

    The operating practice is straightforward. Every week, pull AR aging by payer type. Identify any payer category whose DSO is moving in the wrong direction. Drill into the specific invoices driving the move. Escalate where appropriate — a call from the owner to the carrier program manager, a structured collections process for commercial direct-pay, a homeowner payment plan where the situation warrants.

    The companies that hold DSO tight do not do it by yelling at the billing team. They do it by making the number visible at the payer level every week, building specific response playbooks for each payer type, and escalating fast when the number drifts.

    This practice lives on top of the documentation layer — the invoices cannot move until the job documentation supports them, and the aging cannot be analyzed until the data is clean.

    Instrument Three: The Bank Layer

    Progress billing and DSO discipline reduce the gap. They do not eliminate it. Restoration companies need a bank layer that finances the unavoidable working capital cycle at acceptable rates.

    The instruments most commonly used are lines of credit, asset-based lending against receivables, and in some cases factoring arrangements where a bank or factor advances 60 to 80 percent of outstanding receivables immediately and settles the remainder when the carrier pays. Each of these has a role, and sophisticated restoration companies usually have more than one in the stack.

    A line of credit is the foundation. It provides flexible working capital for payroll, materials, and operational expenses during the gap between billing and payment. The interest is the cost of doing business — often well worth it compared to the revenue opportunity it unlocks. The size of the line should be calibrated to the company’s typical working capital needs during peak volume periods, with headroom for storm or surge events.

    Asset-based lending or receivables financing becomes relevant at larger scale, or during periods when the company is taking on high-margin work with extended payment cycles. The economics of receivables financing depend on the rate the bank charges and the margin on the work being financed. For a high-margin large loss or commercial project with a predictable 120-day cycle, factoring 70 percent of the receivable at acceptable rates often makes strategic sense. For low-margin program work with fast payment cycles, it usually does not.

    The strategic use of the bank layer is where a lot of restoration owners underperform. They either avoid debt financing out of a general aversion and constrain the company’s capacity, or they use it reactively during cash crises and pay premium rates when it matters most. Neither is disciplined capital management. The discipline is to size the stack deliberately, use it strategically, and adjust it as the company’s working capital profile changes.

    A practical companion read on one of these instruments: the line of credit decision framework pairs well with this piece. (Editor’s note: link to the LOC article once it’s published — update to final URL.)

    Instrument Four: The Strategic Wait vs. Factor Judgment

    The fourth instrument is not a product. It is a judgment.

    On some jobs, the right move is to factor the receivable the moment it is billable — take the 70 percent immediately, move the cash into payroll or reinvestment, and accept the factoring cost as the price of speed. On other jobs, the right move is to wait on the receivable and take the full margin when it arrives, because the bank layer has headroom to cover the operational needs without financing pressure.

    The judgment depends on three things: the margin on the job, the headroom on the existing bank stack, and the company’s current capacity constraints. A high-margin large loss on a carrier that pays in 120 days is usually worth waiting on if the line of credit has room. A low-margin program job on a slow-paying carrier during a cash-tight period is usually worth factoring to keep the operational engine running.

    Getting this judgment right over time — call it cash-flow portfolio management — is one of the more subtle skills a restoration owner develops. It is not taught in any standard restoration coaching program. It is learned by running the stack deliberately for enough years to see the patterns.

    The Corporate Precedent

    This discipline is not theoretical. In the global restoration and facilities companies where cash is managed at scale, branch-level DSO feeds directly into the corporation’s overall cost of capital. A branch that lets its DSO drift hurts the lending rates the entire company negotiates with its banks. That is a real, measurable cost, and it flows back to the branch in the form of scrutiny and constraint.

    Mid-market restoration companies do not face corporate-level consequences for DSO drift, but the economic principle is identical. A company with disciplined cash conversion gets better terms from its bank, can take on more work without capital constraints, retains more margin because it is not paying premium factoring rates under pressure, and compounds faster because its reinvestment capacity is larger.

    Cash discipline is not a financial hygiene issue. It is a strategic capability.

    Where to Start

    If cash discipline is not an explicit operating practice in your company today, here is the minimum first move.

    Pull AR aging by payer type this week. Not aggregate — by payer. Identify the two payer categories with the worst aging. Build a specific response playbook for each — escalation contacts, cadence, documentation requirements, escalation triggers. Run the playbook for ninety days and watch what happens.

    In parallel, review the company’s banking stack. Is the line of credit sized for current operating scale? Are factoring or receivables financing instruments available at acceptable rates? Is the stack being used strategically or reactively? A conversation with a banker who specializes in small-to-mid business lending is usually worth an afternoon.

    Then pilot progress billing on one category of work — commercial losses or large residential — for the next quarter. Structure the scope tiers, commit them with the client and carrier in writing at the outset, and invoice against them as they complete. Track the effect on that category’s average days-to-cash compared to the prior baseline.

    You are installing a financial operating system. It does not come together in a week. It compounds over years. The companies that have the discipline beat the ones that do not — not by outselling them, but by out-financing the same revenue.


    Frequently Asked Questions

    What is progress billing in restoration? Progress billing is the practice of invoicing against agreed-upon scope tiers as each tier completes — rather than waiting until the entire job closes. On an insurance loss, this often means a day-one emergency services invoice, a day-three expanded mitigation invoice, and a series of reconstruction milestone invoices, each moving through the payment cycle independently.

    What is DSO in restoration? Days Sales Outstanding (DSO) is the average number of days it takes for a restoration company to receive payment after an invoice is issued. Well-run companies track DSO by payer type — insurance direct, TPA, commercial, homeowner — because each has a fundamentally different payment cycle and a blended number hides the pattern.

    Should restoration companies use lines of credit? Yes — in almost every case. A line of credit is the foundational bank instrument for managing the working capital gap between earning revenue and receiving payment. Used strategically, it expands the company’s operating capacity. Used reactively during cash crises, it produces premium rates at the worst moment.

    When should a restoration company factor receivables? When the margin on the work is high enough to absorb the factoring cost, the payment cycle is long enough to matter, and the company’s existing bank stack does not have headroom for the working capital load. Factoring is a strategic tool, not a sign of distress — when used deliberately, it accelerates reinvestment and growth.

    What is a typical DSO for restoration companies? It varies widely by payer mix. Insurance direct can run 30 to 60 days. TPA-managed often runs 60 to 120 days. Commercial direct-pay can be 30 to 90 days depending on the customer. Homeowner out-of-pocket tends to be the fastest. A restoration company whose aggregate DSO is over 90 days usually has a specific payer category driving the result.

    Do banks understand restoration industry cash flow? Some do and some do not. Banks that specialize in small-to-mid service businesses — especially ones with experience in insurance-driven verticals — understand the working capital pattern and structure instruments around it. Banks without that specialization sometimes misprice the risk and offer unfavorable terms. Finding a banker who understands the industry is worth the effort.


    Tygart Media on restoration — an analyst-operator body of work on the systems that separate compounding restoration companies from busy ones. No client names. No brand placements. Just the operating standard.
  • Restoration Documentation for Better Carrier Relationships

    Restoration Documentation for Better Carrier Relationships

    This is the fifth and final article in the Carrier & TPA Strategy cluster under The Restoration Operator’s Playbook. It builds on the previous four articles in this cluster.

    Email Me This Article

    Documentation is the substrate of the entire carrier relationship

    Reading across the previous four articles in this cluster, a single underlying theme emerges. The carrier relationship is built on operational discipline. The scope discipline is built on documentation. The TPA relationship rewards documentation. Program standing is anchored in documentation. The pieces of the carrier relationship that contractors most commonly experience as friction — disputes, delays, denials, audits — are almost always traceable to documentation that was thinner or messier than it needed to be.

    This is not a coincidence. Documentation is the substrate of the entire carrier relationship. Every conversation between contractor and carrier ultimately comes back to what the file shows. Every decision the carrier makes about a contractor’s work, a contractor’s standing, or a contractor’s program access is informed by the patterns visible in the contractor’s files over time. Contractors with strong documentation produce conversations that go well, decisions that go their way, and reputations that compound. Contractors with weak documentation produce the opposite.

    The investment in documentation pays back across the entire carrier relationship in ways that no other single investment can match. This article is about what the documentation layer that makes every carrier conversation easier actually contains, why the investment produces such durable returns, and how contractors who have not yet built it should approach the work.

    What complete file documentation actually contains

    Gloved hands using a pin-type moisture meter on wet drywall during inspection
    What complete file documentation actually contains.

    A file that supports the carrier relationship at the highest level contains a defined set of documentation artifacts, organized in a way that makes the file easy for the adjuster, the supplemental reviewer, the quality auditor, the program manager, and any subsequent reviewer to understand the loss, the work performed, and the reasoning behind the decisions made.

    The first artifact is the loss documentation. Photos and notes that establish what happened, when, and what the affected areas were at the time of the contractor’s first arrival. This documentation has to be complete enough that anyone reviewing the file later can understand the loss without having been there. Date and time stamps. Multiple angles of each affected area. Wide establishing shots that give context. Close-ups that document specific damage. Notes that capture what was observed and any pre-existing conditions that bear on the claim.

    The second artifact is the mitigation documentation. Photos and notes that capture the work performed, the equipment placed, the moisture readings taken, and the conditions revealed during demo. The mitigation documentation should be timeline-organized so a reviewer can follow what was done and when. Equipment placement records that show what was where for how long. Moisture readings at consistent intervals at consistent locations. Photos of conditions discovered during demo, captured before any further work was done.

    The third artifact is the scope documentation. The original scope, written with clear references to the documentation that supports each line item. Any subsequent supplemental scopes, with their supporting documentation. The pricing reasoning where pricing deviates from program defaults. Any communications with the adjuster about scope decisions, captured in the file rather than only in email.

    The fourth artifact is the production documentation. Photos and notes that capture the work performed during the rebuild. Daily progress documentation. Documentation of any unexpected discoveries during execution. Documentation of any homeowner-requested changes and the resolution of those changes. Sub work documentation showing what was done by which sub on what dates.

    The fifth artifact is the customer communication documentation. Records of significant communications with the homeowner — initial scope discussions, schedule conversations, change discussions, problem resolution conversations. The documentation does not need to capture every casual conversation. It needs to capture the conversations that have implications for the file or that might be referenced later if a customer satisfaction issue arises.

    The sixth artifact is the close-out documentation. The final walkthrough, the punch list resolution, the warranty documentation handed to the homeowner, the final photos that document the completed work, and any post-completion communications.

    Each artifact is its own discipline. The complete file is the integration of all of them.

    Why the investment is structurally underrated

    Most restoration owners look at the documentation work and see effort that does not directly produce revenue. The mitigation crew is taking photos instead of placing more equipment. The estimator is writing detailed scope notes instead of moving to the next file. The project manager is updating documentation instead of solving the next operational problem. The time spent on documentation feels, in any single moment, like time taken away from production.

    This perspective is structurally wrong, but the wrongness is invisible quarter to quarter. The returns from documentation investment do not show up in the same period as the investment. They show up across the carrier relationship over years.

    The returns include faster scope approvals because adjusters have what they need to approve. They include fewer disputes because the documentation supports the contractor’s positions. They include faster supplements because the conditions are already documented. They include cleaner audit outcomes because the files survive scrutiny. They include stronger program standing because the contractor’s work consistently meets the bar. They include better customer satisfaction outcomes because the documentation supports clean execution. They include fewer customer disputes because the documentation establishes what was agreed to and when.

    Each of these returns is meaningful. None of them is dramatic in any single quarter. All of them compound across years into a relationship profile that is structurally different from the relationship profile of contractors who have not made the documentation investment.

    The structural underrating happens because the costs are visible (time spent) and the benefits are diffuse (relationship quality, dispute reduction, faster approvals across many files). Owners who are looking for direct ROI on documentation investment are looking in the wrong place. The ROI is in the second-order effects, and the second-order effects are large.

    What the documentation discipline produces internally

    The carrier-facing benefits of strong documentation discipline are significant. The internal benefits are at least as significant and are sometimes overlooked.

    The first internal benefit is operational consistency. A contractor whose team has been trained to document at a consistent standard produces consistent operational outcomes across crews and across time. The documentation discipline forces a shared understanding of what the work should look like, which produces work that consistently looks like that.

    The second internal benefit is faster training of new operators. New mitigation techs, new estimators, new project managers, new supervisors can be trained against the documented files of past jobs. The training material is built into the company’s everyday operations. Companies without documentation discipline have to invent training material from scratch, which is expensive and inconsistent.

    The third internal benefit is faster review of completed jobs. When a senior operator wants to understand what happened on a job — for training purposes, for retrospective analysis, for customer issue resolution — they can pull the file and understand the job without having to track down the people who worked it. Documented operations are reviewable operations. Undocumented operations require detective work every time someone wants to understand what happened.

    The fourth internal benefit is the substrate for AI deployment described in the AI cluster. AI tools can only operate on the captured information they have access to. Strong documentation discipline produces the captured information that makes meaningful AI deployment possible. Companies without the documentation cannot deploy AI usefully regardless of how much they spend on tools.

    The fifth internal benefit is institutional memory that survives staff turnover. When a senior operator leaves, the company loses some of their judgment regardless of how much was documented. But the documented files, standards, and decisions survive their departure. Companies with strong documentation discipline are less fragile to senior departures than companies without it.

    These internal benefits compound across years in the same way the carrier-facing benefits do. The investment in documentation is, in effect, an investment in nearly every other operational capability the company has.

    How to build the documentation discipline

    Three panels showing one problem, three options, one recommendation
    How to build the documentation discipline.

    Building documentation discipline that actually holds across a team is harder than it looks. The standards are easy to write. The consistent execution is the hard part.

    The first piece is having a clear written standard for what documentation each role is expected to produce on each job. Not a vague encouragement to document well. A specific list of artifacts, with examples of what good looks like for each. The standard has to be specific enough that an operator who is trying to follow it knows exactly what is expected.

    The second piece is training new hires against the standard from day one. Documentation is not an afterthought to teach later. It is part of the core competency of the role. New operators who learn the standard in their first weeks internalize it as part of how the work is done. New operators who learn it later experience it as a bureaucratic add-on and resist it.

    The third piece is consistent senior reinforcement. Senior operators who consistently produce strong documentation themselves and who consistently expect strong documentation from their teams produce teams that meet the standard. Senior operators who let documentation slide on their own work cannot expect the rest of the team to hold the standard. The reinforcement is cultural and ongoing, not episodic.

    The fourth piece is regular file review. Senior operators should be reviewing recently completed files on a regular cadence and providing specific feedback to the team about documentation quality. The review does not have to cover every file. It has to cover enough files that the team understands documentation quality is being watched and that feedback is regular.

    The fifth piece is integration with operational metrics. Documentation quality should be one of the metrics that the team is measured on. Not the only metric. One of them. Operators who consistently produce strong documentation should be recognized. Operators who consistently produce weak documentation should be coached or, if coaching does not work, reassigned. The integration with metrics is what holds the discipline over years.

    The sixth piece is technology that supports rather than burdens the documentation. Operations software that requires excessive clicks or that produces documentation in formats that the team cannot easily use will be worked around. Software that integrates the documentation into the natural flow of the work will be adopted. The technology choice matters, and contractors should evaluate it specifically against whether it supports or impedes documentation discipline.

    The path for contractors who do not yet have it

    For contractors whose documentation discipline is uneven, the path to building it is meaningful but not impossibly long.

    The first six months should focus on writing the standard, training the senior team against it, and establishing the review cadence. This is foundation work. It does not produce visible improvement in the carrier relationship in the short term. It produces the substrate that the longer-term work will build on.

    The next six to twelve months should focus on the line crews — mitigation techs, estimators, project managers, supervisors. The training has to be sustained, the reinforcement has to be consistent, and the feedback loops have to be tight. By the end of this period, the documentation quality of recent files should be measurably better than the baseline.

    The next twelve months should focus on the carrier-facing benefits beginning to materialize. Faster approvals on the better-documented files. Fewer disputes. Stronger audit outcomes. The team starts to feel the benefits in their daily work, which reinforces the discipline and makes it easier to maintain.

    By the end of the second year, the documentation discipline is part of the company’s operating culture. The carrier-facing benefits are visible in the relationship metrics that the contractor tracks. The internal benefits are visible in operational consistency and in the company’s ability to absorb new hires and new technology.

    By year three, the documentation discipline is the substrate for everything the company does. AI deployment becomes possible. Senior team development becomes more efficient. Carrier relationships compound in value. The investment that felt like overhead in year one is producing visible operational and financial returns.

    The cluster ends here

    The five articles in this cluster describe the carrier and TPA relationship as it actually exists in 2026. The framing of the relationship as a strategic asset rather than an operational burden. The discipline of scope that defends defensible numbers without burning the relationship. The mental model of TPA incentives that turns reactive engagement into strategic engagement. The understanding of program standing and how it is actually won. And the documentation discipline that underlies all of the above.

    Owners who internalize this body of work will operate the carrier relationship as the strategic asset it is. They will defend their numbers professionally. They will engage TPAs deliberately. They will build program standing across years. They will invest in the documentation that makes everything else easier. The compound effect across the rest of this decade will be significant.

    The Carrier & TPA Strategy cluster is closed. The remaining clusters in The Restoration Operator’s Playbook address crew and subcontractor systems and restoration financial operations. Each compounds with the others. The companies that read the full body of work and act on it will know what to do. The rest will find out later.

  • Restoration Program Standing: The Unpublished Criteria

    Restoration Program Standing: The Unpublished Criteria

    This is the fourth article in the Carrier & TPA Strategy cluster under The Restoration Operator’s Playbook. It builds on the strategic asset article, the scope discipline article, and the TPA game article.

    Email Me This Article

    Program standing is real, even though it is rarely visible

    Most carrier and TPA programs that restoration contractors participate in have a published structure. There are tiers, or panels, or preferred status designations, or some other formal indicator of where the contractor stands inside the program. Contractors are usually told what tier they are in. They are sometimes told what criteria are used to evaluate movement between tiers. They are rarely told what the tier actually means in terms of work flow, pricing flexibility, or strategic standing inside the program.

    What the published structure obscures is that program standing is more granular and more consequential than the tier system reveals. Inside any tier, there are contractors who get the best work, contractors who get the worst work, and a long middle. Contractors who get the best work do not necessarily have a different formal designation than contractors in the middle. They have a different reputation inside the program, and the reputation produces routing decisions that the formal structure does not capture.

    The contractors who understand this are competing for something different than the contractors who do not. The first group is competing for reputation that produces work flow. The second group is competing for the formal designations that the published structure offers. The two competitions overlap but are not identical, and the first competition matters more.

    This article is about how program standing actually works, what the unpublished criteria really are, and what contractors should be doing across years to build the standing that determines the volume and quality of work they receive.

    What the published criteria capture

    The published criteria for most carrier and TPA programs include a recognizable set of metrics. Cycle time. Customer satisfaction scores. Quality audit results. Compliance with documentation requirements. Adherence to pricing guidelines. Dispute and complaint frequency. Some programs include additional metrics like financial stability, insurance coverage, geographic capacity, and certification status.

    These metrics are real. Contractors who consistently miss them will lose program standing, sometimes lose program access entirely. Contractors who consistently hit them maintain their formal status and avoid the worst program decisions.

    The published metrics are also incomplete. They capture what is easy to measure and defensible to publish. They do not capture what actually drives the program decisions that determine whether a contractor gets the best work in their market or the work that other contractors did not want.

    The relationship between the published metrics and the work flow is, in most programs, weaker than the published structure suggests. A contractor who is at the top of the published metrics may still be in the middle of the work flow. A contractor who is at the middle of the published metrics may still be at the top of the work flow. The published metrics are necessary but not sufficient.

    What the unpublished criteria actually are

    Three cards for field SOPs, owner prompts, and KPI rhythm in an operations kit
    What the unpublished criteria actually are.

    The unpublished criteria that drive routing decisions inside programs are usually some version of the following.

    The first is the contractor’s track record on complex jobs. Carriers and TPAs route the easy work to whoever has capacity, but they route the complex work — the high-value losses, the difficult customers, the politically sensitive files — to contractors who have demonstrated they can handle complexity. The track record on complex jobs is not captured in the standard metrics. It lives in the institutional memory of the program managers and senior adjusters who make routing decisions. Contractors who have built this track record over years receive the work that less-proven contractors do not.

    The second is the contractor’s reputation for handling difficult customers. Some homeowners are harder than others — high expectations, communication challenges, contentious histories with insurers, complicated personal circumstances. Contractors who handle these customers well, without producing complaints back to the carrier, accumulate reputation that produces continued referrals of difficult customers. Contractors who produce complaints when handling difficult customers stop receiving them.

    The third is the contractor’s responsiveness in moments that matter. The carrier’s emergency dispatch on a Saturday night. The TPA’s request for a clarification at the end of a quarter. The adjuster’s question that came in at four pm on Friday. Contractors who respond promptly and well in these moments build a reservoir of goodwill that pays back in routing decisions. Contractors who respond slowly or not at all in these moments build the opposite.

    The fourth is the contractor’s behavior when they make a mistake. Every contractor makes mistakes. The contractors who handle their mistakes well — owning the issue, addressing it directly, communicating proactively, ensuring it does not repeat — preserve relationships even when the underlying mistake was significant. The contractors who deflect, blame, or hide mistakes damage relationships even when the underlying mistake was modest.

    The fifth is the contractor’s strategic engagement with the program. Programs that the contractor participates in actively — through advisory groups, beta testing, feedback channels, or informal relationships with program leadership — receive engagement back in the form of preferential routing, advance information about program changes, and consideration when program structures are revised. Contractors who engage transactionally with the program receive transactional treatment in return.

    The sixth is the contractor’s geographic and capability fit for the program’s needs. Programs need certain kinds of contractors in certain markets at certain times. A contractor who fits a current program need — capacity in a market that is short, capability in a vertical that is growing, presence in a geography the program is expanding — gets routing favoritism that has nothing to do with the contractor’s quality and everything to do with the program’s needs at the moment.

    None of these criteria appear in the published structure. All of them shape the routing decisions that determine the contractor’s actual work flow.

    What it takes to win standing across years

    Three panels showing one problem, three options, one recommendation
    What it takes to win standing across years.

    Program standing built well is built across years through sustained behavior, not through any single intervention. Contractors who try to short-cut the process — through gifts to adjusters, aggressive lobbying, or one-time pushes for tier upgrades — usually fail and sometimes damage the relationships they were trying to improve.

    The behaviors that build program standing across years are the same behaviors that produce operational excellence in the rest of the company’s work. Reliable cycle times. Strong documentation. Defensible scope. Customer satisfaction. Professional communication. Discipline in managing the small things that aggregate into the large things.

    The companies that have built strong program standing in any given carrier or TPA usually have several years of consistent operational excellence behind them. The standing is the visible result of the underlying operational discipline. Companies that try to build standing without the underlying discipline cannot sustain the appearance long enough to produce the standing.

    The companies that have built strong standing also tend to have specific senior team members who own the relationship. Not as a part-time responsibility for a busy operations leader. As an explicit role for someone whose calendar reflects the commitment. The owner of the carrier relationship engages program managers regularly, surfaces issues proactively, brings opportunities to the program’s attention, and serves as the institutional point of contact that the program can rely on. This role is often invisible from the outside but is consistently present in companies with strong standing.

    The companies that have built strong standing also tend to have invested in being useful to the program in ways that exceed the contractor relationship. They participate in pilot programs the carrier is testing. They provide feedback on guideline changes the carrier is considering. They share data when the carrier is studying patterns. They make themselves useful as institutional partners rather than just as production capacity. Programs reward this kind of engagement over years.

    The signals that standing is changing

    Program standing changes gradually, in directions that contractors can usually detect if they pay attention. The signals of improving or deteriorating standing are visible in the work flow before they show up in any formal program decision.

    Improving standing manifests as routing of more complex jobs, more high-value losses, more politically sensitive files, more emergency assignments. The contractor starts seeing work that previously would have gone to other contractors in the market. The adjusters start engaging the contractor on questions and judgments rather than just on file processing. The program manager starts including the contractor in conversations about program direction.

    Deteriorating standing manifests as routing of easier jobs, lower-value losses, more remote files, fewer emergency assignments. The contractor starts seeing work that has the feel of being routed because no one else wanted it. The adjusters become more transactional in their interactions. The program manager becomes harder to reach. Routine requests start taking longer to answer.

    Most contractors notice these signals only when the deterioration has become severe. Contractors who are paying attention notice them earlier and can address the underlying causes before the standing damage becomes structural. The earlier the intervention, the easier the recovery.

    The intervention usually begins with an honest conversation between the contractor’s senior leadership and the program manager. The conversation is not defensive. It is exploratory. What is the program seeing in our recent work that has changed the routing pattern? What can we address? What feedback would help us recalibrate? Program managers usually respond well to this kind of inquiry and are often willing to share information that helps the contractor course-correct.

    The conversation is often uncomfortable. The information shared is sometimes pointed. Contractors who can absorb the feedback constructively, address the underlying issues, and demonstrate change over the following quarter usually recover their standing. Contractors who become defensive when the feedback is shared usually accelerate the deterioration.

    The strategic value of standing

    For contractors who have built strong program standing, the standing represents a strategic asset whose value is meaningful in any given quarter and significant across years.

    The asset includes a more predictable revenue stream than competitors who are not in the same standing. Work routed by the program flows in regularly, allowing the contractor to plan capacity, hire ahead of demand, and invest in the operating system without the cash flow uncertainty that contractors without standing have to manage.

    The asset includes pricing flexibility. Programs that trust the contractor are willing to approve scope items and pricing structures that less-trusted contractors would have to fight for. The pricing flexibility is not large per item but is meaningful across thousands of files per year.

    The asset includes access to the most desirable work in the market. The complex jobs, the high-value losses, the politically sensitive files. These jobs are usually the most profitable per file and the most professionally interesting for the senior team. Contractors with strong standing get more of them.

    The asset includes resilience against program changes. When carriers restructure programs, change pricing, or tighten guidelines, contractors with strong standing are usually consulted in advance, given time to adapt, and given input into the changes. Contractors without strong standing find out about changes after they are imposed.

    The asset includes a competitive moat. Other contractors in the same market cannot easily replicate the standing. The years of operational excellence and relationship investment that produced the standing in the first place cannot be compressed into a quarter. New entrants and weaker competitors are structurally disadvantaged in any market where the contractor has built strong standing.

    None of this is captured in the published program structure. All of it is the operational reality of what strong program standing actually produces.

    What this means for owners

    If you run a restoration company that does meaningful program work, the practical implication of this article is that program standing is built deliberately or it drifts unintentionally. The behaviors that build it are the operational disciplines this playbook describes throughout. The investments that maintain it are the relationship investments described in this cluster. The owner who treats program standing as an outcome of doing the underlying work well will build standing that compounds. The owner who treats it as a separate marketing or relationship project will struggle to make progress.

    The starting point is to know where the company actually stands in each program it participates in. Not the published designation. The actual routing pattern, the actual quality of work being received, the actual depth of the relationship with program leadership. This honest assessment is uncomfortable for most companies because it surfaces standings that are weaker than the published designation suggests.

    The medium-term work is to invest in the behaviors and relationships that build standing across years. This is not a quarterly initiative. It is a multi-year orientation that has to be built into how the company operates.

    The long-term result is a portfolio of program standings that produce predictable, high-quality work flow and that constitute a meaningful strategic asset of the business. The companies that have built this asset are quiet about it. The owners who recognize it as an asset and invest in it deliberately will, in five years, be operating with a significant advantage over competitors who continued to treat program standing as something that happens automatically based on the published criteria.

    Next and final in this cluster: the documentation layer that makes every carrier conversation easier, and how investments in documentation produce returns that compound across the entire carrier relationship for years.

    Related: How Claude Cowork Can Train Every Role on a Restoration Team — estimators, PMs, admins, technicians, and sales managers each learn different project management skills.

    The Missed Line Items Pack — $19

    Program standing turns on pricing-guideline adherence and defensible scope. The Missed Line Items Pack is the checklist of the Xactimate items that most often separate a defensible file from a flagged one.

    Get the Pack — $19
  • Restoration TPA Incentives: What They Actually Optimize For

    Restoration TPA Incentives: What They Actually Optimize For

    This is the third article in the Carrier & TPA Strategy cluster under The Restoration Operator’s Playbook. It builds on the strategic asset article and the scope discipline article.

    Email Me This Article

    Most contractors do not understand what TPAs actually do

    Restoration contractors interact with third-party administrators every day. They submit files through TPA platforms. They follow TPA guidelines on scope and pricing. They receive work assignments from TPA programs. They deal with TPA quality reviews and program management decisions. The TPA is, for many contractors, a constant operational presence that shapes a meaningful portion of their working day.

    What most contractors do not have is a clear mental model of what the TPA is actually optimizing for, what the TPA’s relationship with the carrier looks like from the inside, what kinds of contractor behavior the TPA rewards and punishes, and how those incentives shape the TPA’s decisions about programs, panels, and individual contractor placements. Without this mental model, contractors react to TPA decisions without being able to predict or shape them, which puts the contractor in a perpetually defensive posture.

    This article is about building that mental model. Not as a critique of TPAs, who are largely doing legitimate work in a complex business, but as a strategic tool for contractors who want to operate the relationship deliberately rather than reactively. Contractors who understand what the TPA is doing and why can position themselves to be the contractors the TPA most wants to work with. Contractors who do not understand it are at the mercy of decisions they cannot anticipate.

    What the TPA actually sells

    Side-by-side comparing a pitch dump with value-first contact habits
    What the TPA actually sells.

    To understand what the TPA optimizes for, start with what the TPA actually sells to the carrier. The TPA is not selling claim adjustment. The carrier already has internal claim adjusters. The TPA is selling something more specific.

    The TPA is selling the management of a contractor network at scale. The carrier needs work done in markets across the country, on losses of varying complexity, by contractors of varying capability. Managing this directly requires the carrier to maintain contractor relationships, vet new contractors, monitor performance, handle disputes, and address the operational headaches that come with thousands of contractor interactions per year. The TPA takes this complexity off the carrier’s plate. The carrier pays the TPA to make the contractor problem invisible.

    The TPA is also selling consistency. The carrier wants to know that work done in Houston meets the same standards as work done in Hartford, that scope decisions follow the same logic across programs, that documentation arrives in the same format, that quality outcomes are predictable across markets. The TPA produces consistency by imposing uniform processes across the contractor network. The contractors experience the uniformity as bureaucratic constraint. The carrier experiences it as risk management.

    The TPA is selling cycle time control. The carrier wants files to close in defensible time. The TPA produces cycle time control through service-level agreements with contractors, through process automation that pushes files along, and through escalation mechanisms that surface delays before they become customer complaints. Contractors who hit the cycle time benchmarks make the TPA look good to the carrier. Contractors who miss the benchmarks make the TPA look bad.

    The TPA is selling cost containment. Carriers measure their TPAs in part by the average claim cost on TPA-managed files compared to internally managed files. TPAs that consistently produce lower average costs are valuable to the carrier. The cost pressure flows down to the contractor through pricing guidelines, scope review processes, and program structures that incentivize tighter scopes.

    The TPA is also selling defensibility. Files closed through the TPA need to survive subsequent scrutiny — by carrier auditors, by state regulators, by reopening claims, by litigation. Files that include the right documentation, follow the right processes, and resolve cleanly are defensible. Files that have weak documentation, irregular processes, or lingering disputes are not. TPAs reward contractors who produce defensible files and punish contractors who do not.

    None of these things are mysterious or sinister. All of them shape what the TPA cares about and how the TPA evaluates contractors. Contractors who understand the value the TPA is selling can position themselves to deliver that value, which positions the contractor to receive favorable treatment in return.

    What the TPA’s incentive structure produces

    The TPA’s incentive structure, when understood clearly, predicts most of the TPA decisions that contractors otherwise find inexplicable.

    The TPA’s preference for low-friction contractors is not personal. The TPA is being measured on cycle time, dispute rate, and customer satisfaction. Contractors who produce friction in any of these areas hurt the TPA’s metrics. The TPA naturally gravitates toward contractors who do not create friction, even when the friction-prone contractor is technically more skilled. This is why contractors who fight every scope reduction get squeezed out even when their underlying work is good.

    The TPA’s preference for documentation-disciplined contractors is also not personal. The TPA is being measured on file defensibility. Contractors who produce thin documentation create files that are vulnerable to subsequent challenge, which puts the TPA at risk. The TPA naturally favors contractors whose files always read well, even when the underlying scope might be slightly higher than what a less-disciplined contractor would have written.

    The TPA’s preference for cost-disciplined contractors is partly about the cost containment metric and partly about the predictability the TPA needs. Contractors whose pricing falls within expected ranges are easier for the TPA to manage. Contractors whose pricing varies unpredictably create work for the TPA’s review processes. The TPA favors contractors whose pricing is consistent and defensible over contractors whose pricing fluctuates regardless of justification.

    The TPA’s preference for cooperative contractors reflects all of the above and adds an additional dimension. The TPA needs contractors who participate constructively in the TPA’s processes, who provide feedback through proper channels, who respond promptly to TPA inquiries, and who treat TPA staff professionally. Contractors who treat the TPA as an adversary make every interaction harder than it needs to be, which over time produces program decisions that the contractor will find unfavorable.

    Conversely, the TPA’s lack of patience for certain contractor behaviors reflects what those behaviors do to the TPA’s metrics. Contractors who supplement late hurt cycle time. Contractors who dispute frequently hurt the dispute rate. Contractors who produce customer complaints hurt customer satisfaction. Contractors who deviate from program guidelines without explanation hurt consistency. Each of these behaviors triggers TPA responses that reflect the metric being damaged.

    What contractors should and should not negotiate with the TPA

    Understanding the TPA’s incentive structure also clarifies which kinds of negotiations are productive and which are not.

    Negotiations about specific scope items on specific files are usually productive when the contractor has the documentation to support their position and approaches the conversation in the disciplined way described in the scope discipline article. The TPA’s adjuster has discretion at the file level and can move on items where the contractor has made a defensible case.

    Negotiations about the TPA’s published guidelines are usually unproductive at the file level. Adjusters cannot change the guidelines on individual files. Contractors who push for guideline-level changes through file-level disputes frustrate adjusters and damage relationships without producing any benefit. Guideline-level changes are made through program-level conversations, which require a different posture and a different audience.

    Negotiations about pricing are usually productive when the contractor can demonstrate that their pricing reflects legitimate market conditions or specialized capabilities. Negotiations about pricing that amount to the contractor wanting more money than the TPA’s pricing structure supports, without supporting reasoning, are usually unproductive and damage credibility.

    Negotiations about cycle time exceptions are usually productive when the contractor proactively communicates the reason for an exception in advance and provides supporting documentation. Negotiations about cycle time exceptions that arrive after the fact, without proactive communication, are usually unproductive because the metric has already been damaged.

    Negotiations about program standing are usually productive when conducted at the right level — typically the program manager rather than the file-level adjuster — with a defensible case based on performance data and a clear ask. Negotiations about program standing that are conducted as complaints rather than as proposals are usually unproductive.

    The general principle is that productive negotiations work within the TPA’s incentive structure rather than against it. Contractors who frame their requests in terms of how granting the request improves the TPA’s metrics — better cycle time, lower dispute rate, higher customer satisfaction, stronger defensibility — are speaking the TPA’s language. Contractors who frame their requests purely in terms of what they want without addressing the TPA’s incentives are speaking a language the TPA cannot easily respond to.

    The relationships inside the TPA that matter

    The TPA is not a monolith. Different roles inside the TPA have different responsibilities, different discretion, and different perspectives on the contractor relationship. Contractors who understand these distinctions can engage the right people for the right conversations.

    The file-level adjuster is the person who reviews scope, approves payments, and handles day-to-day file management. The adjuster has discretion at the file level but limited authority on program-level questions. Most of a contractor’s daily TPA interactions are at this level. Building strong relationships with the adjusters who handle the contractor’s files pays off in faster approvals, more reasonable scope discussions, and smoother file management.

    The supervisor or manager above the adjuster is the person who handles escalations, manages adjuster performance, and addresses cross-file issues. Contractors should know who supervises the adjusters they work with most frequently and should engage the supervisor when escalation is needed. Engaging the supervisor for routine file matters is inappropriate and damages the adjuster relationship.

    The program manager is the person responsible for the overall contractor program — panel composition, performance evaluation, program policy, contractor recruitment and termination. The program manager is the right audience for program-level conversations about standing, performance recognition, and structural concerns. Most contractors interact with program managers infrequently and should make those interactions count.

    The quality team or audit team conducts file reviews and pattern analysis across contractors. Contractors usually do not interact with this team directly but are affected by their findings. Contractors whose files consistently pass quality review build a reputation that supports favorable program decisions. Contractors whose files trigger quality flags build a reputation that supports unfavorable program decisions.

    The technology and operations teams build and maintain the platforms contractors use to interact with the TPA. Contractors usually do not engage these teams directly but benefit from understanding that platform problems often have specific causes that can be addressed through proper channels. Filing thoughtful platform feedback through the right mechanisms can produce changes that benefit the entire contractor network.

    The senior leadership of the TPA — the directors, vice presidents, and executives — set strategic direction and make the largest decisions about the contractor network. Most contractors do not engage at this level. Contractors who do engage at this level, when appropriate, often find that senior TPA leaders are interested in input from contractors who think strategically about the business.

    The contractor’s reputation inside the TPA

    Three panels showing one problem, three options, one recommendation
    The contractor’s reputation inside the TPA.

    Across all of these roles and across years of file-level interactions, each contractor develops a reputation inside the TPA that informs every decision the TPA makes about the contractor. The reputation is not formal. It is the accumulated impression of how the contractor operates, formed through hundreds of interactions and shared informally across the TPA’s staff.

    The reputation includes specific dimensions. Whether the contractor’s files are clean and easy to work with. Whether the contractor’s communication is professional. Whether the contractor’s cycle times are reliable. Whether the contractor’s quality outcomes are strong. Whether the contractor escalates appropriately or inappropriately. Whether the contractor’s senior leadership engages constructively when needed. Whether the contractor’s representatives at every level — estimators, project managers, supervisors, owners — represent the contractor consistently or whether the contractor’s behavior varies by who is interacting with the TPA.

    The reputation, once established, is durable. Contractors with strong reputations get the benefit of the doubt on close calls. Contractors with weak reputations get scrutiny on situations that would pass without comment for stronger contractors. Changing the reputation requires sustained behavior change over many files, and the change takes longer than the deterioration that produced the bad reputation in the first place.

    This is one of the strongest arguments for treating every TPA interaction as part of the relationship rather than as an isolated transaction. The interaction the contractor handles poorly today will inform decisions the TPA makes about the contractor for the next several years. The interaction the contractor handles well today is building credit that will pay back across many subsequent files.

    What this means for owners

    If you run a restoration company that does meaningful TPA-managed work, the practical implication of this article is that the TPA relationship is shaped by everyone on your team, not just by the senior people who think about it strategically. Estimators who handle file-level interactions, project managers who handle supplemental conversations, supervisors who handle escalations, and the owner who occasionally engages program managers all contribute to the contractor’s reputation inside the TPA.

    The training implication is that every team member who interacts with the TPA needs to understand what the TPA is optimizing for and how their interactions affect the relationship. This understanding cannot be assumed. It has to be taught explicitly, reinforced through coaching, and modeled by senior leadership.

    The strategic implication is that the contractor’s TPA reputation is a long-term asset that can be deliberately built, just like the customer relationship and the senior team. Owners who treat the TPA reputation as something to be invested in produce reputations that compound. Owners who treat the TPA as a daily friction without considering the reputational dimension produce reputations that erode.

    The TPA game is, in the end, a relationship game played at scale across many simultaneous interactions. Contractors who understand the game play it deliberately. Contractors who do not understand it play reactively, and the reactive posture is structurally weaker over time.

    Next in this cluster: program standing and how it is actually won — what the published criteria say, what the unpublished criteria really are, and what contractors should be doing across years to build the standing that determines the volume and quality of work they receive.

    The Missed Line Items Pack — $19

    TPA programs reward complete, well-documented files. The Missed Line Items Pack is the $19 checklist of the Xactimate line items that most often go missing from scope files — the details that make a file look disciplined.

    Get the Pack — $19
  • Restoration Scope Discipline: How to Defend Your Margins

    Restoration Scope Discipline: How to Defend Your Margins

    This is the second article in the Carrier & TPA Strategy cluster under The Restoration Operator’s Playbook. It builds on the strategic asset article.

    Email Me This Article

    Scope is where the relationship is tested

    Gloved hands using a pin-type moisture meter on wet drywall during inspection
    Scope is where the relationship is tested.

    Every restoration company that does insurance-funded work has the same recurring conversation with carriers and TPAs. The contractor writes a scope. The carrier reviews it. Some line items are approved. Some are reduced. Some are denied. The contractor then has to decide which reductions and denials to accept, which to push back on, and how hard to push.

    This conversation, repeated thousands of times per year across every contractor in the country, is where the carrier relationship is most often damaged or strengthened. The companies that have figured out how to run this conversation well defend their numbers without burning the relationship. The companies that have not figured it out either cave too easily and erode their margins, or push too hard and erode the relationship. Both outcomes are expensive. The middle path — defending defensible numbers while preserving the relationship — is where the discipline lies.

    This article is about what scope discipline actually looks like in practice. Not the philosophy of pricing, which is well-covered elsewhere. The specific operational practices that produce defensible scope, the conversational discipline that produces productive disputes, and the documentation discipline that prevents most disputes from happening at all.

    The two failure modes

    Most restoration companies fail at scope discipline in one of two characteristic ways.

    The first failure mode is over-acceptance. The contractor writes a scope, the carrier pushes back on items, the contractor accepts the reductions to keep the file moving and to avoid the friction of negotiation. Over time, the contractor’s scopes get smaller as estimators learn what the carrier will accept and stop including items that they expect to be reduced. The scope shrinks to fit the carrier’s expectations rather than to fit the loss’s actual conditions. The margin shrinks correspondingly. The contractor has been quietly self-selecting into a lower-margin operating mode without making an explicit decision to do so.

    The over-acceptance failure mode is invisible quarter to quarter and devastating across years. The contractor does not feel the loss in any single moment. The cumulative effect is a margin profile that has drifted twenty or thirty percent below where it should be, with the contractor unsure how the drift happened. The carrier, meanwhile, has gotten used to scope numbers that fit their internal targets and has stopped offering pushback because the contractor has stopped pushing.

    The second failure mode is over-resistance. The contractor writes a scope, the carrier pushes back on items, the contractor digs in on every item and turns each scope conversation into a multi-week negotiation. Over time, the contractor’s reputation with the carrier becomes that of a difficult contractor whose files always require extra effort. Adjusters start avoiding referring work to the contractor. Program managers start downgrading the contractor’s standing. The contractor’s revenue from this carrier shrinks even as the contractor’s margin per file holds.

    The over-resistance failure mode is also invisible in the short term and devastating across years. The contractor feels good about defending their numbers. The cumulative effect is a relationship that has eroded to the point that the contractor is being squeezed out of work that they should be getting. By the time the contractor notices, the relationship may be too damaged to repair without significant remediation work.

    The discipline is to operate between these two failure modes — defending the scope items that genuinely warrant defense while accepting the reductions that genuinely do not, and doing both in a way that the carrier experiences as professional rather than combative.

    What defensible scope actually looks like

    Five-step flow from estimate to supplement, approve, invoice, cash
    What defensible scope actually looks like.

    The first piece of scope discipline is writing scope that is genuinely defensible. Not maximum scope. Defensible scope. The two are different.

    Defensible scope reflects the actual conditions of the loss as documented by the file. Every line item is supported by something in the documentation — a photo, a moisture reading, a condition note, a measurement. An estimator who writes a line item that is not clearly supported by the file is creating a scope dispute that they will lose, because the carrier will identify the unsupported item and reduce it.

    Defensible scope reflects accurate measurement and quantity. The wall area is measured, not estimated. The flooring quantity reflects the actual room dimensions plus reasonable waste, not a round number that the estimator picked because it sounded right. The trim linear footage matches the actual trim being replaced. Estimators who guess at measurements lose disputes about measurements they could have won by measuring properly.

    Defensible scope reflects appropriate pricing for the work being done. Pricing that exceeds the local market average without justification will be reduced. Pricing that includes labor at rates the carrier does not recognize will be challenged. Pricing that uses the wrong material grade for the conditions will be questioned. Estimators who price aggressively without supporting reasoning create disputes that they will partially lose.

    Defensible scope reflects the carrier’s published guidelines where those guidelines exist. Most carriers and TPAs publish guidelines about how certain types of items should be scoped, how certain conditions should be priced, and how certain decisions should be documented. Estimators who scope outside the guidelines without acknowledging them invite reductions. Estimators who scope inside the guidelines or who scope outside them with explicit, documented reasoning maintain credibility.

    Defensible scope acknowledges the limits of the file’s documentation. When the file’s documentation does not support a particular item, the responsible move is either to gather better documentation before writing the scope, or to write the scope without the unsupported item and supplement later when conditions are revealed. Estimators who include items in the original scope that the documentation does not support are setting up disputes they will lose and damaging their credibility for the items they could have defended.

    Defensible scope, in short, is scope that has been written with the carrier’s review process in mind. The estimator is not writing for themselves. They are writing for the adjuster who will review the scope. A scope that the adjuster can approve cleanly is a defensible scope. A scope that requires the adjuster to do detective work or that contains items the adjuster will obviously reduce is not defensible regardless of what the contractor would prefer.

    The conversational discipline of scope disputes

    Even with defensible scope, some disputes will happen. The carrier will reduce items the contractor believes are warranted. The contractor will push back. The conversation that follows determines whether the dispute resolves productively or damages the relationship.

    The first principle of the conversation is to acknowledge the carrier’s reasoning before offering counter-reasoning. Disputes that begin with the contractor explaining why the carrier is wrong tend to escalate. Disputes that begin with the contractor acknowledging what the carrier was looking at, agreeing where agreement is genuine, and then offering additional context that supports the contractor’s position tend to resolve. The conversational sequence matters.

    The second principle is to ground the conversation in the file documentation. Disputes that revolve around what the contractor thinks should be true tend to go badly. Disputes that revolve around what the file documentation supports tend to resolve, because both sides can refer to the same evidence. Estimators who develop the habit of referencing specific photos, specific measurements, and specific conditions in the file are conducting more productive disputes than estimators who argue in the abstract.

    The third principle is to know which items are worth fighting for and which are not. Not every reduction warrants a dispute. Some reductions are genuinely correct. Some reductions are within the carrier’s reasonable judgment even if the contractor disagrees. Some reductions are wrong and worth fighting for. Estimators who can distinguish among these in real time are more credible to the carrier than estimators who fight every reduction with equal energy.

    The fourth principle is to escalate at the right level and time. Most scope disputes should be resolved between the estimator and the adjuster. When that fails, the conversation can move to the project manager and the supervisor. When that fails, it can move higher. Skipping levels or escalating prematurely damages the relationship at every level it touches. Estimators who handle their disputes at their level and escalate only when necessary build a reputation that pays back across many subsequent files.

    The fifth principle is to walk away from disputes that are not winnable. Some disputes the contractor will lose regardless of how well they argue. Continuing to push past the point of clear resolution damages the relationship without producing any benefit. Estimators who recognize lost disputes and gracefully accept the outcome preserve credibility for the disputes they will win. Estimators who fight to the death on every item exhaust their credibility on items that did not warrant it.

    The sixth principle is to maintain professional tone throughout. Tone that becomes combative, condescending, or personally critical of the adjuster damages the relationship in ways that scope outcomes cannot recover. The dispute is about the file, not about the people. Estimators who keep the tone professional regardless of provocation are building something across files that the contractor will benefit from for years.

    The documentation layer that prevents disputes

    Three panels showing one problem, three options, one recommendation
    The documentation layer that prevents disputes.

    The most efficient scope discipline is the discipline that prevents disputes from happening in the first place. This is largely a documentation question, and it connects directly to the documentation work described in earlier clusters of this playbook.

    The mitigation file that arrives at the estimator’s desk should already include the documentation that will be needed to defend the rebuild scope. Photos of the existing finish profiles. Measurements of affected areas. Pre-existing condition notes. Conditions revealed during demo. Equipment placement records. The estimator who is working from a complete file writes scope that is defensible because the documentation backs it up. The estimator who is working from a thin file writes scope that is vulnerable because the supporting evidence is incomplete.

    The documentation also has to be presented in a way that the adjuster can use efficiently. A photo set that is organized by location and by audience — as discussed in the photo discipline article — is far more useful than a chronological photo dump. A measurement record that ties measurements to specific locations and conditions is far more useful than a list of numbers. A condition note that explains what was found and why it matters for the rebuild is far more useful than a brief annotation.

    The companies that have built strong documentation discipline as part of their operating system also experience meaningfully fewer scope disputes than companies that have not. The carrier sees a complete, well-organized file and approves it without significant pushback. The contractor’s effort goes into the operational work rather than into negotiation. Both sides benefit.

    This is one of several places where the operating system pieces this playbook describes interconnect. The mitigation prep standard improves the file documentation. The improved file documentation reduces scope disputes. The reduced scope disputes preserve carrier relationship quality. The relationship quality drives program standing and referral flow. The flow funds the continued investment in the operating system. The cycle compounds.

    The supplemental discipline

    Most restoration jobs produce conditions during execution that were not visible at the time of the original scope. These conditions warrant supplemental scope items. The discipline of writing supplements is its own area of scope work that deserves attention.

    The first principle of supplemental discipline is timeliness. Supplements should be written and submitted as conditions are discovered, not held until the end of the job and submitted as a batch. Carriers and TPAs strongly prefer supplements that arrive while the work is still in progress, because they can be evaluated against current conditions and approved without disrupting the close-out. Supplements that arrive at the end of the job are scrutinized more carefully and contested more often.

    The second principle is documentation. Each supplemental item should be accompanied by photos and notes that document what was discovered, when, and why it warrants additional scope. Supplements without strong documentation are routinely reduced or denied regardless of their merits.

    The third principle is honest framing. Supplements should be presented as discovered conditions that genuinely warrant additional scope, not as items that the contractor wishes had been included in the original. Supplements that read as scope creep get denied. Supplements that read as legitimate discoveries get approved.

    The fourth principle is integration with the original scope. Supplements should reference the original scope and explain how the new conditions relate to or differ from what was originally documented. Supplements that float disconnected from the original file confuse the adjuster and slow the approval.

    The fifth principle is selectivity. Not every discovered condition warrants a supplement. Some discoveries are within the contingencies that the original scope already covers. Some are minor enough that the time cost of a supplement exceeds its value. Estimators who supplement selectively and well build credibility. Estimators who supplement everything devalue their supplements.

    What this means for owners

    If you run a restoration company and your scope discipline is uneven across your team, the practical implication of this article is that the discipline is teachable and that the investment in teaching it pays back materially.

    The starting point is the senior estimator who is currently producing the most defensible scopes and the most productive dispute conversations. That person’s approach should be documented, codified, and used as the basis for training the rest of the estimating team. Not as policy. As demonstrated practice.

    The medium-term work is to build the documentation discipline that prevents most disputes from happening. The mitigation prep standard work, the photo discipline work, and the file packaging work all contribute to scope discipline downstream. Investments in the upstream documentation produce dividends in the downstream negotiation.

    The long-term work is to build a culture where scope is treated as a professional craft, not as a fight. The estimators who hold themselves to high standards, defend defensible numbers without combativeness, and build reputations with carriers as serious professionals are the estimators who will produce the best outcomes for the company across years. Building a team of estimators who all operate this way is one of the highest-leverage operational moves an owner can make in 2026.

    Scope is where the carrier relationship is tested. The companies that pass the test consistently are the companies that the carriers want more work from. The discipline is teachable. The payoff compounds.

    Next in this cluster: the TPA game — understanding what third-party administrators actually optimize for and how that understanding changes the way contractors should engage with them.

    Related: How Claude Cowork Can Train Every Role on a Restoration Team — estimators, PMs, admins, technicians, and sales managers each learn different project management skills.

    The Missed Line Items Pack — $19

    Defensible scope is written in Xactimate. The Missed Line Items Pack covers the line items most often left out of restoration scopes — and the supplement language that defends them when the dispute comes.

    Get the Pack — $19
  • Crawl Space Radon: Risks, Testing, and ASMD Mitigation

    Crawl Space Radon: Risks, Testing, and ASMD Mitigation

    The Distillery — Brew № 1 · Radon Mitigation

    Crawl space foundations and radon have an important and often misunderstood relationship. Homes built on crawl spaces face a different radon dynamic than those on slabs or full basements — but the risk is real and, in some ways, more complex to address. If you have a crawl space and have not tested for radon, this guide explains why you should, what the risk profile looks like, and what mitigation means for a crawl space home.

    Why Crawl Spaces Are Primary Radon Entry Points

    Technician using a moisture meter on drywall during inspection
    Measure the stack effect — don’t guess.

    Radon is produced continuously in soil by the decay of uranium. It migrates upward through soil gas and enters buildings wherever there is a pressure differential between the sub-foundation zone and the building interior. Crawl spaces, by their nature, are highly connected to the soil:

    • A vented crawl space has open foundation vents that communicate directly with outdoor and sub-foundation air — including radon-laden soil gas
    • The soil surface in a crawl space is typically bare earth, concrete, or a thin vapor retarder — all of which allow radon to enter the crawl space air relatively easily compared to a thick concrete slab
    • The stack effect that draws crawl space air into the home (documented at 40–60% of first-floor air in homes with vented crawl spaces) continuously pulls radon from the crawl space into the living space

    The result: crawl space homes in high-radon geological areas frequently have elevated radon levels in the first-floor living space, even if the crawl space is not directly occupied. The crawl space is a radon delivery mechanism — not just a space where radon exists.

    How Encapsulation Affects Radon

    Crawl space encapsulation has a complex and sometimes counterintuitive effect on radon:

    Encapsulation Without Radon Mitigation Can Increase Indoor Radon

    Sealing the crawl space — closing foundation vents, installing a vapor barrier, sealing the rim joist — reduces the total air volume and air exchange in the crawl space. If the crawl space is now a sealed zone that communicates with the living space through the floor above, radon that enters the sealed crawl space from the soil can accumulate to higher concentrations than it would have in a vented crawl space (where outdoor air diluted it). Some encapsulated crawl space homes show higher post-encapsulation radon levels than pre-encapsulation — precisely because the dilution effect of vented outdoor air has been removed.

    Encapsulation With ASMD Dramatically Reduces Radon

    Sub-Membrane Depressurization (ASMD) is the standard radon mitigation technique for crawl space homes. It combines the vapor barrier with a radon mitigation fan system:

    • The vapor barrier is installed across the entire crawl space floor, sealed to the foundation walls
    • A suction point is created beneath the barrier — typically a PVC pipe penetrating through or beneath the barrier with a perforated section under the membrane
    • A radon mitigation fan pulls soil gas from beneath the membrane and discharges it above the roofline through the same pipe network used for ASD systems in slab homes
    • The result: the space beneath the membrane is under slight negative pressure relative to the crawl space, preventing radon from entering the crawl space air from the soil below

    ASMD systems typically reduce crawl space radon by 70–95% — comparable to the performance of ASD systems in slab and basement homes. The EPA’s standard protocol for crawl space radon mitigation is ASMD combined with a sealed vapor barrier system.

    Testing for Radon in a Crawl Space Home

    Clipboard checklist on a restoration jobsite
    Test with a sequence, not a single weekend.

    Radon testing for crawl space homes follows the same protocol as for other foundation types — the test is placed in the lowest livable level of the home (the first floor above the crawl space, not in the crawl space itself). Key points:

    • Do not place the test device in the crawl space — you are measuring the radon in the air that occupants breathe, which is in the living space
    • Close-house conditions apply as in any radon test — all foundation vents, windows, and exterior doors closed for 12 hours before and throughout the 48-hour test period
    • For a home with an existing vented crawl space, the test under closed-house conditions (vents closed) represents the highest radon concentration — conservative and appropriate for a mitigation decision
    • If the home is in the process of being encapsulated, test post-encapsulation to confirm whether ASMD is needed

    ASMD Cost for Crawl Space Radon Mitigation

    Restoration van parked at curb on a jobsite
    Mitigation still has to fit the truck schedule.

    ASMD installation in a crawl space with an existing vapor barrier costs $800–$1,500 for a standard installation — the vapor barrier already serves as the membrane, and the suction pipe is added beneath it or integrated at installation. Installing ASMD simultaneously with a new encapsulation system adds $300–$600 to the encapsulation project cost — far less than retrofitting it after the encapsulation is complete.

    If no vapor barrier exists, ASMD requires installation of a vapor barrier before the suction system can work — the membrane is what creates the sealed zone beneath which the suction is applied. Full ASMD with new vapor barrier in a crawl space: $1,200–$3,500 depending on crawl space size and membrane quality.

    Related on Tygart Media: encapsulation process · vapor barrier installation · inspection checklist.

    Frequently Asked Questions

    Are crawl space homes at higher radon risk?

    Not necessarily higher than slab or basement homes in the same geological area — all three foundation types have radon risk in high-radon zones. But crawl space homes have a specific pathway (the direct soil-to-air connection through an open crawl space) that can be highly efficient at delivering radon to the living space via the stack effect. Testing is the only way to know, regardless of foundation type.

    Will encapsulating my crawl space reduce my radon levels?

    Not necessarily — and it may increase them if ASMD is not included. Sealing the crawl space without adding sub-membrane depressurization removes the dilution effect of outdoor air, potentially concentrating radon in the now-sealed space. Always test radon post-encapsulation. If levels increase or remain elevated, ASMD installation is the correct follow-up.

    What is sub-membrane depressurization (ASMD)?

    ASMD is the EPA-standard radon mitigation technique for crawl space homes. A sealed vapor barrier covers the entire crawl space floor; a radon fan creates negative pressure beneath the membrane, preventing radon from entering the crawl space air from the soil below. The radon-laden soil gas is drawn from beneath the membrane and discharged safely above the roofline. ASMD typically reduces crawl space home radon by 70–95%.

    Should I test for radon before or after crawl space encapsulation?

    Both. Test before encapsulation to establish baseline levels and determine whether ASMD should be included in the encapsulation project. Test after encapsulation (at least 24 hours after the system is complete and sealed) to confirm results. If the contractor is installing ASMD simultaneously with encapsulation, a single post-encapsulation test is sufficient to confirm system performance.