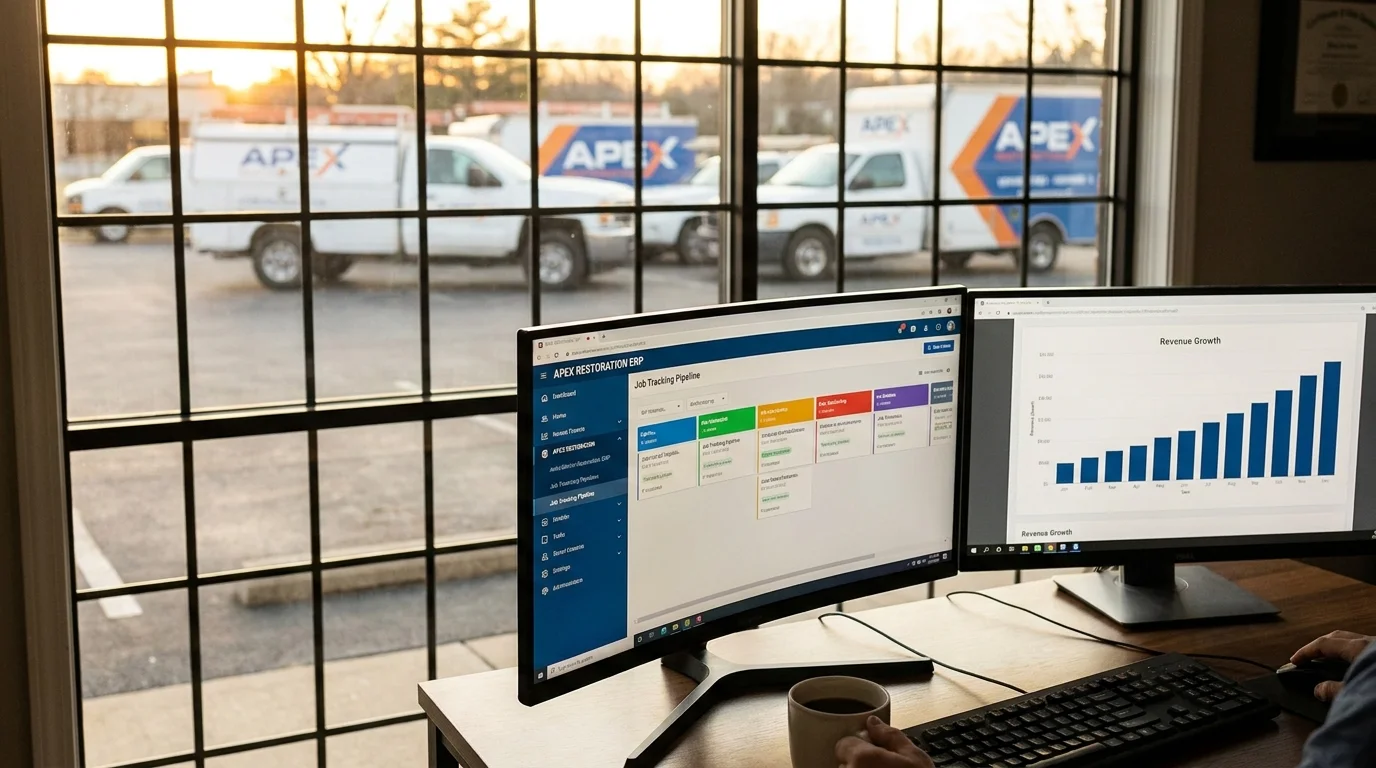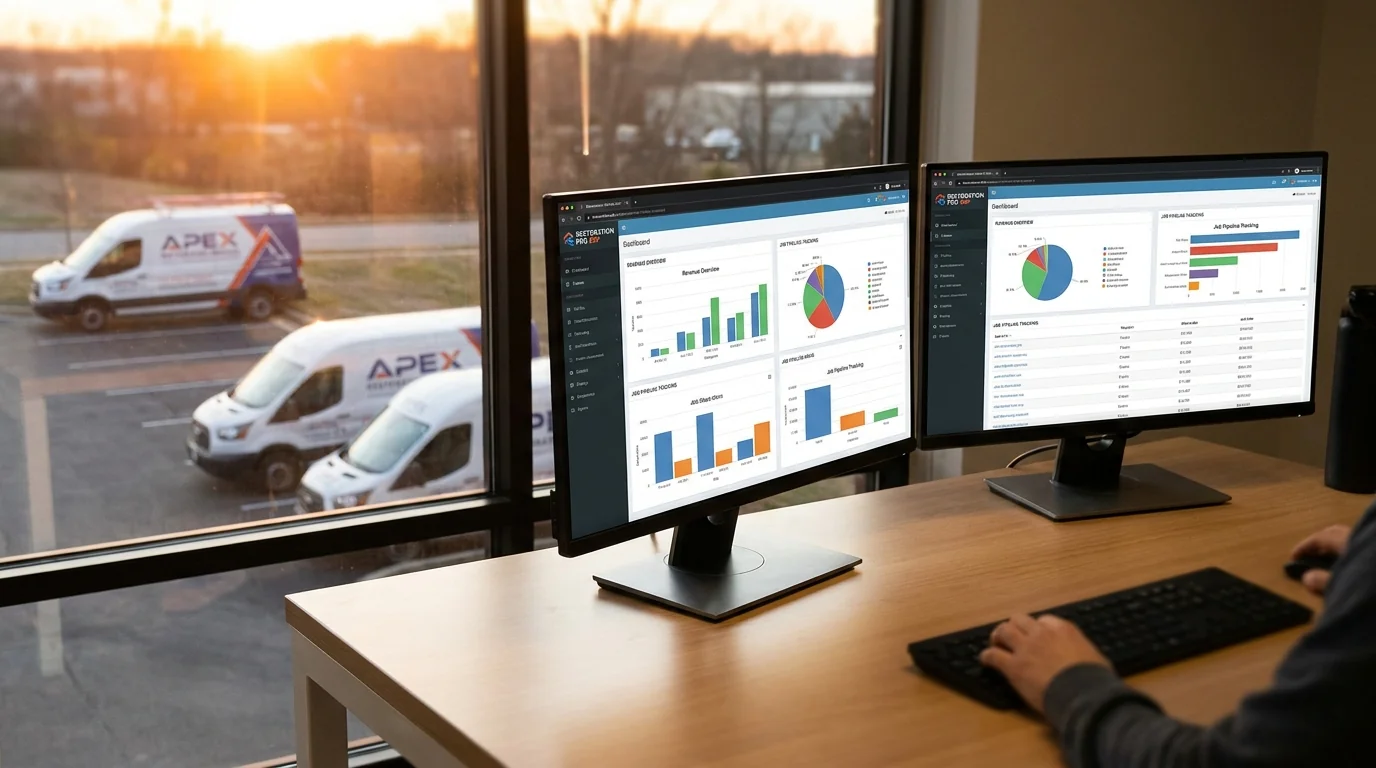
Most restoration companies don’t have a sales process. They have an owner who answers the phone, gives a verbal estimate, and hopes the customer says yes. That works until it doesn’t — usually around the $1.5M revenue line, when the owner can no longer touch every job and the company plateaus.
This is the complete restoration sales playbook for both commercial and residential. The processes, the scripts, the objections, the comp plans, the metrics, and the org structure that turn restoration sales from “the owner’s gut” into a scalable engine.
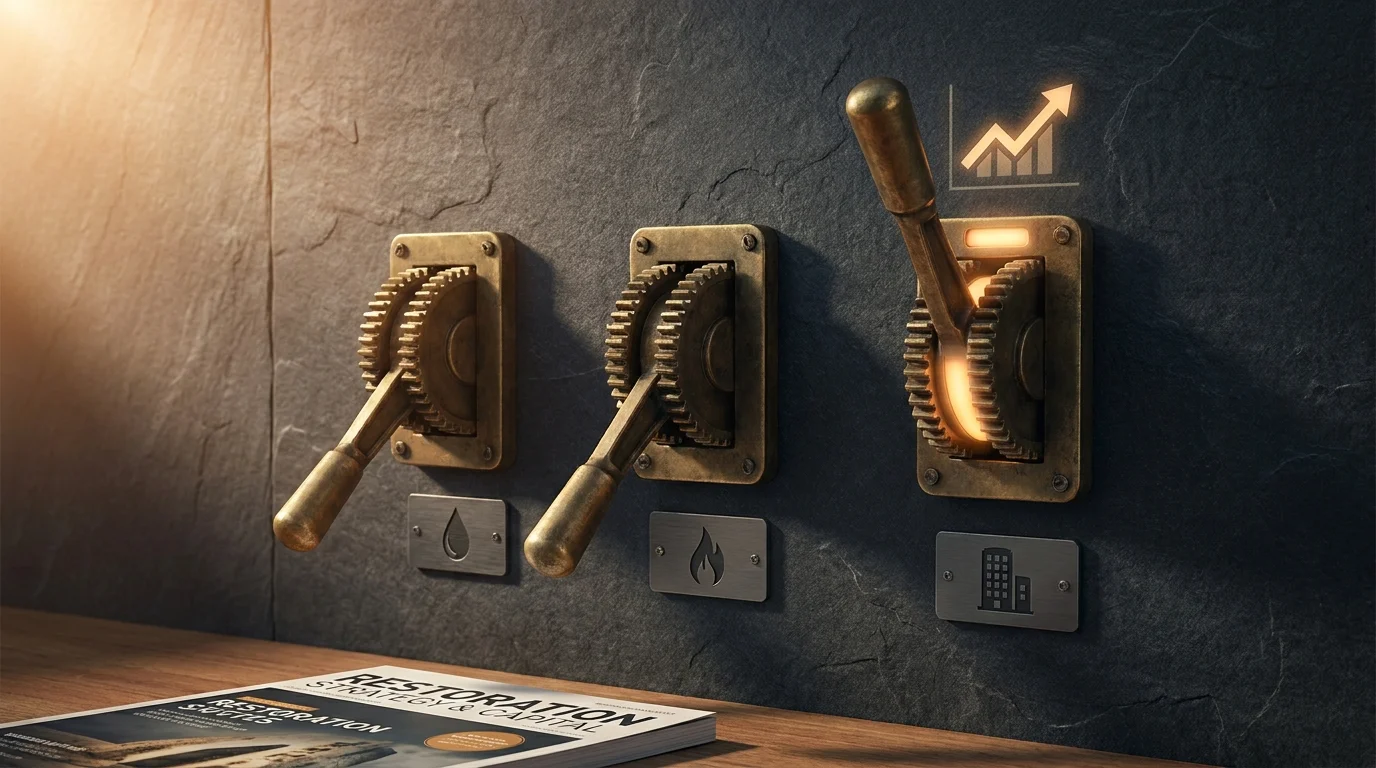
Why restoration sales is different from other home services
Three things make restoration sales unique. First, most customers don’t want to be there — water on the floor, fire damage, mold smell — and the buying experience is emotional, not transactional. Second, insurance is usually the third party in the room, which means the sale has both a customer-facing dimension and a carrier-facing scope-and-pricing dimension. Third, the urgency window is short — a homeowner with three inches of water in the basement is making a decision in the next sixty minutes, not the next sixty days. A sales process built for HVAC replacement or kitchen remodels doesn’t work in this environment.
The residential restoration sales process
The clean residential process has six steps. First, the inbound call or arrival — set the customer at ease, gather the basics, dispatch the truck. Second, the on-site walk and assessment — physically inspect the loss, document with photos and a moisture map, identify scope. Third, the trust-building conversation — explain what’s happening, what the company will do, what the timeline looks like, what the insurance process will involve. Fourth, the work authorization — get the signature on the work authorization form and the AOB (assignment of benefits) where used, with clear scope language. Fifth, the daily progress update — text or call the customer every day with what was done and what’s next. Sixth, the close-out and review request — final walkthrough, signed completion certificate, immediate ask for the Google review.
The commercial restoration sales process
Commercial is fundamentally different — longer sales cycle, multiple stakeholders, RFP and master service agreement structures. The commercial process has eight steps. First, identify and qualify the target (property managers, facility directors, REIT operations teams, healthcare facility managers, hotel chains). Second, cold outreach via email, phone, LinkedIn, or in-person drop-bys. Third, discovery meeting to understand current vendor situation, pain points, and decision criteria. Fourth, capabilities presentation — branded deck, case studies, references, certifications. Fifth, RFP response or vendor application — formal pricing schedules, COI, W-9, MSA negotiation. Sixth, onboarding and first job — usually a small loss to prove the relationship works. Seventh, account management — quarterly business reviews, scorecard tracking, expansion within the account. Eighth, renewal and reference development — turn happy commercial accounts into case studies and references for the next prospect.
The five most common restoration sales objections (and how to handle them)
“I need to call my insurance company first.” This is the most common objection on residential. The honest answer: yes, they should call insurance, but they don’t need to wait for insurance to authorize emergency mitigation. Mitigation is a duty owed by the homeowner under almost every policy, and delaying mitigation usually causes more damage and more denials, not fewer. Explain this calmly, point them to their policy language, and offer to be on the call when they reach the carrier.
“How much is this going to cost?” The wrong answer is a number. The right answer is “it depends on what we find when we open up the affected areas, but I can walk you through how Xactimate pricing works, what your policy typically covers, and what your out-of-pocket exposure is likely to be.” Rebuild trust with transparency, not with an unreliable estimate that you’ll have to retract later.
“My uncle/cousin/neighbor does this kind of work.” Don’t fight it. Acknowledge it, then differentiate: “If they’re certified IICRC and carry the right insurance, that’s great — we’re happy to be the second opinion. If you’d prefer to use them, we still recommend you start mitigation in the next few hours either way.” Sometimes you’ll lose the job. Often the customer will quietly reconsider when they realize what’s actually involved.
“Your competitor quoted me less.” The hidden answer to this objection is almost always scope, not rate. Walk through the scope item by item with the customer. Identify what’s missing in the competitor’s proposal. Explain what gets denied or supplemented later when the carrier reviews. Most price objections in restoration are scope-comparison failures, not pricing failures.
“I want to think about it.” Time is not a luxury in restoration. The honest, professional response: “I understand. The challenge is that every hour we wait, the loss usually gets worse and the carrier may push back on damage that could have been prevented. Can we start emergency mitigation now and you finalize the rest of the scope tomorrow?”
Sales rep compensation: the models that work
Three compensation structures dominate in restoration. Salary plus bonus works for inside sales reps and commercial business development, where the sales cycle is long and the rep needs predictable income. Typical structure: $60K-$90K base plus 1-3% of revenue from accounts they bring in, capped or uncapped depending on territory size. Commission-only works for outside residential sales reps in markets with high enough volume to support it. Typical structure: 5-10% of gross revenue or 10-15% of gross profit, with a draw against commission for the first 90 days. Salary plus team bonus works for production-side sales (project managers who upsell during jobs). Typical structure: production manager salary plus a small percentage of completed job revenue tied to customer satisfaction scores.
The metrics that predict restoration sales performance
Forget revenue as the primary metric — it’s a lagging indicator. The leading indicators that predict next quarter’s revenue are activity volume (calls made, meetings held, proposals sent), pipeline value (sum of qualified opportunities × probability), conversion rates by stage (lead to qualified, qualified to proposal, proposal to close), average deal size by source, and sales cycle length by deal type. A weekly pipeline review using these five metrics will tell you what’s coming three months out.
When to hire your first sales rep
Most restoration owners hire too late. The right trigger is when you can confidently answer two questions: “do I have a documented sales process I can hand to someone else?” and “do I have enough lead flow to keep a sales rep at 70%+ capacity?” If both are yes and you’re at $1.5M+ in revenue, it’s time. The first sales hire should usually be a residential closer or commercial business development rep, depending on which side of the business has the bigger growth ceiling.
Frequently Asked Questions
What does a restoration sales rep actually do?
Residential sales reps respond to inbound emergency calls, conduct on-site walks, write scopes, present pricing, secure work authorizations, and manage the customer relationship through completion. Commercial sales reps prospect property managers and facility directors, conduct discovery meetings, deliver capabilities presentations, respond to RFPs, negotiate MSAs, and manage assigned accounts long-term.
How much does a restoration sales rep make?
Residential outside sales reps in restoration typically earn $60K-$120K total compensation, depending on market, lead flow, and commission structure. Commercial business development reps with established books of business often earn $90K-$200K. New hires in their first year usually fall into the $50K-$80K range while building pipeline.
How do you sell commercial restoration services?
Commercial restoration sales is relationship-based business development, not transactional sales. The process: identify target accounts (property managers, facility directors, REITs, healthcare, hospitality), build relationships through outreach and industry events, present capabilities through branded decks and case studies, win small jobs first to prove competence, then expand to MSA-level relationships and preferred vendor status.
What is the close rate for restoration sales?
Healthy close rates by segment: residential emergency leads 40-60% from lead to job; residential planned/estimated work 25-40%; commercial RFPs 15-30%; commercial referral-based opportunities 35-55%. Companies significantly below these ranges usually have a process or speed problem, not a market problem.
Should I hire a restoration sales coach or consultant?
Restoration sales coaching has matured into a real category — there are several specialists who focus exclusively on this industry. Coaching tends to deliver the best ROI for owners who already have lead flow but are struggling with conversion, or for sales reps in their first 12-24 months who need scaffolding on process and objection handling. It’s less useful for foundational issues like lead generation or operational capacity.
How do you train a restoration sales rep?
Effective restoration sales training has four pillars: technical knowledge (water categories, drying science, restoration process, IICRC standards), insurance literacy (policy language, claims process, Xactimate basics, supplements), sales process and scripts (call handling, on-site discovery, scope presentation, objection handling, close), and ride-alongs with the owner or senior rep for the first 60-90 days before independent calls.