
Bolt a car speedometer onto a backup generator behind your shop and the needle will read zero miles per hour all winter while that engine powers every light, compressor, and heater in the building. Nobody who works around standby power uses a speedometer to judge a stationary engine — under NFPA 110 and standard electrical metering (U.S. Energy Information Administration), you read electrical load in kilowatts and energy delivered over time in kilowatt-hours. The speedometer is not broken. It is bolted onto the wrong job.
That is what standard client-side analytics — tracking scripts that run inside a visitor’s web browser — look like in 2026. Built to count people who click around slowly and linger between pages, those old dashboard gauges now flash red warnings on your highest-performing pages while completely missing the AI systems reading your site all day long.
Five Red Lights That Fired on Pages Doing Their Job
Across our own network of websites, we stopped taking dashboard alarms at face value and checked every red light against two grounded records: session recordings of real visitors and raw origin server logs — the line-by-line register your web server writes for every incoming file request, whether JavaScript runs or not. Five familiar gauges failed the inspection:
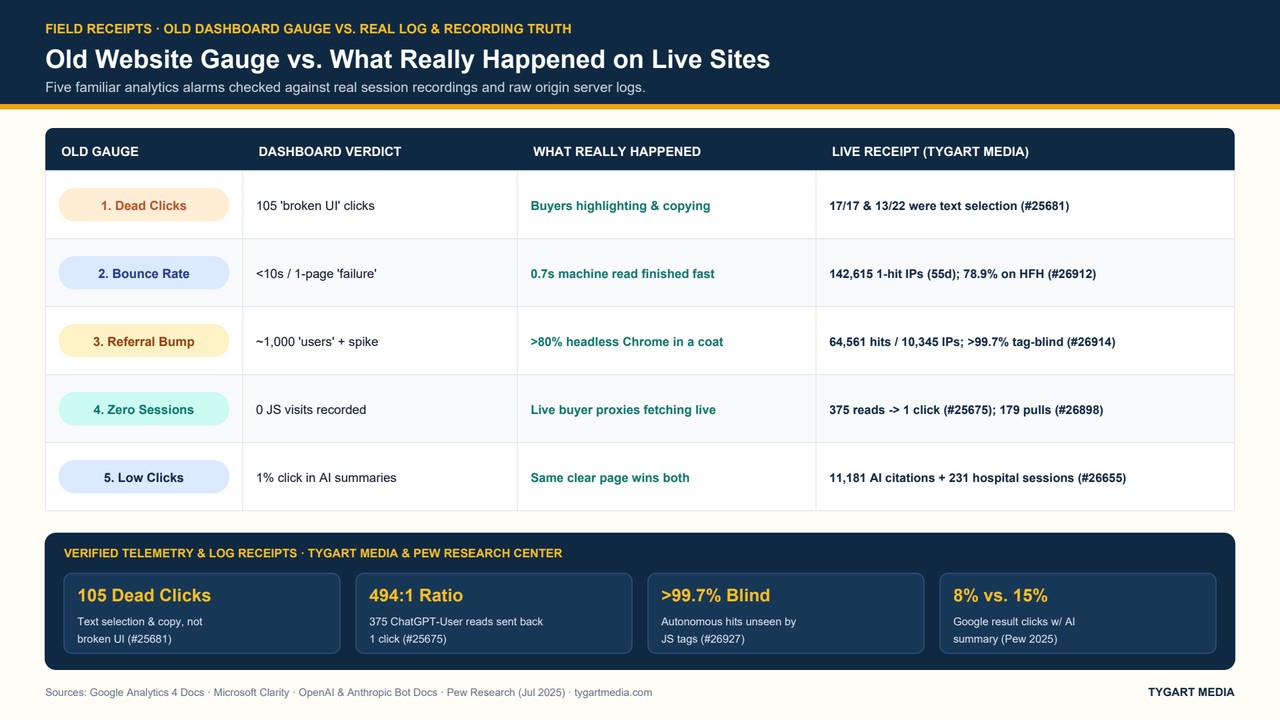
1. Dead clicks that turned out to be buyers copying the answer. In behavioral dashboards like Microsoft Clarity, dead clicks flag taps on page elements that do not open a link or button — supposedly proof of broken design. In Receipts: 105 Dead Clicks — and Why We Changed Nothing, our pricing guides drew 105 dead clicks in a single week. Watching the session recordings flipped the verdict completely: on the enterprise pricing page, one reader accounted for all 17 dead clicks across four and a half minutes by highlighting text as they read; on the team-plan limits page, 13 of 22 landed inside the top Direct Answer box as visitors copied the summary out. Only one bold callout line was mistaken for a button four times. Trusting the gauge alone would have triggered a redesign of the exact layout doing the work.
2. Bounce rate punishing half-second machine reads. Under Google Analytics 4, bounce rate is the share of sessions that are not ‘engaged’ — meaning under 10 seconds, zero key events, and one pageview. That yardstick assumes a human browsing at reading speed. In The Half-Second Internet, 55 days of server logs on tygartmedia.com recorded 142,615 single-hit IP addresses — 7,842 on November 11 alone — while Healthcare Facilities Hub logged 78.9% single-hit IPs (of 33,391) and Continuity Hub logged 55.6% (12,695 single-hit IPs). A retrieval system that fetches an answer in 0.7 seconds did not bounce in frustration. It finished the errand before a human finished the headline.
3. Referral spikes wearing a human coat. Client-side tools such as Google Analytics tagging define a ‘user’ as any browser polite enough to execute JavaScript. Today a headless browser — software driving Chrome with no screen or human hand — runs that script flawlessly. In My Analytics Said 1,000 Visitors. My Logs Said Otherwise, a dashboard reported roughly 1,000 active users and an exciting referral bump in one week, while origin logs counted 64,561 requests across 10,345 IPs — over 80% headless. Across 55 days in Not All Bots Are the Same, 1,203,889 of 2,838,206 requests (42.4%) were masked desktop scrapers, and over 99.7% of autonomous traffic never triggered a client-side script at all.
Get The Signal
What we actually ran, what it measured, and what it means for a restoration shop — every week, including the flops.
4. Zero browser sessions while live buyers send proxies. Both OpenAI’s crawler documentation (ChatGPT-User) and Anthropic’s crawler documentation (Claude-User) distinguish scheduled indexers from user-initiated agent fetches triggered live when a person asks a question. In Receipts: ChatGPT Read 375 Pages of One Site. It Sent Back 1 Visitor, ChatGPT-User walked 375 requests across Continuity Hub and sent back one referral — a 494:1 scrape-to-referral ratio (matching 408:1 and 837:1 across our wider fleet). In The Buyer Is a Bot Now, Risk Coverage Hub logged 2,065 ChatGPT-User fetches across 1,063 IPs — pulling one catastrophe-pricing guide 179 times in 55 days — without starting a single JavaScript session. That tracks broader search behavior too: a July 2025 Pew Research Center study of 68,879 Google searches found users clicked traditional links in 8% of visits when an AI summary appeared (versus 15% without), clicked a cited link inside the summary just 1% of the time, and ended their session on 26% of AI-summary pages (versus 16% without).
5. The myth that machine pages and human pages live in separate worlds. When a dashboard flags low click-through, owners often assume bots only scrape thin filler. In The Page the Machines Cite Most Is the One the Humans Actually Read, Healthcare Facility Hub earned 109,844 AI citations in 90 days, led by one hospital infection-control guide at 11,181 citations (592 of 593 citations for ‘icra meaning’). Checking human telemetry showed 231 human Clarity sessions averaging 4.4 active minutes inside a 7.8-minute visit — mostly hospital staff on desktop Edge browsers downloading the compliance field sheet mid-shift. One clear answer served both audiences at once.
Two Witnesses: Putting the Right Gauges on the Engine
You do not throw away your analytics dashboard; you stop asking a speedometer to measure kilowatt output. As we laid out in The Audience That Never Says Thanks and Standing in the Middle, honest website measurement needs two separate witnesses laid side by side — the exact same discipline we mapped in Two Papers on the Kitchen Table:
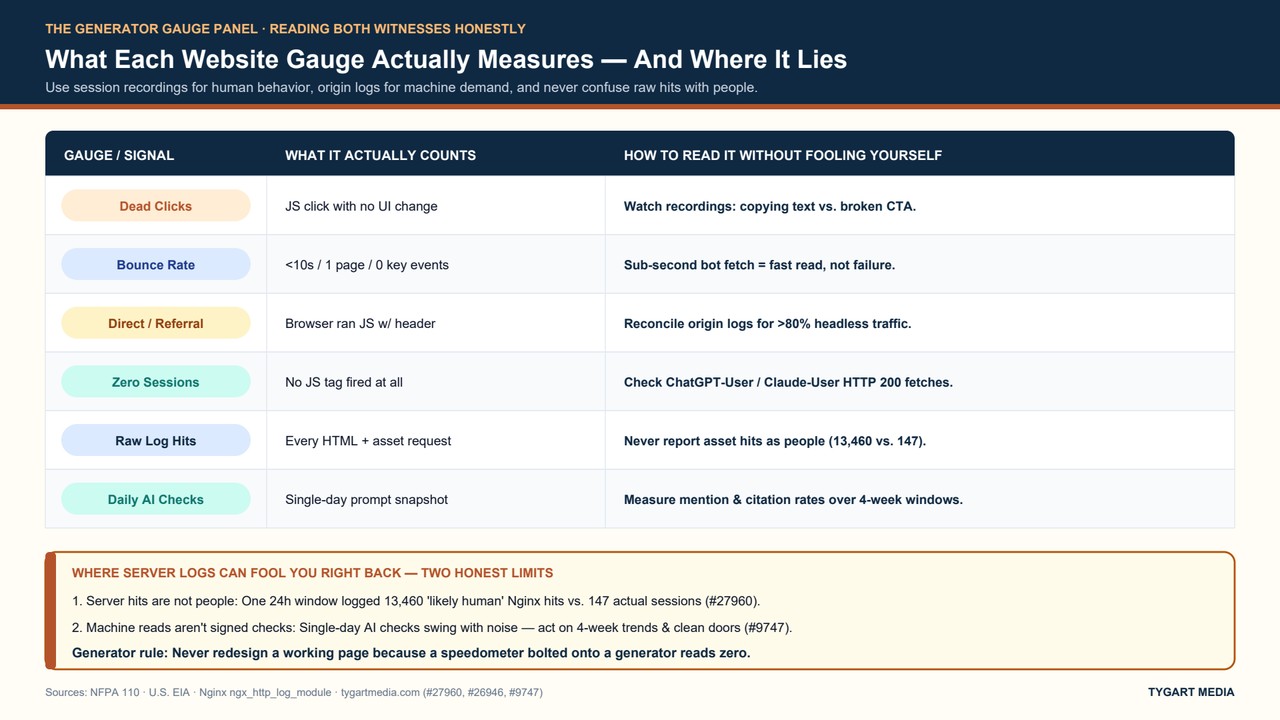
Origin server logs — built right into standard web servers via modules like Nginx’s access-log module — are your kilowatt meter for machines. Every HTTP request leaves a timestamp, URL, status code, byte count, and declared user-agent whether JavaScript runs or not, showing which live-agent fetches succeeded and which hit broken doors. Session recordings and behavioral telemetry are your inspection window for humans, proving whether a ‘dead click’ is a broken button or a buyer copying your numbers. Layered with rolling four-week citation checks (LLM Visibility Measurement), the two witnesses catch what neither one sees alone:
Where Server Logs Can Fool You Right Back
Switching gauges does not magically eliminate bad reading habits — two honest limits keep log analysis grounded. First, server hits are not people. In one ordinary 24-hour window on tygartmedia.com documented in The Audience That Never Says Thanks, Nginx placed 13,460 requests into the ‘likely human’ bucket while behavioral telemetry counted 147 actual human sessions. One reader loading three pages triggers dozens of image, font, stylesheet, and script requests. Reporting raw server hits as human readers is the oldest vanity trap on the web.
Second, a machine fetch is not a signed check. Even 179 delegated agent reads or 472 daily live-agent touches only help your business if the page delivers a clean, verifiable answer and gives the buyer a plain reason to reach out — and single-day prompt checks swing wildly with retrieval noise, so only rolling four-week trends deserve action. Just as Don’t Hire a Finish Carpenter to Carry Drywall matches the model setting to the job, match the gauge to the engine: when the logs prove crawlers are hitting dead ends or empty loops, the fix is structural mitigation first (We Come From Water Damage), not repainting a page because a speedometer read zero.
— Will Tygart, Tygart Media.
Get The Signal
What we actually ran, what it measured, and what it means for a restoration shop — every week, including the flops.
Leave a Reply