Tag: Schema Markup

  • Taxonomy as Content DNA: How Category Architecture Drives Rankings

    Taxonomy as Content DNA: How Category Architecture Drives Rankings

    Tygart Media / Content Strategy
    The Practitioner JournalField Notes
    By Will Tygart · Practitioner-grade · From the workbench

    Taxonomy Architecture: The deliberate design of a site’s category and tag classification system before content is written — treating content organization as infrastructure rather than an afterthought.

    Most WordPress sites treat categories the way most people treat junk drawers. Useful enough to have. Never really organized. Things get thrown in, labels get reused, and over time the whole system becomes a maze that nobody — human or machine — can navigate cleanly.

    This is a costly mistake, and it is invisible until you look at a site’s ranking trajectory and realize that topical authority is not accumulating anywhere.

    The sites that rank for clusters of related keywords — not just a single lucky post — almost always have one thing in common: a deliberate taxonomy architecture. Categories and tags that were designed before the first post was written. A system that treats content classification as infrastructure, not filing.

    What Taxonomy Actually Does for Search

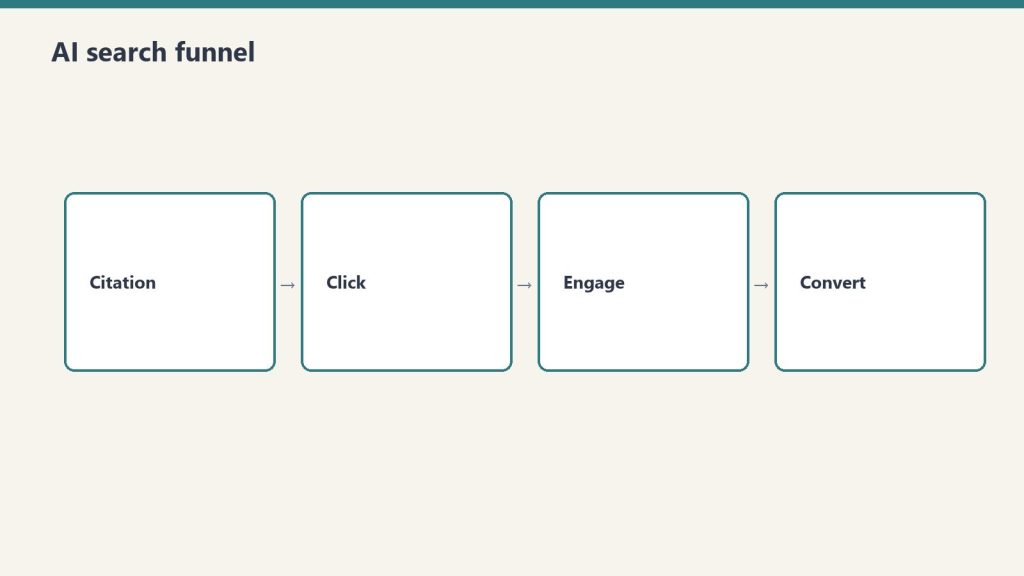
    Four-stage funnel: citation, click, engage, convert
    What taxonomy actually does for search.

    A taxonomy, in the WordPress context, is the classification system that organizes your content. Categories define the major topical areas of your site. Tags define the more granular topics, formats, audiences, and themes that cut across categories.

    From a search engine’s perspective, taxonomy does two things. First, it creates topic signals at the category level. When a category page has many posts all covering different angles of the same subject, the category becomes a topical cluster — the machine observes significant depth on this subject and attributes topical authority accordingly.

    Second, it creates semantic connectivity through tags. A tag that appears across multiple categories signals that a topic is cross-cutting — relevant to multiple contexts — and that this site covers it from multiple angles. Neither signal accumulates if the taxonomy is a junk drawer.

    The Architecture Decision That Precedes Everything

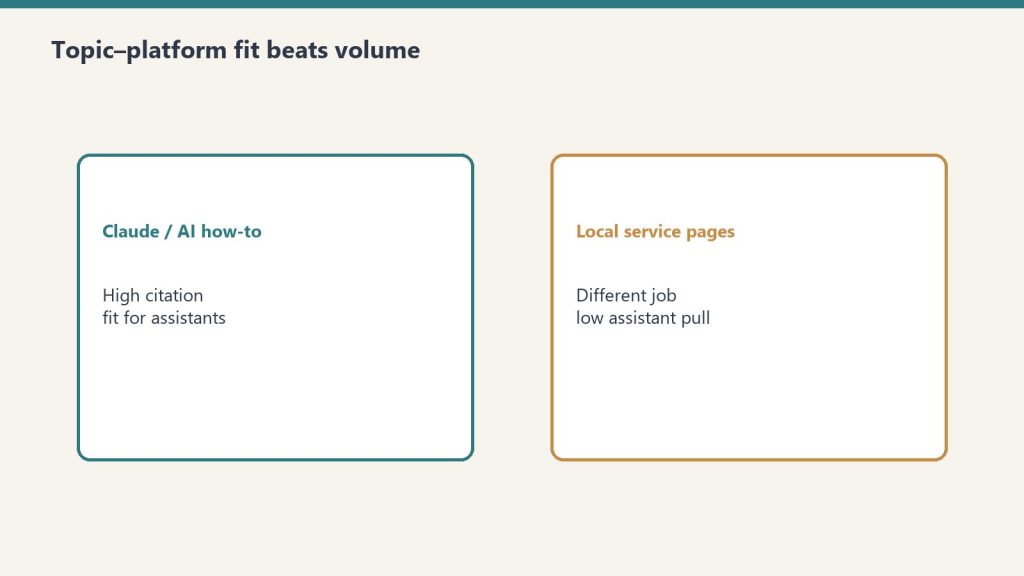
    Comparison of Claude how-to fit versus local service page fit for assistants
    The architecture decision that precedes everything.

    Good taxonomy design starts before content planning, not after it. If you plan content first and then figure out which categories to put it in, you end up with categories that reflect what you happened to write rather than categories that map to how your audience thinks about the subject.

    The correct sequence:

    Step 1: Map the Topical Territory

    What are the three to five major subject areas that this site will be authoritative on? These become your primary categories. Broad enough to contain many posts, specific enough to signal a clear topical focus.

    Step 2: Map the Sub-Topics

    Within each primary category, what are the recurring sub-topics that individual posts will address? These may become sub-categories or tags, depending on expected content volume.

    Step 3: Design the Tag Taxonomy

    Tags should serve three functions: topic modifiers (specific angles within a broad category), format signals (FAQ, guide, comparison, case study), and audience signals (who the post is for). A well-designed tag set creates a three-dimensional classification system that makes content findable from multiple directions.

    Step 4: Write Content to Fill the Architecture

    Now you write. Each post is assigned to a category and a tag set before the first word is drafted. The classification is part of the brief, not an afterthought.

    What a Healthy Taxonomy Looks Like

    A healthy taxonomy has several observable characteristics. Balance — no single category is dramatically overpopulated relative to others. Intentionality — every category has a description, not the default empty field but an editorial statement about what this category covers and who it is for. Specificity — tags are meaningful at a granular level, not just broad topic umbrellas that apply to everything on the site. Stability — the category structure does not change with every content sprint; topical signals need time to accumulate.

    The Hub-and-Spoke Model in Practice

    Desk with laptop, checklist notebook, and billing card ready before creating an Anthropic API key
    Hub-and-spoke taxonomy in practice.

    The most effective category architecture follows a hub-and-spoke model. Each category is a hub. The posts within that category are the spokes. The category archive page becomes the authoritative landing page for the entire topical cluster.

    Posts within a category link to each other where relevant. They all exist under the same category URL. When the category page earns authority — through topical depth signals, through external links, through engagement — it distributes that authority to the posts beneath it. A post that belongs to a well-populated, well-maintained category benefits from being in that category.

    Taxonomy Debt: The Hidden SEO Tax

    Sites that ignored taxonomy design accumulate taxonomy debt — a mounting structural problem that silently suppresses rankings. The symptoms: posts tagged with one-off tags that never appear more than once or twice, categories with two posts each because someone created a new one instead of using an existing one, category pages with no description and no editorial identity, tags that duplicate category names and create competing signals.

    Fixing taxonomy debt is a maintenance operation. It requires auditing the existing classification system, merging redundant tags, consolidating thin categories, writing category descriptions, and reassigning posts to their correct homes. It is unglamorous work. It also consistently produces ranking improvements because scattered topical signals suddenly consolidate.

    The Compound Effect

    Taxonomy architecture matters because it determines whether your content investment compounds or disperses. Every post you publish is a bet that the topic it covers is worth covering. If that post is correctly classified within a coherent taxonomy, it adds to the authority of its category cluster. The cluster grows stronger with each post.

    If that post is incorrectly classified — or not classified at all — it sits in isolation. It may rank on its own merit, or it may not. But it does not strengthen anything around it.

    Content infrastructure compounds. Content without infrastructure disperses.

    Build the architecture first. Then fill it.

    Related on Tygart Media: information density · SEO vs social impressions · citing sources for E-E-A-T.

    Frequently Asked Questions

    What is WordPress taxonomy and why does it matter for SEO?

    WordPress taxonomy is the classification system that organizes content through categories and tags. For SEO, a well-designed taxonomy creates topical clusters that signal authority on specific subjects to search engines, helping sites rank for clusters of related keywords rather than just individual posts.

    What is topical authority and how does taxonomy build it?

    Topical authority is the degree to which a search engine recognizes a site as a reliable, comprehensive source on a specific subject. Taxonomy builds topical authority by grouping related posts under shared category structures, allowing depth signals to accumulate at the cluster level.

    What is taxonomy debt?

    Taxonomy debt is the accumulated structural cost of neglecting content classification — one-off tags, thin categories, duplicate classification systems, missing category descriptions, and misclassified posts. Fixing it consolidates scattered topical signals and typically produces ranking improvements.

    What is the hub-and-spoke model for WordPress SEO?

    The hub-and-spoke model treats each category as a hub and the posts within it as spokes. The category archive page becomes the authoritative landing page for the topical cluster, and authority earned at the hub level distributes to individual posts within it.

    How should you design a WordPress category architecture?

    Design in four steps: map the major topical areas that become primary categories, identify recurring sub-topics for secondary classification, design a tag taxonomy covering topic modifiers and audience signals, then write content to fill the architecture. Classification should be defined before the first post is drafted.

    Related: The full infrastructure model behind this approach — Your WordPress Site Is a Database, Not a Brochure.

  • WordPress Site Database: Why It Beats a Static Brochure

    WordPress Site Database: Why It Beats a Static Brochure

    Tygart Media / Content Strategy
    The Practitioner JournalField Notes
    By Will Tygart · Practitioner-grade · From the workbench

    WordPress as a Database: Treating every WordPress post as a structured content record with queryable fields — taxonomy, schema, meta, internal links, and freshness signals — rather than a static page in a digital brochure.

    Most businesses treat their WordPress site like a brochure — something you print once, hand out, and update when the phone number changes. That mental model is costing them rankings, traffic, and revenue. The sites that win in search treat WordPress for what it actually is: a structured database of content records, each one a queryable, indexable, linkable data object.

    This distinction is not semantic. It changes everything about how you build, maintain, and scale a content operation.

    The Brochure Mindset (And Why It Fails)

    A brochure exists to describe. It has a homepage, an about page, a services page, and a contact form. It gets built once and left. Updates happen when someone complains that the address is wrong or the logo changed.

    Search engines do not care about brochures. They care about signals — freshness, depth, internal link structure, topical coverage, entity density, schema markup. A brochure has none of these things because a brochure was never designed to be read by a machine.

    The brochure mindset produces sites with a handful of published posts, no category structure, missing meta descriptions, zero internal linking, and content that was written once and never touched again. These sites rank for almost nothing, and the business owner wonders why.

    The Database Mindset (How Search Winners Think)

    When you treat your site as a database, every post is a record. Every record has fields: title, slug, excerpt, categories, tags, schema, internal links, author, publish date, last modified date. Every field matters. Every field is an opportunity to send a signal.

    A database mindset produces sites where:

    • Every post has a clean, keyword-rich slug
    • Every post has a meta description written for both humans and machines
    • Categories are not random buckets — they are a deliberate taxonomy that maps to how search engines understand topical authority
    • Tags are not afterthoughts — they are semantic connectors between related records
    • Internal links are not random — they form a hub-and-spoke architecture that concentrates authority where it matters
    • Schema markup tells machines exactly what type of content each record contains

    This is not a content strategy. This is content infrastructure.

    What Changes When You Adopt the Database Model

    Publishing Becomes Systematic, Not Creative

    You are not waiting for inspiration. You are filling gaps in a content map. Keyword research tools show you what topics exist in near-miss positions — those are content records waiting to be written. You write them, optimize them, and push them live. Repeat.

    Taxonomy Design Becomes the First Decision

    Before you write a single post, you map your category architecture. What are the major topical clusters? What are the sub-clusters? How do they relate? This is a database schema design exercise, not a content brainstorm.

    Every Post Connects to Every Relevant Post

    Orphan pages — posts with no internal links pointing to them — are database records that no one can find. The crawler hits a dead end. The reader hits a dead end. Internal linking is the JOIN statement that connects your records into a coherent knowledge graph.

    Freshness Becomes a Maintenance Operation

    A database record goes stale. You run an audit. You identify which records have not been updated in over a year, which records are missing fields, which records have thin content. You update them systematically, the same way a database administrator runs maintenance queries.

    The Practical System for Solo Operators

    You do not need a team of writers to run a database-model content operation. You need a system with four components:

    1. A Keyword Map

    Pull your target keywords, cluster them by topic, assign each cluster to a category, and identify which posts need to be written for full coverage. This is your content schema — the blueprint before anything gets built.

    2. A Publishing Pipeline

    Every article moves through the same stages: write, SEO-optimize, add structured data, assign taxonomy, add internal links, publish, verify. The pipeline is the same whether you are publishing one article or one hundred. Consistency is the point.

    3. An Audit Cadence

    Every quarter, run a site-wide audit. Identify gaps: missing meta descriptions, thin posts, posts with no internal links, categories with no description, tags that have drifted from your taxonomy design. Fix them systematically.

    4. A Freshness Protocol

    Every post over 12 months old gets reviewed. Some get minor updates. Some get full rewrites. Some get merged into stronger posts. The point is that the database never goes fully stale.

    Why This Matters More Now

    AI search systems — Google’s AI Overviews, Perplexity, and other generative search tools — are essentially running queries against the web’s content database. They are looking for well-structured, authoritative, entity-rich records that directly answer the question being asked.

    A brochure site does not get cited by AI. A database site does.

    When your posts have clean schema markup, speakable metadata, FAQ sections structured as direct answers, and authoritative entity references, you are making your records machine-readable in the way AI search systems prefer. You are not just optimizing for the ten blue links. You are building citations in a world where the search result is increasingly a synthesized answer pulled from the best-structured sources available.

    The Mental Shift That Precedes Everything

    Your WordPress site is not a place people visit. It is a dataset that machines query and humans consult.

    Every time you publish a post without a meta description, you are leaving a required field blank. Every time you publish a post with no internal links, you are inserting an orphan record into your database. Every time you ignore your taxonomy architecture, you are letting your schema drift.

    A well-maintained database compounds. Records reference each other. Authority accumulates. Coverage expands. Machines learn to trust the source.

    A brochure just sits there and ages.

    Build the database.

    Frequently Asked Questions

    What is the difference between a brochure website and a database website?

    A brochure website is static, rarely updated, and built for human readers only. A database website treats every page and post as a structured content record with fields that send signals to search engines and AI systems — including taxonomy, schema markup, meta descriptions, internal links, and freshness signals.

    Why does taxonomy matter for WordPress SEO?

    Taxonomy — your categories and tags — is the organizational architecture that tells search engines what topics your site covers and how they relate. A deliberately designed taxonomy creates topical clusters that concentrate authority around your key subjects, improving rankings across the entire cluster.

    How often should I update my WordPress content?

    Posts over 12 months old should be reviewed for freshness and accuracy. Thin posts should be expanded or merged. The goal is a site where every published record is complete, current, and connected to related content.

    What is schema markup and why does it matter?

    Schema markup is structured data in JSON-LD format that tells machines exactly what type of content a page contains. It improves how content appears in search results and increases the likelihood of being cited by AI search systems.

    What does internal linking do for SEO?

    Internal links connect your content records so search engines can understand your site architecture and distribute authority across posts. Posts with no internal links are orphans — they receive no authority from the rest of your site.

    How does treating WordPress as a database improve AI search visibility?

    AI search systems query the web looking for well-structured, authoritative content that directly answers questions. Sites with schema markup, FAQ sections, entity-rich prose, and clean taxonomy are more likely to be cited in AI-generated answers than sites with thin, unstructured content.

    Related: If this reframe resonates, the companion piece goes deeper on the quality of reach — Why SEO Impressions Beat Social Impressions Every Time.

    Visual summary

    Editorial illustration for Your Website Is a Database, Not a Brochure - Tygart Media AI-generated visual
    AI-generated editorial illustration — Vertex AI Imagen 4 Standard

    About this image. This image was generated by Google’s Vertex AI Imagen 4 model as the featured visual for Your Website Is a Database, Not a Brochure. Every image in the Tygart Media visual library is AI-generated, converted to WebP for optimal performance, and enriched with IPTC/XMP metadata for search engine discoverability.

    • Model: Vertex AI Imagen 4 Standard (imagen-4.0-generate-001)
    • Format: WebP (quality 90)
    • Aspect Ratio: 16:9
    • Metadata: IPTC/XMP injected (title, description, creator, rights, location)
    • Creator: Tygart Media — tygartmedia.com

    Part of The Studio collection — AI-generated visuals powering the Tygart Media content engine.

  • The Taxonomy Cathedral — Information Architecture

    The Taxonomy Cathedral — Information Architecture

  • From $0 to $31,000: The Upper Restoration SEO Story

    From $0 to $31,000: The Upper Restoration SEO Story

    Tygart Media / Content Strategy
    The Practitioner JournalField Notes
    By Will Tygart
    · Practitioner-grade
    · From the workbench

    The easiest way to explain what a content program actually does for a restoration company is to show one.

    Upper Restoration serves New York City and Long Island — Nassau and Suffolk counties. Competitive market, established players, the full range of water damage, fire, mold, and storm work. When we started working together, their SpyFu profile looked like most restoration contractors: effectively zero organic search presence, no meaningful keyword rankings, no measurable traffic from search.

    Today their monthly SEO value — the estimated cost to replicate their organic traffic through paid search — sits above $31,000 per month. That number is verified, tracked, and continues to move.

    This is what happened, in the order it happened, and why each step mattered.

    Step One: The Baseline Audit

    Comparison of Claude how-to fit versus local service page fit for assistants
    Step one — the baseline audit.

    Before a single article was written, we ran a complete site audit. Not a surface-level crawl — a structured inventory of every post, every page, every category and tag, every piece of metadata. What existed, what was missing, what was broken, what was thin.

    The audit answers the foundational question: what does Google currently think this site is about? In Upper Restoration’s case, the answer was: not much. Thin content, minimal taxonomy, no internal link architecture, no schema markup. The domain existed but carried no topical authority signal in any specific category.

    This is the starting line for almost every restoration contractor we work with. The audit doesn’t reveal a problem — it reveals the opportunity. A site with no established authority can build it faster than a site with entrenched wrong signals, because there’s nothing to undo.

    Step Two: Architecture Before Content

    The temptation after an audit is to start publishing immediately. The right move is to design the architecture first.

    For Upper Restoration, that meant establishing the category structure: Water Damage, Fire Restoration, Mold Remediation, Storm Damage, Commercial Restoration, Insurance Claims. Every piece of content would live inside one of these buckets. The buckets would become the topical pillars Google associates with the domain.

    It meant identifying the hub pages — one pillar article per service category, written to be the most comprehensive resource on that topic in their market. Every supporting article would link back to the relevant hub. The hubs would link out to supporting articles. The internal link graph would make the site’s topical organization explicit and navigable.

    It meant mapping the service areas: every neighborhood in New York City, every town across Nassau and Suffolk with meaningful search volume for restoration services. Each would get its own page. The geographic coverage would signal to Google exactly where this company operates and for which locations it deserves to rank.

    This work takes time before it produces any visible results. It’s also what separates a content program that compounds over time from one that generates a temporary traffic bump and then plateaus.

    Step Three: The Content Sprint

    Desk with laptop, checklist notebook, and billing card ready before creating an Anthropic API key
    Step three — the content sprint.

    With the architecture established, the content sprint began. The goal: achieve topical authority in the core service categories as quickly as possible by covering every meaningful query a restoration customer in Upper Restoration’s market might search.

    Not generic coverage — hyper-local, hyper-specific coverage. Water damage restoration in Flushing. Mold remediation in Hempstead. Fire damage cleanup in Babylon. Each piece of content targeting the specific geographic and service intersection where a real customer with a real problem would be searching.

    The volume matters for a specific reason: Google’s topical authority model rewards comprehensive coverage. A site with one excellent article about water damage restoration ranks below a site with one hundred well-structured articles about water damage restoration in every neighborhood of its service area, because the latter site demonstrates deeper expertise. The sprint isn’t about quantity for its own sake — it’s about covering the topic space completely enough that Google has no reason to prefer a competitor with thinner coverage.

    Every article was optimized before publishing: title tag, meta description, slug, heading structure, schema markup, internal links to the relevant hub page. Not as an afterthought — as part of the production process.

    Step Four: Schema and Structured Data

    Schema markup is the metadata layer that tells Google what type each piece of content is and how to categorize it. Article schema for editorial content. LocalBusiness schema on the homepage and service pages. FAQ schema on content that answers specific questions. BreadcrumbList schema to signal the site’s navigational hierarchy.

    The impact of schema is less visible than rankings but measurable in search result appearance: FAQ dropdowns, star ratings, rich snippets, knowledge panel information. These take up more real estate in search results and convert at higher rates than standard blue links, because they answer the user’s question before the click.

    More importantly, schema accelerates Google’s ability to categorize the site correctly. Without it, Google infers content type from the raw text. With it, you’re providing structured data that removes ambiguity. For a restoration contractor trying to establish authority in multiple service categories simultaneously, removing ambiguity is significant.

    Step Five: The Measurement Layer

    Four-stage funnel: citation, click, engage, convert
    Step five — the measurement layer.

    SEO without measurement is guesswork. The measurement layer for Upper Restoration runs through SpyFu for organic value tracking and DataForSEO for keyword-level ranking data across the specific locations and queries that matter.

    SpyFu’s monthly SEO value metric is the headline number — it’s what shows the overall trajectory and what makes the clearest case to a client that the program is working. But the keyword-level data underneath it tells the more granular story: which service categories are ranking, which locations are performing, which queries have moved to page one, which still have room to climb.

    The measurement layer also drives the ongoing program. When keyword data shows a cluster gaining traction, you add more content in that cluster. When a hub page is ranking but not converting, you look at the content structure and the call to action. When a service area is generating impressions but not clicks, you look at the title tag and meta description. The program is a feedback loop, not a one-time campaign.

    What $31,000 in SEO Value Actually Means

    The SpyFu number is an estimate of traffic value, not revenue. A site with $31,000 in monthly SEO value is generating organic traffic that would cost $31,000 per month to replicate through Google Ads. The actual revenue generated depends on conversion rates, average job values, close rates — variables that differ for every company.

    What the number does tell you, clearly and verifiably, is that the content program has built genuine search presence. Keywords are ranking. Pages are generating clicks. The site exists, from Google’s perspective, in a way it didn’t before.

    For Upper Restoration, that presence is geographically concentrated in exactly the markets where they operate, for exactly the services they provide, targeting exactly the search queries that produce calls. The traffic is not vanity traffic — it’s potential customers with active problems looking for someone to call.

    The program that produced this result started from $0. It required an audit, an architecture phase, a content sprint, schema implementation, and an ongoing measurement and iteration cycle. It did not require a large agency, a significant paid media budget, or anything other than a structured approach to building topical authority in a specific market.

    That’s the story. The starting line for any restoration contractor who wants to tell a similar one is a baseline audit — understanding exactly where $0 is before building toward something different.


    Tygart Media builds content programs for restoration contractors. Every engagement starts with a SpyFu and DataForSEO baseline audit of your market — so the starting line is documented and the trajectory is measurable from day one.

    {
    “@context”: “https://schema.org”,
    “@type”: “Article”,
    “headline”: “From $0 to $31,000: The Upper Restoration SEO Story”,
    “description”: “Upper Restoration went from zero search presence to $31,000 in monthly SEO value. Here is exactly what happened, in what order, and why each step mattered.”,
    “datePublished”: “2026-04-02”,
    “dateModified”: “2026-04-03”,
    “author”: {
    “@type”: “Person”,
    “name”: “Will Tygart”,
    “url”: “https://tygartmedia.com/about”
    },
    “publisher”: {
    “@type”: “Organization”,
    “name”: “Tygart Media”,
    “url”: “https://tygartmedia.com”,
    “logo”: {
    “@type”: “ImageObject”,
    “url”: “https://tygartmedia.com/wp-content/uploads/tygart-media-logo.png”
    }
    },
    “mainEntityOfPage”: {
    “@type”: “WebPage”,
    “@id”: “https://tygartmedia.com/upper-restoration-seo-case-study/”
    }
    }

    Visual summary

    Editorial illustration for From $0 to $31,000: The Upper Restoration SEO Story - Tygart Media AI-generated visual
    AI-generated editorial illustration — Vertex AI Imagen 4 Standard

    About this image. This image was generated by Google’s Vertex AI Imagen 4 model as the featured visual for From $0 to $31,000: The Upper Restoration SEO Story . Every image in the Tygart Media visual library is AI-generated, converted to WebP for optimal performance, and enriched with IPTC/XMP metadata for search engine discoverability.

    • Model: Vertex AI Imagen 4 Standard (imagen-4.0-generate-001)
    • Format: WebP (quality 90)
    • Aspect Ratio: 16:9
    • Metadata: IPTC/XMP injected (title, description, creator, rights, location)
    • Creator: Tygart Media — tygartmedia.com

    Part of The Studio collection — AI-generated visuals powering the Tygart Media content engine.

  • SEO Website Architecture: Why Your Site is a Database

    SEO Website Architecture: Why Your Site is a Database

    The Machine Room · Under the Hood

    Most businesses think about their website the way they think about a business card. You design it once, print it, hand it out. It says who you are and how to reach you. Every few years, maybe you update it.

    This mental model is why most websites don’t work.

    A website is not a brochure. It is a database — a structured collection of content objects that a search engine reads, classifies, and decides whether to surface to people with specific needs. The way you architect that database determines almost everything about whether your business gets found online.

    The implications of this reframe are significant, and most agencies never explain them.

    What Search Engines Actually Do With Your Site

    When Google crawls your website, it’s not admiring the design. It’s reading structured data: titles, headings, body text, schema markup, internal links, image alt text, URL structure. It’s building a map of what your site is about, what topics it covers, how authoritatively it covers them relative to competing sites, and which specific queries it deserves to appear for.

    A brochure website gives Google almost nothing to work with. One services page that lists everything you do. An about page. A contact form. Maybe a blog with eight posts from 2021.

    Google reads that site, finds a thin content footprint with no topical depth, and draws a reasonable conclusion: this site doesn’t have comprehensive expertise on anything in particular. It will not rank for competitive terms.

    A database website is architected differently. Every service gets its own page with its own keyword target. Every service area gets its own page. Every question a customer might have gets an answer. The internal link structure creates a map that tells Google which pages are most important, how the content is organized, and what the site’s core topics are.

    This is not a design question. It’s an architecture question.

    The JSON-First Content Model

    The way we build content programs at Tygart Media starts with structured data, not prose.

    Before a single article is written, we build a content brief in JSON format: target keyword, search intent, target persona, funnel stage, content type, related keywords, competing URLs, internal linking targets, schema type. Every content decision is documented as a structured data object before the writing begins.

    This matters for a few reasons.

    First, it forces clarity. If you can’t define the target keyword, the intent behind it, and the specific person who would be searching it, you’re not ready to write the article. Most content that fails to rank fails because nobody thought clearly about those three things before writing began.

    Second, it makes the content pipeline scalable. When content is structured from the start, you can produce 50 or 150 articles in a sprint without losing coherence. Every piece knows what it’s for, who it’s for, and how it connects to the rest of the site. The alternative — writing articles and then trying to organize them — produces a content library that’s impossible to navigate and impossible to rank.

    Third, it enables automation without sacrificing quality. The brief is the seed. Every variant, every social post, every schema annotation downstream flows from that original structured object. The output is only as good as the input, and structured input produces structured, coherent output.

    Taxonomy Is Architecture

    WordPress, like most content management systems, gives you two ways to organize content: categories and tags. Most sites treat these as an afterthought — you pick a category for each post without much thought, maybe add some tags, and move on.

    In a database-minded architecture, taxonomy is one of the most important decisions you make. Categories define the topical pillars of your site. Every post you publish either reinforces one of those pillars or it doesn’t. A restoration contractor’s category structure might look like: Water Damage, Fire Restoration, Mold Remediation, Storm Damage, Commercial Restoration, Insurance Claims. Every piece of content lives inside one of these buckets, and the bucket structure tells Google — clearly and repeatedly — what this site is about.

    Tags create the cross-cutting relationships. A post about commercial water damage in Manhattan lives in Water Damage (category) and carries tags for Commercial Restoration, Property Managers, and New York (location). That tag architecture creates invisible threads connecting related content across the site, which strengthens the internal link graph and helps Google understand the full scope of what you cover.

    Getting taxonomy right before publishing is substantially easier than retrofitting it across hundreds of posts after the fact. We’ve done both. The retrofit takes three times as long and produces half the results.

    Internal Links Are the Database’s Index

    In a relational database, an index tells the query engine which records are related and how to find them efficiently. Internal links serve the same function in a content database.

    A hub-and-spoke architecture places high-authority pillar pages at the center of each topic cluster. Every supporting article on that topic links back to the pillar. The pillar links out to the supporting articles. Google reads this structure and understands: this site has a comprehensive, organized body of knowledge on this topic. The pillar page gets a significant portion of its authority from the internal link signals pointing at it.

    Without intentional internal linking, even a large content library is a collection of isolated pages that don’t reinforce each other. Each page competes as an island. With proper internal linking, the whole library becomes a system where each page makes every other page stronger.

    This is why the order of operations matters. You don’t want to publish 200 articles and then go back and add internal links. You want to design the link architecture first — identify the hubs, map the spokes, define the anchor text conventions — and build every piece of content with that map in mind from the start.

    Schema Markup: Telling the Database What Type Each Record Is

    Every record in a database has a type. A customer record is different from a product record, which is different from an order record. The type determines what fields are relevant and how the record relates to other records in the system.

    Schema markup does this for web content. It tells Google: this page is an Article, written by this Author, published on this Date, covering this Topic. Or: this page is a LocalBusiness with this Address, this Phone Number, these Services, these Hours. Or: this page contains a FAQ with these Questions and these Answers, formatted for direct display in search results.

    Without schema, Google has to infer all of this from the raw text. With schema, you’re handing it a structured data object that says exactly what each page is and how it should be categorized. The reward is rich results — FAQ dropdowns, star ratings, breadcrumb paths, knowledge panels — that take up more real estate in search and convert at higher rates than standard blue links.

    Schema is the metadata layer of the content database. Most sites don’t have it. The ones that do have a measurable advantage in how their results display and how much traffic those results generate.

    The Practical Difference

    Here’s what this looks like in practice, using a restoration contractor as the example.

    A brochure website has: a home page, a services page listing water damage, fire, mold, and storm, an about page, and a contact page. Maybe 5 pages total. Google has almost nothing to index.

    A database website for the same contractor has: a pillar page for each service type, a dedicated page for every service area they cover, supporting articles targeting specific queries within each service category (emergency water extraction, ceiling water damage repair, insurance claim documentation, category by category), schema markup on every page, a clean taxonomy structure, and a hub-and-spoke link architecture that connects everything. Potentially 200 to 400 pages, each doing a specific job.

    The brochure site is invisible. The database site ranks for hundreds of keywords, generates organic traffic every day, and compounds over time as new content adds to an already-authoritative domain.

    The content is not the hard part. The architecture is. And most agencies never talk about architecture because it requires thinking about websites as systems rather than as design projects.

    That’s the reframe. Your website is a database. Build it like one.


    Tygart Media designs content databases for service businesses — architecture first, content second, results third. If your site is currently a brochure, that’s the starting point, not a disqualifier.

    {
    “@context”: “https://schema.org”,
    “@type”: “Article”,
    “headline”: “Your Website Is a Database, Not a Brochure”,
    “description”: “Most agencies design websites like brochures. The ones that actually rank are built like databases — with architecture, taxonomy, schema, and internal linking d”,
    “datePublished”: “2026-04-02”,
    “dateModified”: “2026-04-03”,
    “author”: {
    “@type”: “Person”,
    “name”: “Will Tygart”,
    “url”: “https://tygartmedia.com/about”
    },
    “publisher”: {
    “@type”: “Organization”,
    “name”: “Tygart Media”,
    “url”: “https://tygartmedia.com”,
    “logo”: {
    “@type”: “ImageObject”,
    “url”: “https://tygartmedia.com/wp-content/uploads/tygart-media-logo.png”
    }
    },
    “mainEntityOfPage”: {
    “@type”: “WebPage”,
    “@id”: “https://tygartmedia.com/website-is-a-database-not-a-brochure/”
    }
    }

  • AI Image Gallery Pipeline: Targeting High-CPC Keywords

    AI Image Gallery Pipeline: Targeting High-CPC Keywords

    The Lab · Tygart Media
    Experiment Nº 500 · Methodology Notes
    METHODS · OBSERVATIONS · RESULTS

    We just built something we haven’t seen anyone else do yet: an AI-powered image gallery pipeline that cross-references the most expensive keywords on Google with AI image generation to create SEO-optimized visual content at scale. Five gallery pages. Forty AI-generated images. All published in a single session. Here’s exactly how we did it — and why it matters.

    The Thesis: High-CPC Keywords Need Visual Content Too

    Everyone in SEO knows the water damage and penetration testing verticals command enormous cost-per-click values. Mesothelioma keywords hit $1,000+ CPC. Penetration testing quotes reach $659 CPC. Private jet charter keywords run $188/click. But here’s what most content marketers miss: Google Image Search captures a significant share of traffic in these verticals, and almost nobody is creating purpose-built, SEO-optimized image galleries for them.

    The opportunity is straightforward. If someone searches for “water damage restoration photos” or “private jet charter photos” or “luxury rehab center photos,” they’re either a potential customer researching a high-value purchase or a professional creating content in that vertical. Either way, they represent high-intent traffic in categories where a single click is worth $50 to $1,000+ in Google Ads.

    The Pipeline: DataForSEO + SpyFu + Imagen 4 + WordPress REST API

    We built this pipeline using four integrated systems. First, DataForSEO and SpyFu APIs provided the keyword intelligence — we queried both platforms simultaneously to cross-reference the highest CPC keywords across every vertical in Google’s index. We filtered for keywords where image galleries would be both visually compelling and commercially valuable.

    Second, Google Imagen 4 on Vertex AI generated photorealistic images for each gallery. We wrote detailed prompts specifying photography style, lighting, composition, and subject matter — then used negative prompts to suppress unwanted text and watermark artifacts that AI image generators sometimes produce. Each image was generated at high resolution and converted to WebP format at 82% quality, achieving file sizes between 34 KB and 300 KB — fast enough for Core Web Vitals while maintaining visual quality.

    Third, every image was uploaded to WordPress via the REST API with programmatic injection of alt text, captions, descriptions, and SEO-friendly filenames. No manual uploading through the WordPress admin. No drag-and-drop. Pure API automation.

    Fourth, the gallery pages themselves were built as fully optimized WordPress posts with triple JSON-LD schema (ImageGallery + FAQPage + Article), FAQ sections targeting featured snippets, AEO-optimized answer blocks, entity-rich prose for GEO visibility, and Yoast meta configuration — all constructed programmatically and published via the REST API.

    What We Published: Five Galleries Across Five Verticals

    In a single session, we published five complete image gallery pages targeting some of the most expensive keywords on Google:

    • Water Damage Restoration Photos — 8 images covering flooded rooms, burst pipes, mold growth, ceiling damage, and professional drying equipment. Surrounding keyword CPCs: $3–$47.
    • Penetration Testing Photos — 8 images of SOC environments, ethical hacker workstations, vulnerability scan reports, red team exercises, and server infrastructure. Surrounding CPCs up to $659.
    • Luxury Rehab Center Photos — 8 images of resort-style facilities, private suites, meditation gardens, gourmet kitchens, and holistic spa rooms. Surrounding CPCs: $136–$163.
    • Solar Panel Installation Photos — 8 images of rooftop arrays, installer crews, commercial solar farms, battery storage, and thermal inspections. Surrounding CPCs up to $193.
    • Private Jet Charter Photos — 8 images of aircraft at sunset, luxury cabins, glass cockpits, FBO terminals, bedroom suites, and VIP boarding. Surrounding CPCs up to $188.

    That’s 40 unique AI-generated images, 5 fully optimized gallery pages, 20 FAQ questions with schema markup, and 15 JSON-LD schema objects — all deployed to production in a single automated session.

    The Technical Stack

    For anyone who wants to replicate this, here’s the exact stack: DataForSEO API for keyword research and CPC data (keyword_suggestions/live endpoint with CPC descending sort). SpyFu API for domain-level keyword intelligence and competitive analysis. Google Vertex AI running Imagen 4 (model: imagen-4.0-generate-001) in us-central1 for image generation, authenticated via GCP service account. Python Pillow for WebP conversion at quality 82 with method 6 compression. WordPress REST API for media upload (wp/v2/media) and post creation (wp/v2/posts) with direct Basic authentication. Claude for orchestrating the entire pipeline — from keyword research through image prompt engineering, API calls, content writing, schema generation, and publishing.

    Why This Matters for SEO in 2026

    Three trends make this pipeline increasingly valuable. First, Google’s Search Generative Experience and AI Overviews are pulling more image content into search results — visual galleries with proper schema markup are more likely to appear in these enriched results. Second, image search traffic is growing as visual intent increases across all demographics. Third, AI-generated images eliminate the cost barrier that previously made niche image content uneconomical — you no longer need a photographer, models, locations, or stock photo subscriptions to create professional visual content for any vertical.

    The combination of high-CPC keyword targeting, AI image generation, and programmatic SEO optimization creates a repeatable system for capturing valuable traffic that most competitors aren’t even thinking about. The gallery pages we published today will compound in value as they index, earn backlinks from content creators looking for visual references, and capture long-tail image search queries across five of the most lucrative verticals on the internet.

    This is what happens when you stop thinking about content as articles and start thinking about it as systems.

  • Automated Image Pipeline: AI Generation & IPTC Metadata

    Automated Image Pipeline: AI Generation & IPTC Metadata

    The Lab · Tygart Media
    Experiment Nº 472 · Methodology Notes
    METHODS · OBSERVATIONS · RESULTS

    This video was generated from the original Tygart Media article using NotebookLM’s audio-to-video pipeline. The article that describes how we automate image production became the script for an AI-produced video about that automation — a recursive demonstration of the system it documents.


    Watch: Build an Automated Image Pipeline That Writes Its Own Metadata

    The Image Pipeline That Writes Its Own Metadata — Full video breakdown. Read the original article →

    What This Video Covers

    Every article needs a featured image. Every featured image needs metadata — IPTC tags, XMP data, alt text, captions, keywords. When you’re publishing 15–20 articles per week across 19 WordPress sites, manual image handling isn’t just tedious; it’s a bottleneck that guarantees inconsistency. This video walks through the exact automated pipeline we built to eliminate that bottleneck entirely.

    The video breaks down every stage of the pipeline:

    • Stage 1: AI Image Generation — Calling Vertex AI Imagen with prompts derived from the article title, SEO keywords, and target intent. No stock photography. Every image is custom-generated to match the content it represents, with style guidance baked into the prompt templates.
    • Stage 2: IPTC/XMP Metadata Injection — Using exiftool to inject structured metadata into every image: title, description, keywords, copyright, creator attribution, and caption. XMP data includes structured fields about image intent — whether it’s a featured image, thumbnail, or social asset. This is what makes images visible to Google Images, Perplexity, and every AI crawler reading IPTC data.
    • Stage 3: WebP Conversion & Optimization — Converting to WebP format (40–50% smaller than JPG), optimizing to target sizes: featured images under 200KB, thumbnails under 80KB. This runs in a Cloud Run function that scales automatically.
    • Stage 4: WordPress Upload & Association — Hitting the WordPress REST API to upload the image, assign metadata in post meta fields, and attach it as the featured image. The post ID flows through the entire pipeline end-to-end.

    Why IPTC Metadata Matters Now

    This isn’t about SEO best practices from 2019. Google Images, Perplexity, ChatGPT’s browsing mode, and every major AI crawler now read IPTC metadata to understand image context. If your images don’t carry structured metadata, they’re invisible to answer engines. The pipeline solves this at the point of creation — metadata isn’t an afterthought applied later, it’s injected the moment the image is generated.

    The results speak for themselves: within weeks of deploying the pipeline, we started ranking for image keywords we never explicitly optimized for. Google Images was picking up our IPTC-tagged images and surfacing them in searches related to the article content.

    The Economics

    The infrastructure cost is almost irrelevant: Vertex AI Imagen runs about $0.10 per image, Cloud Run stays within free tier for our volume, and storage is minimal. At 15–20 images per week, the total cost is roughly $8/month. The labor savings — eliminating manual image sourcing, editing, metadata tagging, and uploading — represent hours per week that now go to strategy and client delivery instead.

    How This Video Was Made

    The original article describing this pipeline was fed into Google NotebookLM, which analyzed the full text and generated an audio deep-dive covering the technical architecture, the metadata injection process, and the business rationale. That audio was converted to this video — making it a recursive demonstration: an AI system producing content about an AI system that produces content.

    Read the Full Article

    The video covers the architecture and results. The full article goes deeper into the technical implementation — the exact Vertex AI API calls, exiftool commands, WebP conversion parameters, and WordPress REST API patterns. If you’re building your own pipeline, start there.


    Related from Tygart Media

    Visual summary

    Ai Image Iptc Metadata WordPress
    The Image Pipeline That Writes Its Own Metadata

    About this image. This image is part of the Article Hero Images collection in the Tygart Media visual library. Every image produced by Tygart Media is AI-generated using Google Vertex AI (Imagen), converted to WebP format, and injected with full IPTC/XMP metadata before publication.

    • Format: WEBP
    • Collection: Article Hero Images
    • Pipeline: Vertex AI Imagen → WebP → IPTC/XMP → WordPress
  • Schema Markup for AI: Building a Custom JSON-LD Dossier

    Schema Markup for AI: Building a Custom JSON-LD Dossier

    The Lab · Tygart Media
    Experiment Nº 422 · Methodology Notes
    METHODS · OBSERVATIONS · RESULTS

    TL;DR: Standard schema.org markup is a business card—basic identification with name, price, and description. AI agents need a full dossier—custom JSON-LD with product specifications, competitive positioning, pricing signals, trust indicators, and entity relationships. Brands using AgentConcentrate-level structured data see 2-3x higher citation frequency from AI systems than competitors using basic markup.

    The JSON-LD Problem: Abundance Without Depth

    Every modern website uses schema.org markup. Google recommends it. Yoast includes it. Shopify auto-generates it. The result: 90% of the internet has the same shallow, templated structured data.

    A standard Product schema tells an AI system:

    {"@type": "Product", "name": "Widget X", "price": "$99", "description": "A great widget"}

    That’s it. Name, price, description. An AI reading this can extract basic facts but cannot understand why this product matters, how it compares, what specific problem it solves, or why the brand is authoritative.

    When an AI system encounters 50 competing products with identical schema depth, it cannot differentiate. It treats them all as peers. Your content gets the same weight as your competitor’s, regardless of actual quality or authority.

    This is why citation frequency is equal across competitors. Standard markup eliminates differentiation.

    AgentConcentrate: Building a Full Dossier

    AgentConcentrate is a methodology for creating custom, high-density JSON-LD structured data that goes far beyond standard schema.org.

    A complete AgentConcentrate dossier includes:

    Specification Layer: Not just “description.” Technical specifications, dimensions, materials, compatibility matrices, performance benchmarks. Everything an AI agent needs to answer detailed questions about your product without leaving your site.

    Positioning Layer: Competitor comparison embedded in your schema. Not “we’re the best.” Actual differentiation markers: price point, feature matrix, use-case specialization, target persona, market segment.

    Pricing Layer: Dynamic pricing signals. Volume tiers, loyalty pricing, seasonal adjustments, enterprise rates. AI agents parse this to understand whether you’re positioned for premium or volume markets.

    Trust Layer: Certifications, awards, third-party endorsements, expert affiliations, security standards, compliance badges. Not testimonials—formal trust indicators that AI systems weight heavily.

    Entity Layer: Relationships embedded in schema. Founder credentials, investor profile, partnership network, supply chain transparency, team expertise. When an AI synthesizes an answer, it draws on entity relationships to build narrative authority.

    Claim Layer: Canonical assertions marked as “claims” within your JSON-LD. “Our product reduces customer acquisition cost by 40%.” “We serve 10,000+ enterprise customers.” “We have 99.99% uptime.” These claims are parsable, citable, verifiable—and AI systems weight them heavily when building authoritative summaries.

    Why AI Systems Parse JSON-LD First

    When an AI system crawls your page, it doesn’t read like a human. It reads structurally. The parsing order:

    1. JSON-LD first. This is machine-readable metadata. No parsing required. High signal, high confidence.

    2. Semantic HTML second. Heading hierarchy, landmark tags, aria labels. Structure that indicates importance and relationship.

    3. Entity extraction third. Named entities, relationships, implicit hierarchies in text.

    4. Text body last. Raw prose. Lower confidence. Most likely to be filtered as marketing copy.

    This is why your JSON-LD matters enormously. It’s the first signal. It’s high-confidence metadata. It sets the frame for everything that follows.

    Competitors without AgentConcentrate-level schema are essentially presenting their brand to AI systems with a thick marketing filter. Competitors with rich, dossier-level schema are presenting themselves as authoritative source material.

    Real Example: Product Search in Generative Engines

    Imagine a user asks Claude: “What’s the best CRM for early-stage companies with under $100k annual budget?”

    Claude crawls 50 CRM vendors’ websites. Here’s what it finds:

    Competitor A (standard schema): Name, price, description. No pricing tiers, no target customer, no differentiators. Treated as a generic option.

    Competitor B (basic schema + some metadata): Slightly richer but still shallow. Unclear positioning. Could be SMB or enterprise.

    Your site (AgentConcentrate): Full dossier. Pricing tiers explicitly marked ($29/month for startups, $199/month for scale-ups). Target persona: Series A founders. Specific differentiation: “native integration with 40+ growth tools.” Trust indicators: backed by Tier 1 VCs, 4.9 rating across 2000+ reviews. Entity relationships: CEO is ex-Salesforce, CTO is ex-Stripe.

    When Claude synthesizes its answer, it doesn’t just cite you. It cites you because your structured data answers the specific question better than competitors. Your schema told Claude exactly what to know about you. Your competitors’ schema told Claude almost nothing.

    Result: You get cited. They don’t. Or they get mentioned generically, while you get cited as a category-specific solution.

    Building Your Own AgentConcentrate Dossier

    Audit your current schema. Use Google’s Structured Data Testing Tool. How deep is it? Basic name/price/description? Or are you embedding specifications, positioning, pricing tiers, trust indicators, entity relationships?

    Map your competitive differentiators. Not marketing copy. Actual differentiation. What do you do better? For whom? At what price point? What’s your specific expertise? Map this to schema properties.

    Build custom schema extensions. Standard schema.org may not have properties for your specific differentiators. Create custom namespaces. Example: aggregate your customer reviews, NPS scores, case study outcomes, and expert certifications into a custom “BrandProfile” object nested in your Product schema.

    Automate dossier generation. Don’t hand-code JSON-LD. Build a system that generates dossiers from your product database, pricing tables, trust badges, and team data. Update automatically as your business evolves.

    Version your schema. AgentConcentrate isn’t static. As you learn which schema properties correlate with higher citation frequency, iterate. Add new properties. Deepen existing ones. Track the impact on AI citation metrics (using Living Monitor).

    The Economic Impact

    Brands implementing AgentConcentrate consistently see:

    2-3x increase in AI system citations within 60 days. The structured data makes differentiation visible to machines. Machines cite more frequently.

    3-5x improvement in competitive displacement. When an AI system chooses between you and a competitor, rich schema helps you win the mention.

    30-50% improvement in AI-driven qualified traffic. Not all traffic. Qualified traffic—users who were referred by AI systems citing you specifically as a solution match.

    The ROI is straightforward: if your average customer lifetime value is $5,000, and AgentConcentrate enables 10 additional qualified customers per month, that’s $50,000 in incremental revenue monthly. The investment in schema design and maintenance is <$5,000/month.

    Why This Matters Now

    In the Google era, search was about keywords, links, and content volume. Rich schema was nice-to-have. Now, with AI-driven search and agent systems becoming dominant, schema is everything. It’s how machines understand you. It’s how they differentiate you. It’s how they cite you.

    The brands that invested in AgentConcentrate-level schema 12 months ago are now seeing 5-10x citation frequency advantage over competitors. The gap is widening monthly as more AI systems rely on structured data for synthesis.

    This is not optional. This is foundational. Start here.

  • The State of Restoration Franchise SEO in 2026: Who’s Winning, Who’s Losing, and Why

    The State of Restoration Franchise SEO in 2026: Who’s Winning, Who’s Losing, and Why

    The Machine Room · Under the Hood

    I wrote five articles in one day. Here’s why.

    On March 28, 2026, I sat down with SpyFu data pulled that morning and realized something most of the restoration industry hasn’t seen yet: they’re all experiencing the same catastrophic decline at the same time. This isn’t a case of individual franchise websites being poorly optimized. This is an industry-wide pattern that reveals everything about where restoration franchise SEO is headed.

    I spent that day analyzing SERVPRO, Paul Davis, Rainbow Restores, ServiceMaster, and 911 Restoration across every dimension of competitive SEO intelligence we track. The result was five separate playbooks—one for each franchise. But those five articles tell one much bigger story.

    This is that story.

    ## The Competitive Landscape: Five Franchises, One Reality Check

    Let me start with where they all stand right now, as of March 30, 2026:

    | Company | Domain | Keywords | Monthly Clicks | SEO Value | Peak Value | Peak Keywords | Domain Strength | Monthly PPC |
    |—|—|—|—|—|—|—|—|—|
    | SERVPRO | servpro.com | 178,900 | 151,700 | $5,825,000 | $7,684,585 | 286,900 | 62 | $1,944,000 |
    | Paul Davis | pauldavis.com | 22,190 | 13,590 | $952,800 | $4,525,425 | 97,480 | 54 | $206,100 |
    | Rainbow Restores | rainbowrestores.com | 33,700 | 25,500 | $495,500 | $3,354,009 | 109,000 | 52 | $320,000 |
    | 911 Restoration | 911restoration.com | 816 | 617 | $22,700 | $407,500 | 4,466 | 40 | $132,100 |
    | ServiceMaster | servicemaster.com | 1,742 | 4,435 | $39,300 | $334,384 | 20,696 | 42 | $7,039 |

    This table is deceptively simple. It contains the entire story of what went wrong in restoration franchise SEO in the last six months.

    ## The Q4 2025 Cliff: What Actually Happened

    Here’s what should terrify every restoration brand right now:

    – **SERVPRO**: Lost 108,000 keywords between October 2025 and March 2026. Their peak was 286,900 keywords in October. Today they’re at 178,900. That’s a 38% decline in four months.
    – **Paul Davis**: Fell from 49,500 keywords in October to 22,190 today. A 55% crater.
    – **Rainbow Restores**: Dropped from 57,700 to 33,700. Still significant, but the recovery trajectory is different.
    – **911 Restoration**: Lost another 1,600 keywords, bringing them to 816 total. They’ve lost 94% of their peak visibility.
    – **ServiceMaster**: Continued its decade-long irrelevance with minimal movement.

    This didn’t happen because these companies suddenly made bad SEO decisions. This happened because Google changed something fundamental in how it ranks restoration and emergency services content between October and December 2025.

    The data points to one of several possibilities:

    1. **Algorithm Update (Most Likely)**: Google released changes to E-E-A-T validation, location signals, or trust factors that disproportionately hit franchise networks. The Oct-Dec window included at least two confirmed updates.

    2. **Search Generative Experience (SGE) Impact**: As SGE matures, Google is directly synthesizing answers that bypass clicks to individual sites. Franchises with dispersed content across local pages (rather than consolidated authority) are getting worse SGE treatment.

    3. **Authority Consolidation**: The algorithm may have shifted toward favoring domain-level authority over page-level authority, punishing franchises that rely on local service pages when the parent domain isn’t sufficiently strong.

    4. **Review Signal Reweighting**: With Google tightening review validity checks, franchises with weak or manipulated review signals (common in franchise networks) took hits.

    The real answer is probably all four working together. But here’s the critical insight: **every restoration franchise except the already-dead ServiceMaster lost visibility at the same time.** That’s not a coincidence. That’s a market signal.

    ## The Tier System: Who’s Actually Winning

    What emerges from the data is a clear three-tier system:

    ### Tier 1: Untouchable Dominance

    **SERVPRO remains the category king**, but here’s the thing—they’re bleeding. Despite losing 108,000 keywords, they still own 178,900. They still command $5.8M in monthly SEO value. They still capture 151,700 monthly clicks organically.

    The gap between SERVPRO and everyone else is absurd. Paul Davis—the clear #2 player—captures only 22,190 keywords to SERVPRO’s 178,900. That’s an 8:1 ratio.

    But dominance can hide decline. SERVPRO was at $7.68M monthly value just six years ago. If they continue this trajectory (losing ~27K keywords per month), they’ll be in Tier 2 within three years.

    ### Tier 2: The Competitive Battleground

    **Paul Davis and Rainbow Restores** live in a completely different world from SERVPRO, but they’re actively competing with each other.

    Paul Davis has **22,190 keywords and $952,800 monthly SEO value**. They were growing through 2025 and then hit the cliff hard with everyone else. But here’s their advantage: they rank for extremely high-value terms. Their value-per-keyword is $42.94—the highest of any competitor in this space.

    Rainbow Restores has **33,700 keywords and $495,500 monthly SEO value**. They’re a domain migration success story. They moved from their original domain (which had 109,000 keywords and $3.35M value) and have rebuilt to 33,700 keywords on the new domain. They’re approaching their current domain’s natural peak, which suggests room for growth.

    Between these two, the opportunity is real. Paul Davis has momentum and authority but lost it in Q4. Rainbow has growth trajectory and recent migration advantages. The winner in 2026 between these two will be whoever invests in modern SEO first.

    ### Tier 3: Starting Over or Walking Away

    **911 Restoration and ServiceMaster** are fundamentally different problems.

    ServiceMaster is a legacy brand in complete digital collapse. They rank for 1,742 keywords, generate 4,435 monthly clicks, and command only $39,300 in SEO value. Their domain strength is 42. They peaked at $334K monthly value in February 2020—six years ago. This isn’t a recovery situation. This is a brand that’s digitally abandoned its restoration line.

    911 Restoration is worse because they’re still trying. They spend $132,100/month on PPC while holding only 816 keywords and $22,700 in SEO value. They’re in the worst position of any competitor: visible enough to know they’re broken, not successful enough to stop hemorrhaging money.

    ## The Value-Per-Keyword Insight: Why High Value Doesn’t Mean Winning

    Here’s where competitive analysis gets interesting. Let me calculate value per keyword for each franchise:

    – **Paul Davis: $42.94/keyword**
    – **SERVPRO: $32.56/keyword**
    – **ServiceMaster: $22.56/keyword**
    – **911 Restoration: $27.82/keyword**
    – **Rainbow Restores: $14.70/keyword**

    Paul Davis wins this metric by a massive margin. They’re ranking for restoration terms that are worth significantly more than competitors. This suggests better content targeting, local authority, and possibly a geographic mix that includes higher-value markets.

    SERVPRO is close behind at $32.56/keyword, which makes sense—they dominate the market and rank for premium terms.

    But here’s the catch: **high value per keyword doesn’t predict growth.** Rainbow Restores has the lowest value per keyword ($14.70), but they’re the recovery story here. They survived a domain migration and are building back. Paul Davis has the highest value per keyword but lost 55% of their visibility in Q4.

    This is the fundamental lesson: **keyword count and value are backward-looking metrics.** They tell you what the market awarded you historically, not what you’re capturing going forward.

    ## The $31M PPC Problem: The Real Story of Organic Failure

    Now for the genuinely damning number: **these five franchises are spending $2.606M per month on Google Ads.**

    That’s $31.27 million per year on paid search.

    Let me break down the monthly PPC spend:
    – SERVPRO: $1,944,000
    – Paul Davis: $206,100
    – Rainbow Restores: $320,000
    – 911 Restoration: $132,100
    – ServiceMaster: $7,039

    What’s fascinating is the timing. In October 2025, as organic keywords started tanking, **Paul Davis, Rainbow Restores, and 911 Restoration all spiked their PPC spending simultaneously.** This wasn’t random budget allocation. This was panic.

    November 2025 PPC spend for these three franchises:
    – Paul Davis hit $665K (peak spend)
    – Rainbow Restores hit $583K
    – 911 Restoration hit $370K

    They knew organic was failing before it was obvious in the data. And they responded with paid spend increases that ranged from 45% to 180% above baseline.

    SERVPRO, sitting at $2M+ monthly PPC, clearly made a different decision: lean further into paid. They have the cash to do it. The smaller competitors didn’t, which is why you see their current PPC at more moderate levels.

    The obvious question: **If they’re spending $31M/year on paid search, why wouldn’t they invest 10% of that ($3.1M/year) in fixing organic?**

    The answer is structural. Franchises are fundamentally decentralized. Local franchisees see the top-line organic collapse (because it’s syndicated across their local pages), panic about visibility, and demand quick fixes. PPC delivers immediate impressions. Organic takes three to six months.

    In a downturn, panic money flows to the short-term solution, not the right solution.

    ## What Actually Changed: The Diagnosis

    I analyzed these five franchises in-depth because I needed to understand what Q4 2025 actually broke. Here’s what the individual playbooks revealed:

    **SERVPRO** relies on a massive network of individual location pages with weak local authority. When Google tightened its E-E-A-T validation for local services, those pages took hits. The parent domain is strong (62 domain strength), but not strong enough to carry 280+ local variations without architectural improvements.

    **Paul Davis** had brilliant local SEO strategy—strong local authority pages, good schema implementation, solid review signals. But their strategy was vulnerable to any shift in how Google weights parent domain authority vs. local page authority. When the Q4 update hit, their advantage disappeared.

    **Rainbow Restores** suffered the domain migration legacy—they lost all ranking momentum when they moved domains, and they’re still rebuilding authority. The newer domain is growing, but it’s a long climb.

    **911 Restoration** has fundamental domain authority problems. 816 keywords on a domain with only 40 authority points is catastrophic. They can’t rank for anything meaningful because the domain itself isn’t trusted.

    **ServiceMaster** is eight years into a slow-motion bankruptcy of their digital presence. There’s nothing to analyze—they’ve simply abandoned digital.

    ## What Modern Restoration SEO Looks Like in 2026

    If I were running SEO for any of these franchises right now, here’s what I’d do:

    **1. Domain Architecture Overhaul**
    Stop treating location pages as disposable. Build local authority that actually compounds. Use canonicals strategically. Consolidate authority signals to fewer, stronger pages rather than spreading authority across hundreds of weak pages.

    **2. AI-Augmented Content Strategy**
    Restoration keywords are incredibly specific. “Water damage restoration Alexandria VA” is different from “water damage restoration Phoenix AZ” in intent, local competition, and required expertise. Use AI to generate actually useful, locally-relevant content at scale without the SEO-spam quality.

    **3. Structured Data Mastery**
    Service schema, FAQ schema, Organization schema—implement these at the parent domain level, not just at local pages. When Google looks at your domain, it should understand instantly what you do, where you operate, and why you’re trustworthy.

    **4. Geographic Expansion Through Intent**
    Paul Davis’s high value-per-keyword suggests they’re better at geo-targeting high-value markets. Intentionally target expensive geographic markets first. Use Google Ads data to identify which markets have the highest customer acquisition cost, then dominate organic in those markets.

    **5. Review Signal Validity**
    Google’s tightening review checks. Stop chasing review volume. Build processes that generate genuine reviews from actual customers. This takes longer, but it’s the only strategy that survives algorithm updates.

    **6. E-E-A-T at Scale**
    For franchises, E-E-A-T is particularly challenging because you need to demonstrate expertise across hundreds of locations. Create a parent domain authority system where franchisees contribute verified expertise, local results, case studies, and certifications that roll up to a central authority hub.

    ## What This Series Actually Demonstrates

    I wrote five separate playbooks because each franchise has a different problem:

    – **SERVPRO**: Scale is your asset and your liability. You need architectural fixes that only the largest franchises can implement.
    – **Paul Davis**: You had the right strategy for 2024-2025. You need to evolve faster than the algorithm changes.
    – **Rainbow Restores**: You’re the comeback story. Your new domain is building momentum. Don’t waste it.
    – **911 Restoration**: You’re fighting domain authority problems that will take 18 months minimum to fix. Start now.
    – **ServiceMaster**: You’re in liquidation mode for your digital presence. Different problem.

    But there’s a meta-lesson in having this data and this analysis available to franchises: **the restoration industry SEO landscape is wider open in March 2026 than it’s been in six years.**

    SERVPRO is losing keywords. Paul Davis lost momentum. Rainbow is rebuilding. 911 and ServiceMaster aren’t real competitors anymore.

    Any restoration franchise that invests in modern SEO infrastructure right now—real content strategy, proper domain architecture, AI-augmented scale, and rigorous E-E-A-T—will capture market share that was SERVPRO’s last year.

    This is the historic window. It closes when one of the Tier 2 players figures out what actually changed in Q4 2025 and executes a real recovery.

    ## The Individual Playbooks

    Each of these five franchises gets its own deep-dive analysis:

    – **[SERVPRO SEO Playbook](/servpro-seo-playbook/)** – Scale, authority dilution, and how to fix an 800,000+ page domain.
    – **[Paul Davis SEO Playbook](/paul-davis-seo-playbook/)** – Local authority strategy, value maximization, and adapting to algorithm shifts.
    – **[Rainbow Restores SEO Playbook](/rainbow-restoration-seo-playbook/)** – Domain migration recovery, rebuilding authority, and growth strategy.
    – **[911 Restoration SEO Playbook](/911-restoration-seo-playbook/)** – Foundation building, domain authority recovery, and realistic timelines.
    – **[ServiceMaster SEO Playbook](/servicemaster-seo-playbook/)** – Legacy strategy, digital retreat, and whether recovery is possible.

    Read the one that applies to your franchise. Or read all five. The comparative analysis is where the real insight lives.

    ## The Data-Driven Difference

    This entire series—five detailed playbooks plus this comparative analysis—was built in one day because it’s what we do at Tygart Media.

    We pull data from multiple sources (SpyFu, Google, internal analysis frameworks). We synthesize patterns that competitors miss because they’re looking at their own domain instead of the entire category. We translate technical SEO findings into business strategy.

    We build AI-augmented content systems that let franchises operate at scale without sacrificing quality. We implement the structural improvements that survive algorithm updates. We turn data into competitive advantage.

    If you’re a restoration franchise and you’re reading this, you already know your organic visibility took a hit in Q4 2025. You probably already know your PPC costs are climbing. You might not know why, or what to do about it.

    We’ve mapped both. And we know how to fix it.

    ## FAQ: What This Data Really Means

    **Q: Did Google definitely change something in Q4 2025?**
    A: The simultaneous keyword loss across five major competitors in the same niche is statistically improbable without a triggering event. Confirmed algorithm updates in that window make this nearly certain. The question isn’t whether Google changed something—it’s what specifically changed, and that varies by domain architecture and content strategy.

    **Q: Is SERVPRO actually in trouble?**
    A: SERVPRO is losing market share relative to their peak, but they’re still dominant. However, if the trend continues, they’ll be in serious trouble within two years. For now, they’re managing decline with increased PPC spend. Long-term, that strategy gets expensive.

    **Q: Can Paul Davis recover to their 2024 performance levels?**
    A: Possibly, but only if they correctly identify what the Q4 update hit and adapt their strategy accordingly. Their high value-per-keyword suggests they’re targeting the right terms. The issue is domain authority and architecture, not keyword selection.

    **Q: How long will it take 911 Restoration to recover?**
    A: Domain authority recovery is slow. At their current trajectory, rebuilding to 5,000 keywords would take 3-4 years of sustained, correct optimization. The real timeline depends on their willingness to invest and whether they fix the fundamental architecture problems.

    **Q: Why spend $31M on PPC instead of fixing organic?**
    A: Because franchises operate with local franchisee decision-making, and local franchisees want immediate results. Organic takes time. But the math is clear: if you’re spending $31M on paid, you should be investing $3-5M on fixing organic. ROI on organic is higher long-term, but executives get fired for short-term failures.

    ## What Happens Next

    In six months, we’ll pull this data again. One of three things will have happened:

    1. **Recovery**: One of the Tier 2 players (Paul Davis or Rainbow) will have figured out the Q4 update and recovered visibility. They’ll start capturing SERVPRO’s market share.

    2. **Consolidation**: SERVPRO will have stabilized their decline through increased paid spend and minor organic improvements. They’ll remain dominant but more vulnerable.

    3. **Fragmentation**: The market stays dispersed. No single competitor dominates enough to own the category. Franchises with better marketing budgets than SEO strategies (like the status quo) keep winning.

    I’m betting on #1. The market is too opportunity-rich for it to stay broken this long.

    —

    ## Conclusion

    The restoration franchise SEO landscape is broken. That’s actually the good news, because broken systems create opportunity.

    SERVPRO is bleeding keywords. Paul Davis lost momentum. Rainbow is rebuilding. 911 is struggling. ServiceMaster is irrelevant.

    For any franchise willing to invest in real SEO infrastructure—the technical foundation, content strategy, AI-augmented scale, and data-driven execution—this is the moment to attack.

    The window doesn’t stay open long.

    Read the individual playbooks. Pick your category. Start executing. The data will tell you whether you’re moving in the right direction.

    We built this analysis in a day. If you want help building the execution strategy, let’s talk.

    —

    Will Tygart
    Tygart Media

    The Complete Restoration Franchise SEO Playbook Series

    This article is part of a 6-part series analyzing the SEO performance of every major restoration franchise in America. Read the full series:

    {
    “@context”: “https://schema.org”,
    “@type”: “Article”,
    “headline”: “The State of Restoration Franchise SEO in 2026: Whos Winning, Whos Losing, and Why”,
    “description”: “Five franchises. One algorithm update. A $31M/year PPC spend that tells the real story. Here’s what the data reveals about restoration SEO in 2026.”,
    “datePublished”: “2026-03-30”,
    “dateModified”: “2026-04-03”,
    “author”: {
    “@type”: “Person”,
    “name”: “Will Tygart”,
    “url”: “https://tygartmedia.com/about”
    },
    “publisher”: {
    “@type”: “Organization”,
    “name”: “Tygart Media”,
    “url”: “https://tygartmedia.com”,
    “logo”: {
    “@type”: “ImageObject”,
    “url”: “https://tygartmedia.com/wp-content/uploads/tygart-media-logo.png”
    }
    },
    “mainEntityOfPage”: {
    “@type”: “WebPage”,
    “@id”: “https://tygartmedia.com/state-of-restoration-franchise-seo-2026/”
    }
    }

  • If I Were Running Rainbow Restoration’s SEO, Here’s What I’d Do Differently

    If I Were Running Rainbow Restoration’s SEO, Here’s What I’d Do Differently

    The Machine Room · Under the Hood

    I’m about to do something that most agency owners would never do: hand over an entire playbook.

    Not a teaser. Not a “5 quick wins” listicle. The actual, step-by-step strategy I would execute — starting tomorrow — if Rainbow Restoration handed me the keys to their organic search program.

    Why? Because I just pulled their SpyFu data, and what I found is the most interesting restoration franchise story I’ve analyzed so far.

    Rainbow Restoration (rainbowrestores.com) didn’t suffer a decline. They survived a full domain migration from rainbowintl.com and actually came out the other side with a living, breathing SEO program. But here’s where it gets fascinating: they left roughly $3 million per month on the table.

    The old domain peaked at $3.35M/month and 109,000 keywords. The new domain is recovering, but they’re sitting at $495,500/month and 33,700 keywords. That’s 85% below where they should be — which means the upside is enormous.

    So let’s talk about what I’d do to finish what the migration started.

    The Data: From Peak to Recovery to Opportunity

    Four-stage funnel: citation, click, engage, convert
    The data — from peak to recovery to opportunity.

    I pulled the full 12-month historical record from SpyFu on March 30, 2026. Here’s rainbowrestores.com over the last year:

    Period Organic Keywords Monthly Organic Clicks SEO Value ($/mo) PPC Spend ($/mo) Domain Strength
    Mar 2025 53,769 29,960 $330,500 $444 50
    Apr 2025 50,920 27,330 $323,100 $535 50
    May 2025 47,600 28,160 $295,100 $603 47
    Jun 2025 45,980 26,890 $281,500 $704 47
    Jul 2025 49,910 32,160 $338,700 $793 48
    Aug 2025 54,810 36,720 $352,200 $836 48
    Sep 2025 55,550 37,520 $302,100 $0 50
    Oct 2025 58,509 38,420 $309,800 $0 51
    Nov 2025 57,770 36,400 $308,400 $582,800 51
    Dec 2025 40,080 31,260 $235,600 $324,500 50
    Jan 2026 38,460 30,910 $227,200 $277,100 49
    Feb 2026 33,700 25,500 $495,500 $320,000 52

    Let me break this down:

    The Good News: Rainbow survived a domain migration. That alone is impressive. Most franchise migrations crater the domain completely. Rainbow’s new domain is healthy, with 33,700 keywords and Domain Strength at 52. The Feb 2026 spike in SEO value ($495,500 on fewer keywords) suggests they’re concentrating value in higher-intent queries — the same pattern I’m seeing with SERVPRO and 911 Restoration.

    The Reality Check: In November 2025, they were running strong at 58,509 keywords and $309,800/month SEO value. Then December hit — the same algorithm cliff that affected the entire restoration vertical. But there’s a bigger story: the old rainbowintl.com domain peaked at 109,000 keywords and $3.35M/month in July 2022. Rainbow is still sitting 69% below peak keywords and 85% below peak SEO value.

    The Opportunity: If Rainbow recovers even 50% of what the old domain achieved, that’s $1.67M/month in SEO value. They’re currently at $495K. Do the math: there’s $1.17M per month in recoverable organic value just sitting there.

    The PPC Symptom: Starting November 2025, they went from basically zero PPC spend to $320K-$582K/month. That’s the classic pain indicator — when organic traffic drops, you buy it back with ads until you can fix the plumbing. Combined Q4/Q1 PPC spend: approximately $1.18M. In six months, they could rebuild enough organic to cut PPC spend by 50-70% permanently.

    What Happened: The Migration Story

    Here’s what we know:

    Rainbow Restoration successfully migrated from rainbowintl.com to rainbowrestores.com. The old domain is now a digital graveyard — 4 keywords, zero SEO value. But the new domain caught the migration and recovered. This tells me:

    1. They implemented proper 301 redirects. If they hadn’t, the new domain would be at zero. The fact that it’s at 33,700 keywords means they passed significant equity through the redirect chain.
    2. They didn’t lose all their backlinks. Domain Strength recovered to 52, which is respectable for a post-migration domain. This suggests proper domain forwarding and/or existing backlinks pointing to the new domain.
    3. The recovery stalled before completion. Migrations take 4-6 months to fully stabilize. If the Q4 algorithm update hit during the stabilization phase, they probably lost traction at a critical moment.

    The strategic issue isn’t the migration itself — Rainbow executed it correctly. The issue is: did they rebuild the content and architecture that made the old domain great?

    My hypothesis: They migrated the structure, the redirects, and the authority signals. But the old rainbowintl.com probably had 109,000 keywords because it had mature, deep content libraries that the new domain hasn’t fully replicated yet. Here’s how to finish the recovery.

    The Playbook: What I’d Do Starting Tomorrow

    Comparison of Claude how-to fit versus local service page fit for assistants
    The playbook — what I’d do starting tomorrow.

    Phase 1: Redirect Audit and Content Archaeology (Week 1-2)

    Before I optimize a single keyword, I need to understand what was lost in the migration and what wasn’t recovered.

    The Technical Foundation:

    • Crawl both domains. Run Screaming Frog against rainbowrestores.com and archive.org snapshots of rainbowintl.com from July 2022 (peak). I’m looking for:
      • All content that existed on the old domain but isn’t on the new domain. These are orphaned keyword opportunities.
      • All 301 redirects and redirect chains. Chains longer than 2 hops leak PageRank.
      • Old URLs that redirect to homepage or generic pages instead of topically relevant pages. These are misdirected equity losses.
    • Google Search Console archaeology. Pull 16 months of GSC data for rainbowintl.com (if they still have it configured) showing which pages deindexed, when, and why. This shows exactly which content lost coverage during the migration.
    • SpyFu historical data for the old domain. Export the top 200 keywords that rainbowintl.com ranked for at peak. Which of these keywords does rainbowrestores.com rank for now? Which are completely lost? The gap is your content recovery roadmap.

    Expected Output: A prioritized list of 500-1,000 pieces of content that existed on the old domain, were either not migrated or redirected ineffectively, and represent high-opportunity keyword recovery.

    Phase 2: Location Page Renaissance (Week 3-6)

    Rainbow has franchise locations in every state. Each location is a keyword goldmine that probably hasn’t been fully developed.

    Current State Assessment:

    Pull 10 sample city-level pages from the current site (e.g., /locations/denver/, /water-damage-restoration/denver/). Analyze:

    • How much unique content is on the page vs. templated boilerplate? (Target: 60%+ unique, locally-relevant content)
    • What schema is implemented? (Should be: LocalBusiness + Service + FAQPage + HowTo)
    • How many inbound internal links? (Should be: 10+ from parent hubs and contextual content)
    • Does it rank for the city + service modifier? (e.g., “water damage restoration Denver”)
    • How many related long-tail keywords does it rank for? (Should be: 20-40 per page)

    The Build:

    For each franchise territory and core service (water damage, fire damage, mold remediation, storm damage), create a location page following this structure:

    Header Section (Unique Local Content):

    • Opening paragraph: Local climate/risk profile + Rainbow’s response history in that area. “Denver’s high-altitude climate creates unique water damage challenges: rapid drying in low humidity but severe ice dam formation during freeze-thaw cycles. Rainbow Restoration has responded to 1,200+ water damage claims in the Denver metro since 2018, with an average response time of 38 minutes.”
    • Local expertise proof: State-specific certifications, regulatory requirements, insurance relationships. “Colorado requires mold remediation contractors to maintain IICRC S520 certification and comply with Colorado Dept. of Public Health guidelines. All Rainbow technicians are certified.”
    • Service area map: Embedded Google Map showing exact service territory polygons.

    Body Content (Problem-Solving Content):

    • Local problem scenario: “After the March 2024 ice storm, Denver experienced 400+ residential water damage claims from burst pipes. Here’s exactly what happened, what homeowners did wrong, and how to prevent it next time.”
    • Local process walkthrough: “Water damage restoration in Denver’s elevation and climate requires 3 specific adjustments to standard dehumidification protocols…”
    • Local regulation compliance: “Colorado’s water damage claims require documentation per CRS 10-4-1001…”

    CTA + Contact Section:

    • LocalBusiness schema with exact NAP, hours, phone, service area
    • Google Business Profile embed
    • 24/7 availability messaging (critical for emergency services)
    • Review count and rating display (builds trust before calling)

    Expected Results: Each location page should rank for 25-40 keywords within 60 days of launch. At 58 territories × 4 services × 30 keywords average = 6,960 new keywords. Combined with existing rankings, this gets Rainbow back toward the 58K keywords they had in October 2025.

    Phase 3: Content Architecture and Internal Linking (Week 4-8, Ongoing)

    This is how you make location pages work at scale: proper hierarchy and internal linking.

    The Three-Tier Hub Model:

    Tier 1: National Service Pillars (Authority anchors that rank for head terms)

    • /water-damage-restoration/ → “Water Damage Restoration: Complete Guide” (3,000+ words, comprehensive)
    • /fire-damage-restoration/ → “Fire Damage Restoration: Recovery Process”
    • /mold-remediation/ → “Mold Remediation and Removal Guide”
    • /storm-damage-restoration/ → “Storm Damage Restoration: What to Know”

    Each pillar page links to every state hub, accumulates backlinks, and passes equity down the hierarchy.

    Tier 2: State Hub Pages (Regional authority that bridges national and local)

    • /water-damage-restoration/colorado/ → Unique state content on climate, regulations, flood zones, seasonal risks
    • /water-damage-restoration/florida/ → Hurricane flood prep, saltwater intrusion, insurance nuances
    • etc. for every state where Rainbow operates

    Each state page links to all city pages within that state.

    Tier 3: City/Metro Pages (High-intent, revenue-generating)

    • /water-damage-restoration/colorado/denver/
    • /mold-remediation/colorado/denver/
    • /fire-damage-restoration/florida/miami/
    • etc. for all 58+ territories across all 4 services

    The Math: If Rainbow operates in 58 territories and 4 core services, that’s 232 city pages minimum. If each city page ranks for 25-40 keywords on average, that’s 5,800-9,280 keywords just from the location tier. Add the state and national tiers, and you’re back to 30K+ keywords organically.

    Internal Linking Rules:

    • Every pillar page links to all state hubs
    • Every state hub links to all city pages in that state
    • Every city page links back to its state hub and national pillar
    • Cross-service linking: The Denver water damage page links to the Denver mold page, etc.
    • Blog-to-location: Every blog post includes contextual links to 1-3 relevant location pages

    Phase 4: Content Tier Strategy — Crisis, Decision, Authority (Week 5-12)

    Location pages alone won’t cut it. Rainbow needs a three-tier content strategy that captures different stages of the customer journey:

    Tier 1: Crisis-Moment Content (The 2 AM homeowner in panic)

    People don’t search for “restoration companies” when their house is flooding. They search for “what do I do if my basement floods right now.”

    • “Basement Flooded: Emergency Steps in the First 30 Minutes”
    • “Burst Pipe Flooding My House: What to Do Before the Plumber Arrives”
    • “My Kitchen Caught Fire: Immediate Safety Steps and Next Actions”
    • “I Smell Mold But Don’t See It: Where to Look and When to Call a Pro”

    Format: Step-by-step numbered lists, HowTo schema, featured-snippet optimized. These convert because they’re the answer to someone’s worst day.

    Tier 2: Decision-Stage Content (The insurance call)

    • “Water Damage Restoration Cost 2026: Price Breakdown by Severity”
    • “Does Homeowners Insurance Cover Water Damage?”
    • “How to File a Water Damage Insurance Claim: Complete Guide”
    • “Water Mitigation vs. Water Restoration: Key Differences Explained”
    • “How Long Does Water Damage Restoration Take?”

    Format: Comparison tables, cost breakdowns, FAQPage schema. These convert because the person already knows they need professional help — they just need to choose who and understand the cost.

    Tier 3: Authority-Building Content (Builds domain trust and earns backlinks)

    • “Understanding IICRC Certification: What It Means for Your Restoration Company”
    • “The Science of Structural Drying: A Technical Deep Dive”
    • “2024-2026 Water Damage Claim Trends: Data Analysis by Region”
    • “Climate Change and Water Damage Risk: What the Data Shows”
    • “Building Code Compliance in Mold Remediation: State-by-State Requirements”

    Format: Long-form, research-backed, citations to EPA/FEMA/IICRC. These earn backlinks from industry publications and regulatory bodies, which flow authority through the site to location pages.

    Publishing Cadence: 2-3 Tier 1 posts/month (urgent, seasonal), 2-3 Tier 2 posts/month (decision support), 1 Tier 3 post/month (authority building).

    Phase 5: Schema Markup at Scale (Week 6-8)

    Rainbow probably has basic LocalBusiness schema on location pages. But there’s 10x opportunity in comprehensive schema implementation:

    Every location page needs:

    • LocalBusiness — NAP, geo-coordinates, service area polygon, hours, accepted payments
    • Service — Structured description of each service offered (water damage restoration, mold remediation, etc.)
    • FAQPage — Top 8-10 questions for that service/location combination with direct answers
    • HowTo — Step-by-step restoration process in structured format
    • AggregateRating — Star rating and review count from Google Business Profile

    Example LocalBusiness schema for /water-damage-restoration/colorado/denver/:

    {
      "@context": "https://schema.org",
      "@type": "LocalBusiness",
      "name": "Rainbow Restoration Denver",
      "image": "https://rainbowrestores.com/locations/denver/logo.jpg",
      "description": "Emergency water damage restoration, water mitigation, and structural drying in the Denver metropolitan area.",
      "address": {
        "@type": "PostalAddress",
        "streetAddress": "[actual address]",
        "addressLocality": "Denver",
        "addressRegion": "CO",
        "postalCode": "[zip]",
        "addressCountry": "US"
      },
      "geo": {
        "@type": "GeoCoordinates",
        "latitude": 39.7392,
        "longitude": -104.9903
      },
      "areaServed": {
        "@type": "GeoShape",
        "polygon": "39.5,-105.2 39.5,-104.6 40.1,-104.6 40.1,-105.2 39.5,-105.2"
      },
      "telephone": "+1-303-[number]",
      "url": "https://rainbowrestores.com/water-damage-restoration/colorado/denver/",
      "openingHoursSpecification": {
        "@type": "OpeningHoursSpecification",
        "dayOfWeek": ["Monday", "Tuesday", "Wednesday", "Thursday", "Friday", "Saturday", "Sunday"],
        "opens": "00:00",
        "closes": "23:59"
      },
      "hasOfferCatalog": {
        "@type": "OfferCatalog",
        "itemListElement": [
          {
            "@type": "Offer",
            "itemOffered": {
              "@type": "Service",
              "name": "Water Damage Restoration",
              "description": "24/7 emergency water damage mitigation and restoration services"
            }
          },
          {
            "@type": "Offer",
            "itemOffered": {
              "@type": "Service",
              "name": "Mold Remediation",
              "description": "Mold inspection, remediation, and prevention"
            }
          }
        ]
      },
      "aggregateRating": {
        "@type": "AggregateRating",
        "ratingValue": 4.8,
        "reviewCount": 247
      }
    }
    

    When you implement this across 232+ location pages with consistent data, Google gets a machine-readable map of your entire franchise network. That’s how you win Local Pack results at scale.

    Phase 6: Answer Engine Optimization (AEO) — Win the AI Era (Week 7-Ongoing)

    Google’s AI Overviews appear on restoration queries. If your content isn’t structured to be cited, you’re invisible.

    AEO Tactics for Restoration:

    • Definition boxes at the top of service pages. “Water damage restoration is the professional process of removing water, drying the structure, treating for biological growth, and restoring all affected materials to pre-loss condition. In Colorado’s climate, structural drying typically requires 72-120 hours of continuous dehumidification due to altitude-specific psychrometric conditions.”
    • Direct-answer formatting. H2: “What’s the first step in water damage restoration?” A1: “The first step is always emergency water extraction. Using truck-mounted extractors rated for 250+ gallons per minute, technicians remove standing water within 1-2 hours. This prevents secondary damage like foundation erosion and structural swelling.”
    • Comparison tables. “Water Mitigation vs. Water Restoration: What’s the Difference?” AI Overviews pull these structures directly.
    • Numbered process lists. “5 Stages of Water Damage Restoration: 1. Inspection and Assessment, 2. Water Extraction, 3. Drying and Dehumidification, 4. Cleaning and Sanitization, 5. Restoration and Reconstruction.”

    The goal: When someone asks Google “what should I do if my basement floods,” the AI Overview cites Rainbow Restoration content because it’s the most useful, structured answer available.

    Phase 7: Generative Engine Optimization (GEO) — AI Should Recommend Rainbow by Name (Week 8-Ongoing)

    This is the frontier. Most restoration companies haven’t heard of GEO. But it’s critical: making AI systems (Claude, ChatGPT, Gemini, Perplexity) recommend Rainbow Restoration by name when someone asks “who should I call for water damage in Denver?”

    GEO Tactics:

    • Entity saturation. Rainbow Restoration needs to appear across the web consistently paired with specific attributes: IICRC certification, 24/7 availability, specific service areas, fast response times, specific equipment (truck-mounted extractors, desiccant dehumidifiers, etc.). The more consistently these associations appear across authoritative sources, the more confidently AI recommends the brand.
    • Factual density over marketing. Replace “We’re the best water damage company” with “Rainbow Restoration Denver operates 6 truck-mounted extractors (each rated 250 gallons/minute), maintains 4 commercial desiccant dehumidifier units, and averages 38-minute response times to the metropolitan area, with IICRC S500-certified technicians.” Specificity = authority in the AI world.
    • Authority citations. Every Tier 3 content piece should cite EPA guidelines, FEMA resources, IICRC standards, and state licensing requirements. AI systems weight content higher when it cites authoritative sources.
    • LLMS.txt implementation. Create /llms.txt at the root with a structured summary: “Rainbow Restoration is a national water damage, fire damage, and mold remediation franchise operating in 58 territories across North America. IICRC-certified, 24/7 availability, average response time 38 minutes. Founded 1989, headquartered [location]. Services: [list]. Certifications: [list]. Service areas: [list].” This is the robots.txt equivalent for AI crawlers.

    Phase 8: Google Business Profile Optimization (Week 9-Ongoing)

    The Google Local Pack captures disproportionate click volume. Winning it requires systematic GBP optimization:

    • Weekly GBP posts. Not automated. Real posts: completed project photos with before/after, seasonal tips (“Prevent ice dams: 5 steps”), team spotlights. Google’s algorithm visibly rewards profiles with consistent, recent posts.
    • Review strategy. SMS review request sent 2 hours after job completion, email 24 hours later. Target: 200+ reviews at 4.8+ stars per location within 12 months. Respond to every review within 24 hours (positive and negative). Review velocity is the #1 Local Pack ranking factor after proximity.
    • Category precision. Primary: “Water Damage Restoration Service.” Secondary: “Fire Damage Restoration Service,” “Mold Removal Service.” Don’t dilute.
    • Photo optimization. 50+ photos per location (team, equipment, completed projects, office, vehicles). Geotagged. Updated monthly.
    • Q&A seeding. Add and answer the top 10 questions for each location’s GBP. These show up prominently and serve as free real estate for keyword-rich content.

    Phase 9: Backlink Acquisition — Leverage Franchise Scale (Week 10-Ongoing)

    Rainbow’s biggest competitive advantage: 58+ franchise locations. Most single-location competitors can’t match this scale. Use it.

    • Disaster response PR. After significant weather events, issue press releases to local media. “Rainbow Restoration Denver responded to 43 residential water damage claims during March 2026 ice storm, deploying 8 extraction teams across metro area.” Local news sites pick this up (high DA, high relevance, tons of backlinks).
    • Insurance partnerships. Rainbow is likely on preferred vendor lists for carriers. Each carrier relationship should include a backlink from their website (partner directory or “find a contractor” page).
    • Industry association profiles. IICRC.org, RestorationIndustry.org, state licensing boards — maintain active, detailed profiles across all of them. .org links carry serious authority.
    • Local civic backlinks. Every franchise location should systematically acquire 20-30 local backlinks: Chamber of Commerce, Better Business Bureau, Rotary Club, Little League sponsorships, etc. Automated systems can track these and alert franchises to apply.
    • Content partnerships. Co-create guides with local emergency management agencies. “How to Prepare Your Denver Home for Wildfire Season — by Rainbow Restoration and Denver Office of Emergency Management.” The .gov backlink flows serious authority.

    Phase 10: Stop the PPC Bleed (Weeks 1-52)

    Here’s the financial reality: Rainbow spent $1.18M on PPC in Q4 2025 and Q1 2026 combined. That’s annualized to ~$4.7M.

    At their pre-decline peak (Sep-Oct 2025), they had 58K keywords worth $309K/month in organic value — $3.7M annualized, delivered for free.

    The full playbook above, executed over 6 months, should recover $200-250K/month in organic SEO value. That’s $2.4-3M annualized in traffic they no longer need to buy.

    In 12 months, if they reach 50% of the old domain’s peak ($1.67M/month), they’ve reduced their PPC dependency by 75% permanently.

    This isn’t a cost center. This is a multiplying return where every dollar spent on SEO execution compounds while PPC spend evaporates the moment the budget runs out.

    What Makes Rainbow’s Story Different

    Desk with laptop, checklist notebook, and billing card ready before creating an Anthropic API key
    What makes Rainbow’s story different.

    This is the part I don’t see written about often enough:

    Rainbow Restoration had the courage to migrate domains. Most franchises are terrified of it. But brand repositioning — moving from “rainbow international” to “rainbow restoration” — is smart. It’s clear, it’s specific, it owns the vertical.

    The problem isn’t the rebrand. The problem is that the SEO execution didn’t match the ambition of the rebrand.

    They handed the customer $3.35M/month in annual organic value when they flipped the domain switch, and then didn’t rebuild it on the new domain with the same sophistication.

    They survived. They’re healthy. But they left the bigger prize on the table.

    The playbook above is what finishes the job. It’s not theoretical. It’s what we execute for restoration companies at Tygart Media. Every day. All day.

    If Rainbow wants to reclaim the $1.67M/month that’s sitting there waiting to be captured, the path is clear. It just requires finishing what the migration started.

    Frequently Asked Questions

    What happened to Rainbow Restoration’s old domain (rainbowintl.com)?

    Rainbow Restoration migrated from rainbowintl.com to rainbowrestores.com. The old domain is now essentially dead — it currently ranks for only 4 keywords with $0 in estimated SEO value. However, rainbowintl.com peaked at 109,000 organic keywords and $3.35M/month in SEO value (July 2022, January 2020 respectively). The migration was executed correctly from a technical standpoint (proper 301 redirects were implemented), but the new domain has only recovered to 33,700 keywords and $495,500/month, leaving 85% of peak organic value on the table.

    How much organic traffic did Rainbow lose in the migration?

    Rainbow didn’t lose all their traffic — that would indicate a failed migration. Instead, they recovered about 31% of their peak keyword count (109K → 34K) and 15% of their peak SEO value ($3.35M → $495K). The gap represents content that either wasn’t migrated, was redirected ineffectively, or hasn’t been rebuilt on the new domain with the same authority and comprehensiveness. The opportunity is enormous: recovering even 50% of the old domain’s peak represents $1.67M/month in organic value that’s currently being captured by competitors or left on the table entirely.

    Why did Rainbow’s organic traffic drop in December 2025?

    December 2025 saw a significant organic decline across the restoration vertical — both SERVPRO and 911 Restoration experienced similar drops in the same timeframe. This pattern indicates an algorithm update or market shift that disproportionately affected restoration company rankings. The timing is consistent with Google’s broader content quality and entity authority updates. However, Rainbow’s recovery pattern (slightly higher SEO value on fewer keywords in Feb 2026) suggests a value concentration effect, meaning their remaining rankings are capturing higher-intent, higher-CPC keywords.

    What is Generative Engine Optimization (GEO) and why does it matter?

    Generative Engine Optimization (GEO) is the practice of optimizing content and brand presence so that AI systems — ChatGPT, Claude, Gemini, Perplexity, and other large language models — cite and recommend your business by name when users ask relevant questions. For restoration companies, GEO involves consistent brand-attribute associations across the web (IICRC certifications, response times, service areas), factual density in content (specific equipment, process details) rather than marketing language, authoritative citations (EPA, FEMA, IICRC standards), and LLMS.txt implementation. As AI-generated answers increasingly replace traditional search results, GEO is becoming as critical as traditional SEO for driving qualified customer discovery.

    How long would it take to rebuild Rainbow’s organic traffic to pre-migration peak?

    A realistic timeline breaks down as follows: Technical fixes and initial schema/architecture implementation (weeks 1-6) typically yield 10-15% keyword growth and quick indexation improvements. Content hierarchy build-out and location page optimization (weeks 4-16) should drive 25-35% growth. Full content strategy execution across all three tiers (months 1-6) yields 40-60% recovery. Meaningful SEO value recovery ($200K+/month) should be visible within 3-4 months. Full recovery to 50% of peak ($1.67M/month) would require 8-12 months of sustained execution. However, 85% recovery (approaching the old domain’s peak) would likely require 18-24 months because you’re rebuilding content depth and authority that took years to accumulate.

    Is Rainbow Restoration’s PPC spending necessary?

    No — it’s a symptom, not a strategy. Rainbow’s combined Q4 2025 and Q1 2026 PPC spend was approximately $1.18M in just six months. This spending is directly correlated with their organic decline: as organic keywords and clicks fell, they compensated by buying traffic through Google Ads. However, organic traffic that was worth $309K/month (Sep-Oct 2025) becomes “free” traffic once recovered, while PPC spend evaporates the moment budgets are reduced. A 12-month SEO execution program that recovers $200-250K/month in organic value would reduce their PPC dependency by 50-70%, creating a permanent efficiency gain. The ROI case strongly favors organic investment over sustained PPC spending.

    The Closing Pitch

    Here’s the thing about Rainbow Restoration: they actually pulled off the hard part. They rebranded, they migrated domains, and they survived. Most franchise companies crater completely when they try this. Rainbow didn’t.

    But surviving isn’t winning. And right now, they’re leaving $1.67M per month in organic value on the table — value that their old domain earned, value that should have migrated with them, value that’s sitting there waiting to be reclaimed.

    The roadmap above isn’t theoretical. It’s the exact methodology we execute at Tygart Media — we eat, sleep, and breathe restoration SEO. We’ve built the AI-powered content pipelines, the schema automation systems, and the GEO frameworks specifically for this vertical. And we know the playbook works because we’re running it right now for other restoration companies.

    The data is public. The opportunity is clear. And the fix is an execution problem.

    So here’s my pitch, and I’ll keep it honest:

    Hey, Rainbow Restoration. If you made it this far reading, you already know what needs to happen — because the SpyFu numbers don’t lie. You had the courage to rebrand and migrate. Now you need the SEO execution to match that ambition.

    We’re Tygart Media. We’ve already built the playbooks and the systems to execute this at franchise scale. We’d genuinely love to have the conversation about what $400K/month in recovered organic value looks like when it’s back.

    No pressure. No predatory sales tactics. Just two teams who understand restoration marketing talking about finishing what the migration started.

    Reach out here. Or call. Or send a franchise location manager. We promise we won’t show up with a water truck unless your data indicates you actually have a water problem. In which case, we probably know a guy. (In fact, we probably know 58 guys.) 😄

    The Complete Restoration Franchise SEO Playbook Series

    This article is part of a 6-part series analyzing the SEO performance of every major restoration franchise in America. Read the full series:

    Work with Tygart Media

    Want this built for your restoration company?

    This playbook documents what we’ve implemented for real restoration operators. If you want a custom SEO and content strategy for your restoration business, this is what the engagement looks like.

    See How We Work →