Inspired by Revved Digital. Original report: Revved Digital 2026 Home Service Marketing Benchmark Report. This is a new Tygart article for restoration contractors. We kept the mechanism, added first-party field knowledge, and did not reprint the piece.
The useful sentence in that report is the first one: benchmarks only work when clicks, leads, bookings, sold jobs, and customers stay separate. The table then shows restoration and water damage at an $8.33 CPC and $90.92 CPL. Those are LocaliQ Home & Home Improvement proxies, not a national restoration average. Roofing sits at $228 CPL with real trade data. Plumbing at $129. Treat the restoration row as context, not a quota.
There is no credible nationwide LSA CPL, SEO price, website conversion rate, or review-count target across those nine trades. The honest public numbers that do transfer:
CallRail: 97% of homeowners say speed influences whom they hire. 41% of online-booked jobs arrive after hours.
ServiceTitan (2022, cross-trade): 42% typical call booking rate. Old, and not restoration-specific. Still a better reference than “we feel busy.”
Planning range of 5–10% of revenue is general small-business guidance, not a measured restoration average.
Build the number backward. How many more losses can the crews take. What is allowable CAC from gross profit on water versus sewage versus fire. What is the real lead-to-customer rate on the night board. Fund channels from that. A shop spending 5% with a dead after-hours line wastes more than a shop spending 10% that answers.
Compare your pin to the shops ranking for water in your city — count, recency, replies — not to a national review target that does not exist.
Inspired by CustomerFlows. Original article: How to Track Marketing ROI as a Contractor (No Marketing Team). This is a new Tygart article for restoration contractors. We kept the mechanism, added first-party field knowledge, and did not reprint the piece.
Most shops know what they spent on ads and what they invoiced. The gap between those two numbers is guesswork. The original system is three steps and does not need a marketing department: tag every lead, keep the tag until the job is won or lost, compare revenue and spend on the first of the month.
Restoration sources worth a field
Google Ads / LSAs
Organic / Maps
Plumber or roofer referral
Adjuster or TPA
Property manager
Storm-lead vendor
Yard sign / truck wrap
“How did you hear about us?” when none of the above fire
If the source is blank, the lead is unattributable. Unattributable leads make every channel look the same. A spreadsheet works until volume breaks it. A CRM is better because the tag has to survive from the night board to the invoice.
ROI is (closed revenue minus spend) divided by spend, by source. The original example is the owner who almost killed direct mail because it felt expensive — it was the second-best channel. Restoration version: the plumber list looks free and the marketplace leads look busy. One of those is usually lying. Monthly, not yearly. Weather moves the numbers too fast for an annual glance.
Clicks are not ROI. A $25 shared water lead that never books costs more than a $90 Maps call that becomes a sewage job. Cost per acquired customer is the number that should move the budget.
Most shops do not have a “no marketing” problem. They have a no-clarity problem. Ads, LSAs, the pin, a website from 2019, referrals from plumbers — when the board goes quiet everyone guesses. The original scorecard says you can run the company on five numbers: leads by source, cost per lead, booking rate, close rate, revenue per new job.
How those five read on a water job
Leads by source. Maps, LSAs, plumber referral, adjuster, storm vendor, website form. If you cannot name the source, you cannot feed it.
CPL. Spend divided by leads. Cheap sewage-marketplace names are not cheap if three other trucks have the same address.
Booking rate. Qualified conversations that become a crew on site. This is where two-ring failures hide. Visibility looks fine. The night board leaked.
Close rate. On-site inspections that become authorized work. Weak close is a estimator and documentation problem, not an ads problem.
Revenue per new job. A $400 extract and a $14k sewage rebuild cannot share one “average ticket” if you are deciding what to spend to win the next one.
Read the pattern, not one cell
Leads down, CPL up, booking and close steady: visibility. Leads fine, booking weak: intake. Volume up, ticket down: you bought the wrong work. Do not kill SEO because Tuesday was dry. Do not buy more ads because the CSR lets forms sit until morning.
Start with a sheet. Source, date, booked yes/no, closed yes/no, invoice. Split water, mold, and fire when you can. The five numbers are the implementation. The software can wait.
Pressure washing is easy to start, so everyone starts it, so price becomes the product. The better home-service bets are the ones that require a license. Mold in the walls is not a Facebook-marketplace job. The homeowner pays the licensed crew and rarely negotiates in a smaller market.
Restoration has both layers. Unlicensed “we dry houses” crews will always undercut a Category 1 extract. That is not your race. IICRC S500/S520, state mold licenses, documented meters, and a paper trail the adjuster can read are why a 2 a.m. sewage job does not get three quotes.
Put the credentials on the pin, the header, and the service page. Then do the work those credentials claim. Price holds when the alternative looks like a shop vac and a prayer.
Inspired by Noah Igler (@noahiglerSEO). Original post: stop trusting one company-wide ROAS past $5M. This is a new Tygart article for restoration contractors. We kept the mechanism, added first-party field knowledge, and did not reprint the thread.
Dallas sewer and Plano drain clears are different businesses in one dashboard. Restoration does the same thing with one number labeled “marketing ROAS.” A cheap extract can look busy while sewage and fire are paying the trucks — or the reverse.
Grid it. Services down the left: water mitigation, sewage, mold, fire/smoke, pack-out, rebuild. Markets across the top. For each cell: spend, qualified calls, booked jobs, gross profit, close rate, average ticket, Maps coverage, crew capacity.
The next dollar goes where demand, margin, close rate, and a free crew line up. Blended ROAS is how shops keep buying the wrong zip.
Inspired by Bodhi (@irentdumpsters). Original post: buying Angi leads is renting customers. This is a new Tygart article for restoration contractors. We kept the mechanism, added first-party field knowledge, and did not reprint the thread.
The mechanism is simple. A marketplace sells the same name to three or four companies. You bid against shops that already have the same address. The homeowner has no loyalty to any of you. An organic call is the opposite: they searched, found your listing, and dialed one number.
Restoration already lives inside that product. Storm-lead vendors, shared water platforms, and some TPA overflows work the same way as Angi. You paid for a name that two other trucks also have. The first crew that answers and can roll wins. The other two paid for a conversation that never happens.
What “own the lead” means on a water job
Maps, Apple Business Connect, and a tap-to-call page you control.
A plumber, roofer, or property manager who sends you the loss because last time you documented it cleanly.
A commercial agreement that does not reset every storm.
A review file that makes the next homeowner tap you instead of the shared list.
Rented leads can fill a dry week. They should not be the growth plan. Every dollar that only rents a name is a dollar that is not building the pin, the photo file, or the referral source you still have in October.
Measure close rate by source. If marketplace water closes at half of Maps water, that is not a sales problem. That is three trucks on the same driveway.
Restoration pricing is the most misunderstood part of running a restoration company. Owners argue about Xactimate rates, complain about insurance carriers, and chase competitor pricing — while quietly losing money on jobs they think are profitable. The problem isn’t usually the rates. It’s that most restoration companies don’t actually know what their work costs them.
This guide walks through how restoration pricing actually works in 2026: Xactimate fundamentals, when to use time and material versus fixed bids, where margin leaks happen, what healthy profit margins look like, and the financial math that separates the operators who scale from the ones who stay stuck.
The two pricing systems restoration uses
The two pricing systems restoration actually uses.
Almost all restoration work is priced one of two ways. Xactimate pricing dominates insurance work — line items at published unit rates, with regional pricing that updates quarterly, plus overhead and profit added on top. Time and material (T&M) is used for non-insurance work, certain commercial losses, and emergency mitigation where scope is unknown — billed by labor hour and materials at marked-up cost.
Most restoration companies use both depending on the job. Residential insurance mitigation and reconstruction is almost always Xactimate. Commercial losses with sophisticated buyers often allow T&M or hybrid pricing. Out-of-pocket residential work (mold remediation that isn’t covered, biohazard cleanup, certain reconstruction) is typically T&M or fixed-bid.
How Xactimate pricing actually works
Xactimate is a software platform owned by Verisk that contains a database of construction line items priced by region. Each line item has a labor component, a material component, and an equipment component. Pricing updates quarterly and is based on regional cost surveys. The pricing the carrier sees and the pricing you see should be identical — Xactimate is “single price database” for both sides.
The actual price of a job is the sum of all line items, plus overhead and profit (O&P), typically 10% and 10% (for 21% combined when multiplied), added on top when the job involves three or more trades or specific complexity criteria carriers recognize. Whether O&P is approved is one of the most contested issues in restoration pricing — many carriers and TPAs push back hard, and operators need to know the documentation to defend it.
Time and material pricing
T&M pricing bills labor at an hourly rate and materials at a marked-up cost. Healthy restoration T&M rates in 2026 run $75-$110/hour for technicians, $95-$140/hour for lead technicians, and $135-$195/hour for project managers, depending on market and certification level. Material markup typically runs 25-50% over cost. Equipment rental (dehumidifiers, air movers, HEPA filtration) is billed by day at established rates.
The advantage of T&M is no price disputes — you bill what it actually took. The disadvantage is the customer needs to trust your hours, and you need rigorous time tracking. Without disciplined timekeeping, T&M jobs become arguments about “what could it have possibly taken that long for?”
The two big places margin gets lost
Where margin gets lost — without sticky dollar stickers.
Restoration companies don’t lose margin on the rates — they lose it in two specific places. First, missed scope. The job estimate doesn’t capture all the affected materials. The carrier pays the original estimate. The actual work takes longer and uses more material than estimated. Loss.
Second, weak supplements. When additional damage is discovered (almost always the case in restoration), supplements need to be written, documented, and submitted. Companies with weak estimating and slow supplement processes leave 5-15% of revenue on the table on every insurance job. Companies with disciplined supplement processes capture every dollar of legitimate scope.
Healthy profit margin benchmarks
Industry-healthy gross margins by service line: water mitigation 45-60%, reconstruction 25-40%, mold remediation 50-65%, fire and smoke restoration 35-50%, contents cleaning and pack-out 40-55%, commercial large loss highly variable but generally 20-35%. Net margin (after overhead) for a healthy restoration company runs 8-15% of revenue. Companies under 5% net are usually one bad month away from cash crisis. Companies above 18% are either very small, very specialized, or under-investing in growth.
The job costing discipline most restorers skip
Job costing discipline most restorers skip.
You cannot manage profit margins you can’t measure. Real job costing means tracking, per job: estimated revenue, actual revenue (including supplements), labor hours and dollars actually spent, material costs actually incurred, equipment days and rental cost, subcontractor cost, and overhead allocation. The output is a per-job gross margin number. Pulling this report monthly and identifying jobs that lost money — and why — is how operators improve pricing over time.
Most restoration companies skip this because the data is messy and the spreadsheets are painful. The companies that automate it (with restoration-specific software like Restoration Manager, Xactimate, Encircle, or DASH) have a structural advantage that compounds.
How to handle the “your competitor charges less” objection
This objection appears constantly. The honest answer: most price differences in restoration are scope differences, not rate differences. Xactimate rates are the same across all contractors in a region — your competitor isn’t using a cheaper Xactimate. They’re either writing less scope, missing items that you’d catch, or planning to supplement aggressively later. Walk the customer through the scope comparison line by line. Often the price gap closes or reverses.
Pricing strategy by service line
Water mitigation is almost always Xactimate. The leverage is in writing complete drying chamber configurations, accurate equipment days, and complete demolition scope. Reconstruction is Xactimate with discipline around overhead and profit, change orders, and supplements. Mold remediation can be Xactimate when insurance covers it, T&M or fixed bid when it doesn’t — pricing requires careful scope documentation due to liability. Fire and smoke is Xactimate, with significant supplement opportunity around contents, deodorization, and structural cleaning. Biohazard and trauma cleanup is typically T&M or fixed bid with hazard premiums.
The national average for residential water damage restoration in 2026 ranges from $1,500 for a small Category 1 (clean water) loss to $40,000+ for a large Category 3 (sewage) loss requiring extensive demolition and reconstruction. Most insurance-covered water mitigation jobs fall in the $3,000-$8,000 range. Pricing is calculated using Xactimate line items based on affected square footage, equipment days, demolition scope, and reconstruction needs.
What profit margin should a restoration company make?
Healthy gross margin benchmarks: water mitigation 45-60%, reconstruction 25-40%, mold remediation 50-65%, fire restoration 35-50%, commercial large loss 20-35%. Net margin (after overhead) for a profitable restoration company typically runs 8-15% of revenue. Companies below 5% net margin are at financial risk; companies above 18% are usually small, specialized, or under-investing in growth.
What is overhead and profit in restoration?
Overhead and profit (O&P) is typically a 10% + 10% addition on top of the line-item subtotal in Xactimate, applied when a job involves three or more trades or meets carrier complexity criteria. The 10% overhead covers indirect costs like supervision, office, and equipment depreciation; the 10% profit is the contractor’s profit margin. Whether O&P is approved is frequently disputed by carriers and TPAs, and proper documentation is required to defend it.
Should restoration jobs be priced T&M or Xactimate?
Insurance work is almost always Xactimate because that’s what carriers will adjust to. Out-of-pocket residential work, certain commercial losses, and unscoped emergency mitigation are often better priced as time and material. The dividing line is typically whether a third-party payer (insurance carrier or TPA) is involved.
What is the labor rate for restoration technicians?
Healthy 2026 T&M billing rates: technicians $75-$110/hour, lead technicians $95-$140/hour, project managers $135-$195/hour. These vary by region and certification level. Insurance work uses Xactimate’s regional labor rates rather than billed hourly rates, with the labor component embedded in each line item.
How do restoration companies make more money on jobs?
The two highest-leverage activities are complete initial scoping (capturing every affected material in the original estimate) and disciplined supplementing (writing and submitting supplements promptly when additional damage is discovered). Companies with rigorous estimating and supplement processes capture 5-15% more revenue per insurance job than companies that don’t.
Water damage restoration pricing is where most operators bleed the most money — not because they charge too little on the headline number, but because they miss line items, mis-categorize equipment, and accept reductions they could have defended. This guide walks through the pricing framework profitable restoration companies use for both insurance and cash water jobs.
If you have not worked through the full pricing playbook yet, start with our restoration pricing and estimating master guide to understand how water pricing fits into the larger estimating system.
Why Water Damage Pricing Is Different
Why water damage pricing is different.
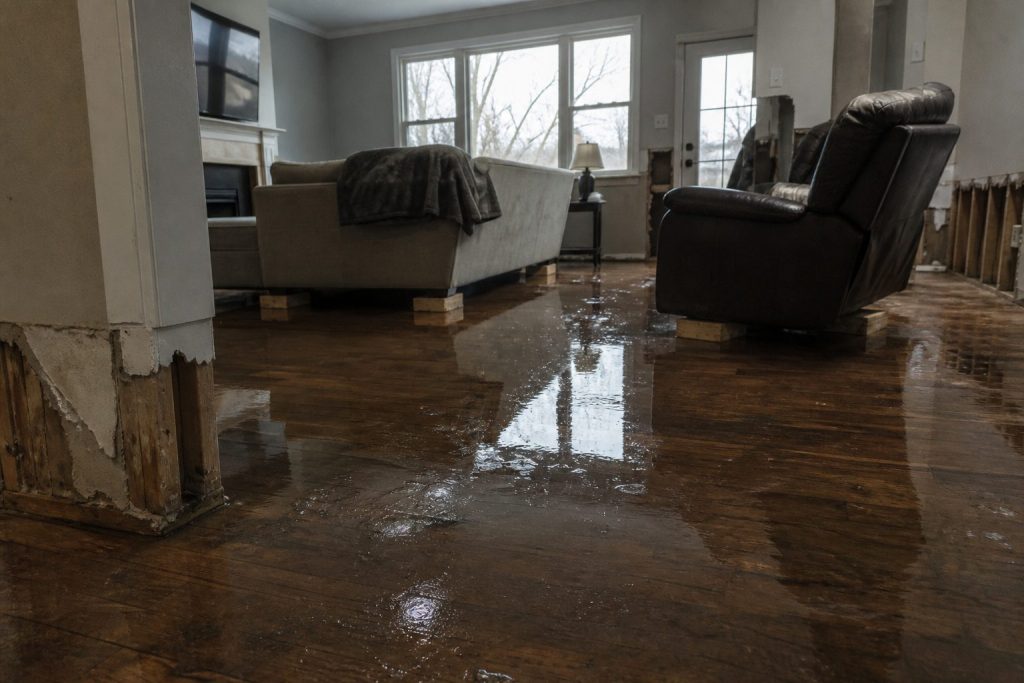
Water damage is the highest-volume and highest-frequency loss type for most restoration companies, which makes it the line where pricing discipline pays the biggest compounding return. Unlike fire or mold, water jobs are highly repeatable, which means small per-job pricing improvements multiply across hundreds of jobs per year.
Three things make water pricing distinct: equipment scaling drives a meaningful portion of the invoice, the daily monitoring schedule has to be defensible, and TPA programs scrutinize water claims more aggressively than any other category. Get any one of those three wrong and you are giving away gross profit.
The Core Water Damage Line Item Stack
Core water damage line-item stack.
Every water damage estimate should be built from the same core stack so nothing gets missed:
Emergency service charge — after-hours response, mobilization, initial assessment
Water extraction — by category and class, with documented affected square footage
Content manipulation — pack-out, block-up, content cleaning where applicable
Equipment removal — final demob and post-dry verification
Operators who win on water pricing have a checklist that runs through this stack on every estimate. Operators who lose pick and choose, miss line items, and discover the gap on the back-end when the job is closed out.
Equipment Pricing: The Single Biggest Margin Lever
Equipment pricing — the biggest margin lever.
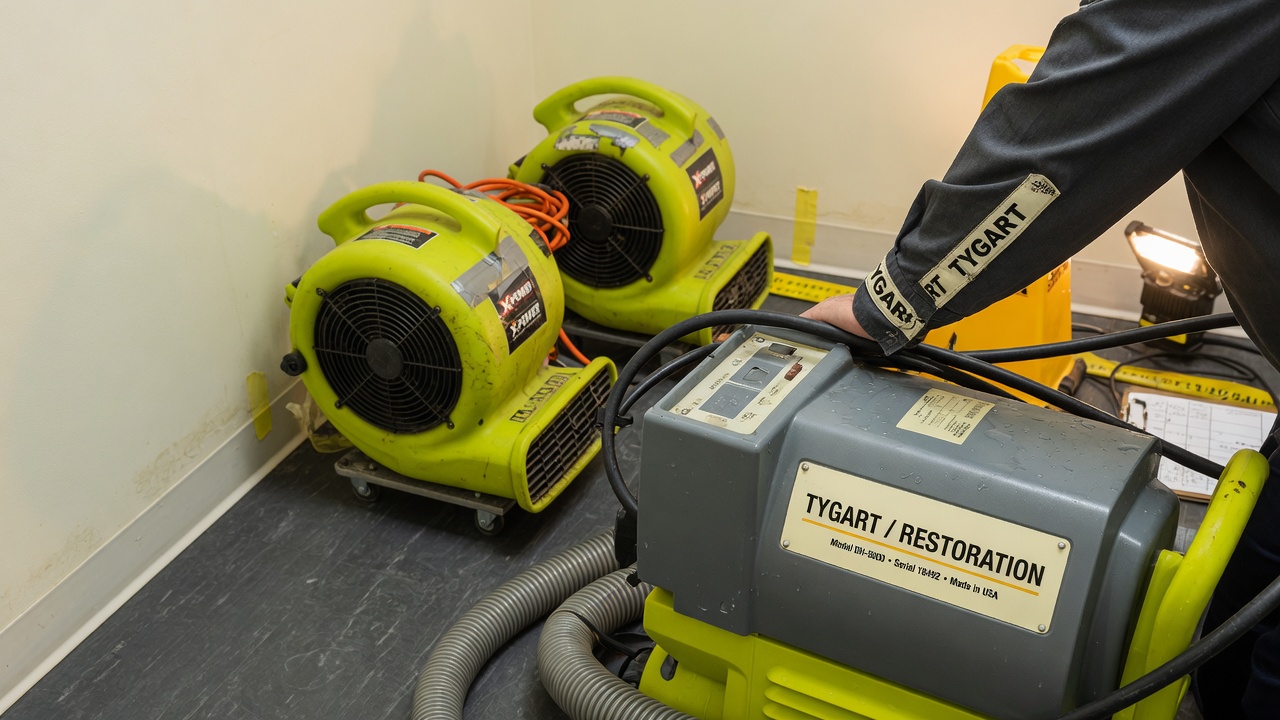
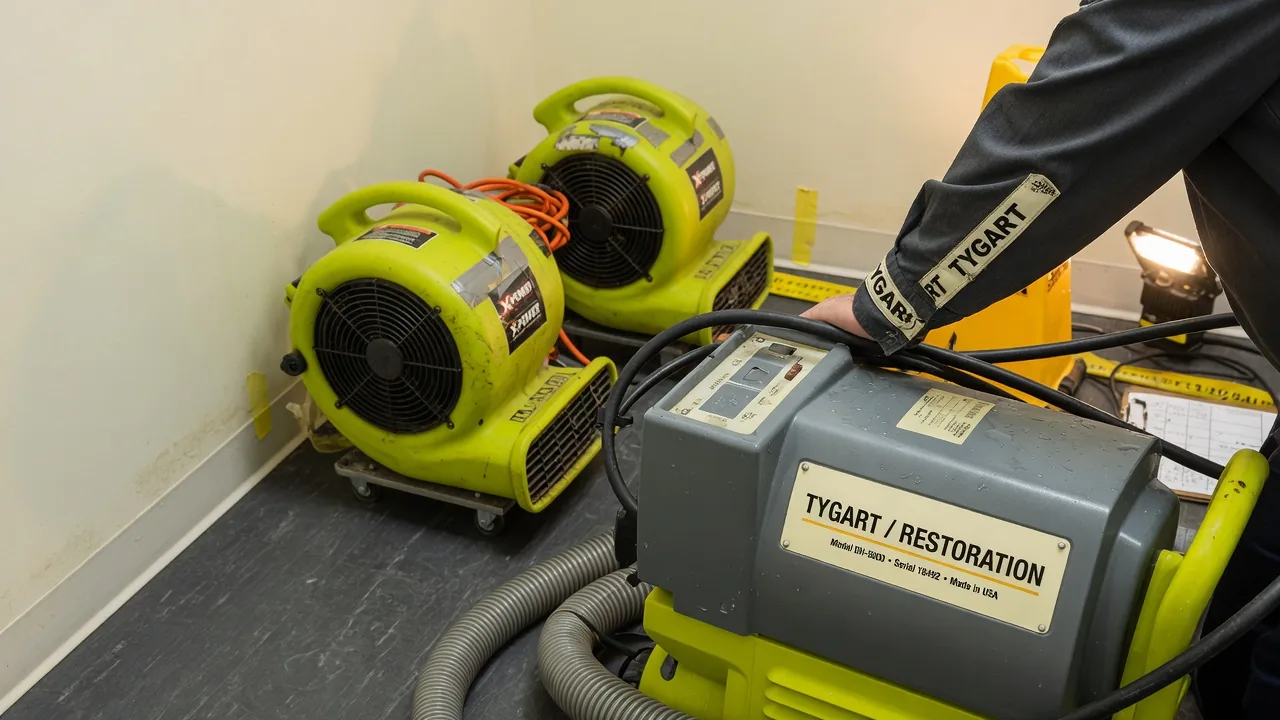
Drying equipment is where the largest pricing gap exists between operators who know the rules and operators who guess. Insurance pricing for air movers and dehumidifiers is daily, but the daily count must reflect actual on-site days, not contract days. Documenting equipment placement with photos, equipment counts on the daily monitoring sheet, and removal dates protects every dollar.
The other equipment trap is dehumidifier sizing. Pricing matrices reimburse based on dehumidifier class (LGR, conventional, desiccant), so misidentifying equipment in the estimate creates either a write-off or an invoice dispute. Always document model numbers and class on the equipment log.
Category and Class: The Foundation Most Estimates Skip
Water loss category (1, 2, or 3) and water loss class (1 through 4) drive the pricing for almost every line item on the estimate. Operators who skip the category and class documentation in favor of “just running the numbers” leave money on every job because TPA reviewers will downgrade ambiguous loss types.
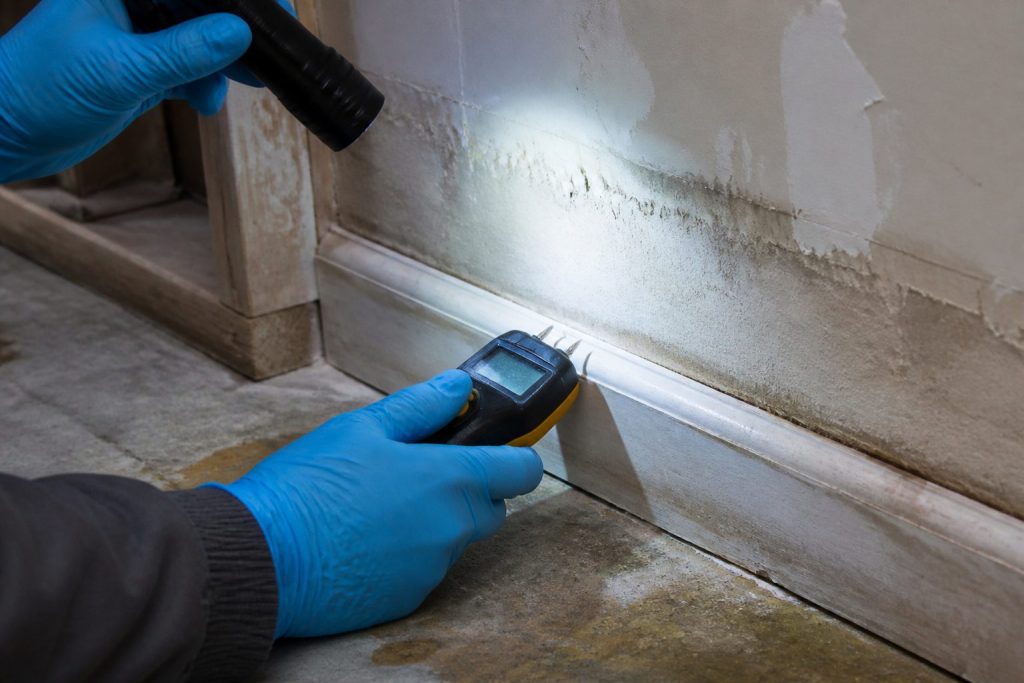
The fix is operational: document category and class on the initial moisture map, photograph contamination evidence for Cat 2 and Cat 3 losses, and reference the IICRC S500 standard in the scope notes. This single practice closes the most common gap between estimated and approved invoices.
Cash vs Insurance Water Pricing
Cash water jobs let you price for value rather than against a matrix, but they also expose you to objections you do not get on insurance work. The right cash pricing strategy is a tiered estimate: a “complete dry-out” option, a “structural-only” option, and a “you handle the contents” option. This converts more leads at higher margin than a single take-it-or-leave-it number.
For insurance work, the discipline is different: build to the matrix, document everything, and never accept a reduction without a written explanation referencing a specific line item. Most reductions are habit; they evaporate when challenged.
Common Pricing Mistakes That Cost Real Money
Across hundreds of restoration audits, the same mistakes appear repeatedly. Under-counting affected square footage on the moisture map. Forgetting antimicrobial on Cat 1 losses where it is still warranted. Missing the second floor when water migrated up. Pricing a single air scrubber for a multi-room job. Skipping the daily monitoring line on quick-dry jobs. Each of these costs $200 to $2,000 per job, and they happen on most estimates that are not built from a checklist.
What is the average price of a water damage restoration job?
Average residential water damage jobs in the U.S. fall between $3,000 and $7,500 depending on category, class, and affected square footage. Commercial jobs average $8,000 to $40,000+. National averages are useful as a sanity check but should never be used as a pricing target — every estimate should be built line by line from the actual scope.
Should I use Xactimate pricing for cash water jobs?
You can use Xactimate pricing as a baseline reference for cash jobs, but cash work should be priced for value, not against a TPA matrix. Most operators find that using Xactimate as a floor and then layering in tiered options produces 20 to 35 percent higher gross margin on cash work than pure matrix pricing.
How do I defend my water damage pricing to insurance adjusters?
Defensible water pricing rests on three documents: a labeled moisture map, daily monitoring sheets with equipment counts and moisture readings, and category/class documentation tied to IICRC S500. With those three documents, almost every line item is defensible, and reductions are rare.
What line items get cut most often on insurance water claims?
The most commonly reduced items are equipment days (cut to “industry standard”), antimicrobial application (challenged on Cat 1), content manipulation (cut as overhead), and after-hours service charges. Each can be defended with documentation, and most reductions are reversed when the operator pushes back with specifics.
How often should I update my water damage pricing?
Pricing matrices update quarterly, so any operator pulling from Xactimate or Symbility should refresh their estimating templates four times a year. Cash pricing should be reviewed at least twice a year against local labor and material costs. Operators who do not update pricing routinely find themselves losing margin to inflation they never adjusted for.
Fire and smoke restoration jobs are the highest-margin work in residential restoration, but only when priced correctly. The estimating mistakes that cost a few hundred dollars on a water job will cost five figures on a fire job, because the scope is broader, the equipment is more specialized, and the deodorization process has more legitimate billable hours than most operators capture.
This guide assumes you have read the restoration pricing master guide and understand the fundamentals of estimate construction. Here we focus on what makes fire pricing different.
Structure, Contents, and Deodorization Are Three Separate Estimates
Structure, contents, and deodorization are three estimates.
The single biggest pricing improvement most restoration companies can make on fire jobs is treating structure cleanup, contents cleaning, and deodorization as three discrete scopes with three discrete estimates. Operators who roll everything into one estimate consistently under-price the contents and deodorization portions because the structure work feels like the visible deliverable.
The right model is three sequential workstreams: structure cleaning and demolition, pack-out and contents processing at your facility, and final deodorization with verification testing. Each gets its own estimate, its own crew, and its own milestone billing.
Structure Pricing for Fire Damage
Structure pricing on fire jobs starts with smoke and soot category (light, medium, heavy, or “wet smoke” from synthetic combustion). Each category drives a different cleaning approach and a different price per square foot. Documenting the category with photos at intake protects pricing throughout the job.
Core structure line items include: HEPA vacuuming, dry-sponge cleaning, wet cleaning with chemical sponges, drywall and texture removal, char removal, framing brushing, and seal-coating with shellac-based primer. Most fire estimates miss the seal-coating line, which alone is often a $1,500 to $5,000 omission on a residential job.
Contents Pricing: The Highest-Margin Line on the Job
Contents pricing — often the highest-margin line.
Contents cleaning is where the best restoration companies generate a disproportionate share of their fire job profit. The discipline is treating contents as a per-room or per-cubic-foot line, not a flat fee. Pack-out, transport, processing, storage, and pack-back each have their own unit pricing, and each must be on the estimate.
Specialty contents — electronics, art, textiles, leather, soft goods — should always be flagged as separate line items priced at specialty rates. Operators who lump these into general contents cleaning consistently lose money on the highest-touch items in the home.
Deodorization: Five Stages, Five Line Items
Deodorization — five stages, five line items.
Deodorization is not “ozone for three days.” Proper fire deodorization is a five-stage process, and each stage is billable: source removal, surface cleaning, sealing of porous materials, atmospheric treatment (ozone, hydroxyl, thermal fogging), and verification with re-occupancy testing. An estimate that shows one line for “deodorization” is leaving 60 to 80 percent of the legitimate billable work off the document.
Operators who break out the five stages typically see deodorization revenue per job double versus operators who roll it into a single line.
Equipment-Heavy Line Items
Fire jobs require more specialized equipment than water jobs: HEPA negative air machines, hydroxyl generators, ozone generators, ULV foggers, thermal foggers, and ultrasonic content cleaners. Each piece of equipment has its own daily rate, and each daily rate must be on the estimate when the equipment is on the job.
Cash Fire Jobs vs Insurance Fire Jobs
Cash fire jobs are rare but high-margin when they appear. The pricing strategy mirrors cash water work: tiered options, value framing, and walk-away discipline. Insurance fire jobs are about scope completeness and documentation. The largest fire job reductions come from missing scope items on the original estimate, not from line-item haggling.
What is the average price of a fire damage restoration job?
Residential fire jobs average $12,000 to $50,000 for partial losses, with major fire losses ranging from $50,000 to $200,000+ when full structure cleanup is involved. Commercial fire jobs commonly exceed $100,000. The wide range reflects the variation in smoke category, contents value, and structural damage.
Should fire damage estimates be itemized or lump-sum?
Always itemized. Lump-sum fire estimates are nearly always under-priced because they hide line items the estimator forgot to include. Itemized estimates also defend better to TPA review and give the homeowner clarity on what they are paying for.
How do I price contents pack-out for fire jobs?
Contents pack-out should be priced per cubic foot with separate line items for transport, processing labor, storage time, and pack-back. The Xactimate pack-out matrix is a starting point; most operators find they need to layer specialty handling charges on top for electronics, art, and textiles.
Is ozone treatment enough for smoke deodorization?
No. Ozone is one of five legitimate deodorization stages. Source removal, surface cleaning, sealing of porous materials, atmospheric treatment, and verification testing are the full process. Operators relying only on ozone consistently see callbacks and re-treatment requests.
What gets cut most often from fire damage estimates?
The most commonly reduced fire line items are HEPA equipment days, seal-coating after demolition, contents specialty cleaning charges, and multi-stage deodorization beyond a single ozone treatment. Each can be defended with proper documentation of scope and method.
Mold remediation pricing differs from water and fire pricing in one crucial way: the work is governed by a written remediation protocol from a third-party assessor, which means every line item on the estimate has to map to a specific protocol requirement. Operators who price mold like a water job consistently under-bill, take on liability they did not price for, or get reductions because the protocol does not match the estimate.
For broader pricing context, see our restoration pricing master guide. Here we focus on the specific line-item structure that wins on mold work.
Start with the Protocol, Not the Estimate
Start with the mold protocol, not the estimate.
The remediation protocol from the Indoor Environmental Professional (IEP) is the source document for the entire estimate. Every line item — containment level, PPE class, antimicrobial type, equipment count, demolition extent, clearance criteria — must reference the protocol. Estimates that deviate from the protocol either lose work to a more compliant competitor or fail clearance and require costly re-work.
The first thing to do with any mold job is read the protocol and build the estimate against it line by line.
Containment Is the Largest Single Cost on Most Jobs
Containment is usually the largest single cost.
Containment is where most mold estimates either succeed or fail. The IICRC S520 standard defines four containment levels: limited, source, full, and full with decontamination chamber. Each level has dramatically different labor and material costs, and each must be priced for the actual containment built, not the easiest one to install.
Core containment line items include: poly sheeting (6-mil minimum), zipper doors, negative air machine setup, decontamination chamber framing, HVAC isolation, and signage. Each of these has its own labor and material line.
PPE Is a Real Line Item, Not Overhead
PPE is a real line item — not buried overhead.
PPE for mold work is consumable, single-use, and required by protocol. Estimates that bury PPE in overhead lose 5 to 10 percent of the legitimate billable work per job. The right approach is per-technician, per-day PPE pricing for tyvek suits, full-face respirators with HEPA cartridges, gloves, and boot covers. Document the technician count and day count, and PPE flows naturally from the labor schedule.
Antimicrobial and HEPA Vacuuming
Antimicrobial application has three legitimate billable variants: spray-applied, fog-applied, and wipe-down. Each is a different rate per square foot. HEPA vacuuming of all surfaces in the affected area is a separate line, billed per square foot of surface area (not floor area, which is the most common pricing mistake).
Demolition and Disposal
Mold demolition is more aggressive than water demolition because the protocol typically requires removal of all visibly contaminated materials plus a buffer zone (often 12 to 24 inches beyond visible growth). Pricing must reflect the protocol’s demolition extent. Disposal is also more expensive: contaminated materials must be double-bagged in 6-mil poly and disposed of as Category III contamination.
Equipment: HEPA Air Scrubbers and Negative Air
HEPA air scrubbers run for the duration of containment plus typically 24 to 48 hours after demolition is complete. Negative air machines maintain pressure differential during containment. Both are billed daily, and both must be documented on the daily log to support invoicing.
Clearance Testing and Re-Occupancy
Clearance testing is performed by the IEP, not the remediator, but the remediator must price for re-cleaning if the initial clearance fails. Building this contingency into the estimate as a separate line item — “clearance failure re-cleaning, billable if required” — protects margin and sets expectations with the homeowner.
What is the average price of a mold remediation job?
Residential mold jobs average $2,500 to $15,000 depending on containment level and affected area. Severe contamination involving HVAC systems or whole-home remediation can exceed $30,000. Commercial mold projects routinely run $10,000 to $100,000+.
Why is mold remediation so much more expensive than water damage?
Mold work requires full PPE, more aggressive demolition, full containment, HEPA equipment, third-party protocol compliance, and clearance testing — none of which are required on standard water damage. The labor and disposal costs are roughly 2 to 3 times higher per affected square foot than equivalent water work.
Should mold pricing be tied to Xactimate?
Mold work performed for insurance carriers typically uses Xactimate or Symbility pricing. Cash mold work should be priced for value with tiered options. Operators doing significant cash mold volume often build their own internal pricing matrix referenced against current Xactimate values.
What gets reduced most often on mold estimates?
The most commonly reduced items are containment labor (cut as overhead), PPE charges (rolled into labor), HEPA equipment days, and antimicrobial application area. Each is defensible when the estimate ties back to the protocol and the daily log documents the actual work performed.
Do I need an Indoor Environmental Professional for every mold job?
Not legally in every state, but the best practice — and the only way to avoid liability — is to require an IEP-written protocol for any mold job exceeding 10 square feet of contamination. The IEP also performs the clearance test, which protects the remediator from re-call disputes.
The Signal — Tygart Media's weekly brief. What we actually ran, what it measured, and what it means for a restoration shop.