Inspired by CustomerFlows. Original article: How to Track Marketing ROI as a Contractor (No Marketing Team). This is a new Tygart article for restoration contractors. We kept the mechanism, added first-party field knowledge, and did not reprint the piece.
Most shops know what they spent on ads and what they invoiced. The gap between those two numbers is guesswork. The original system is three steps and does not need a marketing department: tag every lead, keep the tag until the job is won or lost, compare revenue and spend on the first of the month.
Restoration sources worth a field
Google Ads / LSAs
Organic / Maps
Plumber or roofer referral
Adjuster or TPA
Property manager
Storm-lead vendor
Yard sign / truck wrap
“How did you hear about us?” when none of the above fire
If the source is blank, the lead is unattributable. Unattributable leads make every channel look the same. A spreadsheet works until volume breaks it. A CRM is better because the tag has to survive from the night board to the invoice.
ROI is (closed revenue minus spend) divided by spend, by source. The original example is the owner who almost killed direct mail because it felt expensive — it was the second-best channel. Restoration version: the plumber list looks free and the marketplace leads look busy. One of those is usually lying. Monthly, not yearly. Weather moves the numbers too fast for an annual glance.
Clicks are not ROI. A $25 shared water lead that never books costs more than a $90 Maps call that becomes a sewage job. Cost per acquired customer is the number that should move the budget.
Most shops do not have a “no marketing” problem. They have a no-clarity problem. Ads, LSAs, the pin, a website from 2019, referrals from plumbers — when the board goes quiet everyone guesses. The original scorecard says you can run the company on five numbers: leads by source, cost per lead, booking rate, close rate, revenue per new job.
How those five read on a water job
Leads by source. Maps, LSAs, plumber referral, adjuster, storm vendor, website form. If you cannot name the source, you cannot feed it.
CPL. Spend divided by leads. Cheap sewage-marketplace names are not cheap if three other trucks have the same address.
Booking rate. Qualified conversations that become a crew on site. This is where two-ring failures hide. Visibility looks fine. The night board leaked.
Close rate. On-site inspections that become authorized work. Weak close is a estimator and documentation problem, not an ads problem.
Revenue per new job. A $400 extract and a $14k sewage rebuild cannot share one “average ticket” if you are deciding what to spend to win the next one.
Read the pattern, not one cell
Leads down, CPL up, booking and close steady: visibility. Leads fine, booking weak: intake. Volume up, ticket down: you bought the wrong work. Do not kill SEO because Tuesday was dry. Do not buy more ads because the CSR lets forms sit until morning.
Start with a sheet. Source, date, booked yes/no, closed yes/no, invoice. Split water, mold, and fire when you can. The five numbers are the implementation. The software can wait.
Inspired by Noah Igler (@noahiglerSEO). Original post: stop trusting one company-wide ROAS past $5M. This is a new Tygart article for restoration contractors. We kept the mechanism, added first-party field knowledge, and did not reprint the thread.
Dallas sewer and Plano drain clears are different businesses in one dashboard. Restoration does the same thing with one number labeled “marketing ROAS.” A cheap extract can look busy while sewage and fire are paying the trucks — or the reverse.
Grid it. Services down the left: water mitigation, sewage, mold, fire/smoke, pack-out, rebuild. Markets across the top. For each cell: spend, qualified calls, booked jobs, gross profit, close rate, average ticket, Maps coverage, crew capacity.
The next dollar goes where demand, margin, close rate, and a free crew line up. Blended ROAS is how shops keep buying the wrong zip.
The $200/Month Stack That Outperforms the $5,000/Month One
Most restoration companies either spend nothing on martech or throw $5,000+ at disconnected tools that don’t talk to each other. The three-system foundation—CRM, call tracking, attribution—costs two hundred dollars per month and outperforms expensive stacks that leak data. HubSpot adoption at 45.8% of B2B companies. Xactimate data integration is the competitive moat. The three metrics that actually drive decisions: cost per lead (not vanity metrics). Here’s the efficient stack.
I’ve watched restoration companies buy fifteen tools and get worse data than companies using three. Why? Tool sprawl. Everything disconnects. Data flows one way. Nobody knows which leads come from where.
The efficient martech philosophy is this: One system of truth. Everything feeds it. It answers one question: what does a lead actually cost?
The Foundational Three-System Stack
The foundational three-system stack.
System 1: CRM (HubSpot Free/Professional, or Salesforce Essentials). This is your system of truth. Every lead lives here. Every job is tracked here. Every customer is tracked here.
HubSpot’s free tier handles 5,000 contacts. Professional tier ($50/month) handles unlimited. For most restoration companies, the free tier is sufficient. The professional tier costs $50/month.
What it does: Stores all customer and lead data. Tracks job history. Records call notes. Tracks revenue per customer.
Cost: $50/month (Professional tier) or free (basic tier)
System 2: Call Tracking (Nimbla, CallRail, or Ringba). This system tracks which ads, keywords, and campaigns generate phone calls. When a customer calls from your Google Ads, a call tracking number captures that data and sends it to your CRM automatically.
Why? Because 70% of restoration customers call instead of fill out a form. If you don’t track calls, you don’t know which ads actually converted. You only see form submissions, which are 30% of your real conversion data.
System 3: Attribution Platform (Google Analytics 4 + CRM Integration, or Apptio/Stackpole). This system connects your marketing efforts to actual revenue. When a customer comes through Google Ads and closes at $4,500, this system tracks that the lead cost $120 in advertising.
Google Analytics 4 is free and integrates with HubSpot. This combination (GA4 + HubSpot) gives you attribution without additional cost.
Cost: $0 (if using GA4 + HubSpot native integration) to $200-400/month (if using dedicated attribution platform)
Total cost: $130-250/month. Most restoration companies use this stack and never pay more. All data flows to HubSpot. All decisions are made from one place.
Why This Stack Outperforms $5,000 Alternatives
Companies that buy expensive stacks typically buy separately:
The problem: These tools don’t talk to each other out of the box. You need engineers and custom integrations. Data lags by hours or days. Attribution is estimated, not measured. Decision-makers get conflicting data from different sources.
The restoration company with the $200 stack doesn’t have this problem. HubSpot = source of truth. Call tracking feeds it. Analytics feeds it. Revenue is entered manually or imported. All decisions are made from one dashboard.
Which stack makes faster, more accurate decisions? The $200 one.
The Xactimate Moat
The Xactimate moat.
Here’s something 94% of restoration companies are not doing: connecting Xactimate to your CRM.
Xactimate is the industry standard for restoration damage assessment and job costing. Almost every restoration company uses it. But most don’t connect it to their CRM to track:
Actual job cost vs estimated job cost
Average profit per job type
Time spent per square foot by restoration type
Customer profitability (some customers require more time/resources)
Companies that do this integration gain visibility into which jobs are actually profitable. Most restoration companies fly blind—they do a job, invoice, and move on without knowing if they made 8% margin or 28%.
Xactimate integrations are available through:
Direct Xactimate API integration (custom, requires developer work)
Zapier (free/paid automation platform that connects Xactimate to HubSpot)
Third-party platforms like Service Titan (which imports Xactimate data automatically)
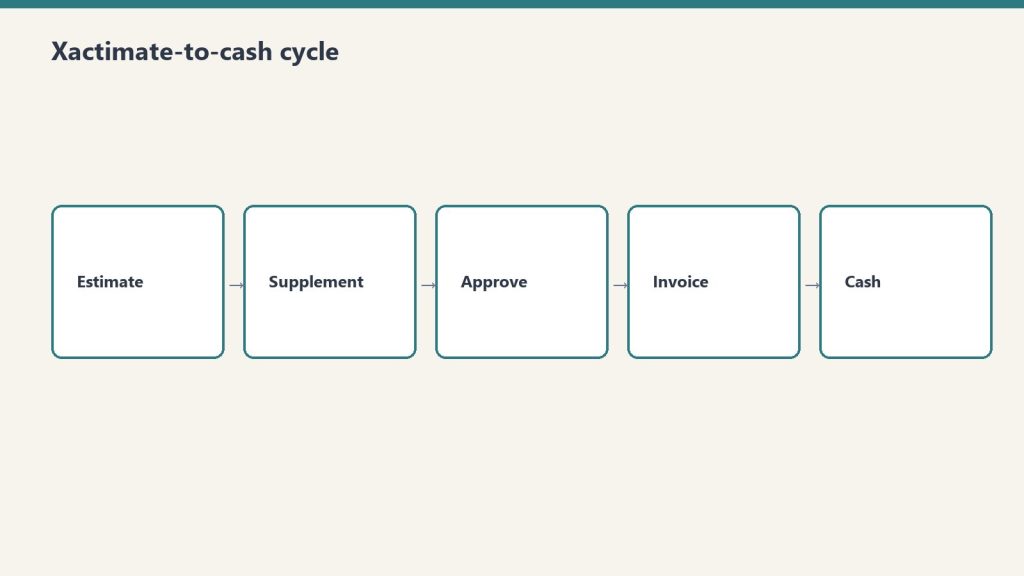
Setting up Xactimate-to-HubSpot integration via Zapier takes 4 hours. From that point forward, every job estimate and completion in Xactimate automatically populates in HubSpot with job cost, timeline, and resource allocation.
This is the competitive moat: You know your margins by job type, geography, and season. Competitors don’t. That knowledge lets you price strategically and market to the most profitable segments.
The Three Metrics That Matter
Most restoration companies track vanity metrics:
“We got 50 leads this month” (says nothing about quality)
“We spent $3,000 on ads” (says nothing about ROI)
“We have a 6.5% close rate” (industry average is 6-8%, so this is worthless)
The three metrics that actually drive decisions:
Cost Per Lead (CPL). Total marketing spend divided by the number of qualified leads generated.
If you spent $3,000 in advertising and generated 40 leads, your CPL is $75. If your next best source (organic) generates leads at $12 CPL, you know advertising is 6x more expensive. That knowledge drives your budget allocation.
Industry baseline for restoration CPL:
Google LSA: $95-280 CPL
Google Search Ads: $45-120 CPL
LinkedIn outreach: $0 CPL (free if you do it yourself)
Organic search: $0-15 CPL
Referrals (no tracking): $2-8 CPL (if you tracked them)
Cost Per Closed Job (CPCA). Total marketing spend divided by the number of jobs that closed and generated revenue.
If your CPL is $75 and your close rate is 65%, your CPCA is $115. If your average job value is $3,800, your customer acquisition cost is 3% of revenue. That’s healthy for restoration (industry average is 5-8%).
Revenue Per Dollar Spent (RPDS). Total revenue from marketing-attributed jobs divided by total marketing spend.
If you spent $5,000 in marketing and closed $87,000 in jobs, your RPDS is 17.4x. This is your business model’s health check. Anything above 6x is healthy. Below 3x means you’re overspending.
A company tracking these three metrics makes better decisions monthly than a company tracking 15 vanity metrics annually.
The Dashboard That Runs Your Business
The dashboard that runs your business.
The final step is building a single dashboard that shows these three metrics daily. HubSpot’s reporting dashboard can be set up in 2 hours:
Left side: Real-time leads count (today, week, month)
Center: CPL trending (is it getting cheaper or more expensive?)
Right side: Jobs closed and revenue (is your close rate holding?)
Check this daily. If CPL spikes, pause expensive channels until you understand why. If close rate drops, investigate your sales process. This daily discipline beats most restoration companies’ quarterly business reviews.
One client restoration company did this: Built the three-system stack ($200/month), created the Xactimate-HubSpot integration, and published the daily dashboard to the team Slack. Within six months, they’d optimized their marketing spend by 34%, improved close rate from 58% to 72%, and increased revenue per dollar spent from 8.2x to 13.7x.
Martech isn’t about having the fanciest tools. It’s about having the right questions answered daily.
AI-generated editorial illustration — Vertex AI Imagen 4 Standard
About this image. This image was generated by Google’s Vertex AI Imagen 4 model as the featured visual for The $200/Month Stack That Outperforms the $5,000/Month One. Every image in the Tygart Media visual library is AI-generated, converted to WebP for optimal performance, and enriched with IPTC/XMP metadata for search engine discoverability.
Model: Vertex AI Imagen 4 Standard (imagen-4.0-generate-001)
You’re spending $15,000 a month on marketing and you can’t tell me which channel produced your last ten jobs. That’s not a marketing problem. That’s a measurement problem. And it’s costing you more than the marketing itself.
The restoration industry runs on gut feeling and spreadsheets. Ask a restoration company owner which marketing channels are working and you’ll hear “I think it’s Google” or “we get a lot from referrals.” Ask them to prove it and the conversation ends. Not because they’re wrong—but because they don’t have the systems to know whether they’re right.
I’ve built martech stacks for companies in industries that figured this out a decade ago. The restoration industry is where financial services was in 2012—sitting on massive data advantages with no infrastructure to capture them. That’s the opportunity.
The Three-System Foundation
The three-system foundation.
Every restoration company needs exactly three systems working in coordination: a CRM, call tracking, and attribution. Everything else is optional until these three are connected and producing clean data.
CRM (Customer Relationship Management). HubSpot powers 45.8% of B2B martech stacks. Salesforce commands 42% market share. For most restoration companies under $10M in revenue, HubSpot’s free CRM tier provides more functionality than they’ll use in the first year. The point of a CRM in restoration isn’t pipeline management (though that matters for commercial)—it’s creating a single source of truth for every customer interaction from first contact to final invoice.
Call tracking. In restoration, 70-80% of leads come by phone. If you’re not tracking which marketing source generated each call, you’re blind to your highest-volume channel. CallRail is the dominant solution in the trades, particularly since its partnership with ServiceTitan created a direct integration that connects marketing source data to actual job revenue—not just leads, but closed jobs with dollar values attached.
Attribution. Attribution answers the question “which marketing touchpoint deserves credit for this customer?” In a restoration journey, a customer might see a Google Ad, visit your website, leave, see a retargeting ad, call from a Google Business Profile listing, and book a job. Without attribution, you credit GBP. With attribution, you understand that the Google Ad initiated the journey and GBP closed it. Those are fundamentally different strategic insights.
The ServiceTitan-CallRail Integration: Why It Matters
The CallRail-ServiceTitan integration is the most significant martech development for the restoration industry in recent years. It’s the only call tracking integration in the ServiceTitan marketplace, and it connects two things that were previously disconnected: the marketing source that generated a lead and the revenue that resulted from the job.
Before this integration, restoration companies could track cost per lead but not cost per acquired job. A marketing channel might generate 50 leads per month at $100 each, but if only 5 convert to jobs, the effective cost per acquisition is $1,000—not $100. Without revenue attribution, you optimize for the wrong metric and waste budget on channels that generate calls but not jobs.
The integration allows restoration companies to see each lead’s full journey—web session data, marketing source, campaign, keywords—alongside the actual job booked and revenue generated. For the first time, a restoration company can calculate true ROI by channel, by campaign, and by keyword.
Google Analytics 4: What It Actually Tells You (And What It Doesn’t)
GA4 replaced Universal Analytics and most restoration companies are still confused by the transition. Here’s what matters: GA4 is an event-based analytics platform. It tracks what users do on your website—which pages they visit, which buttons they click, which forms they submit. It’s good at measuring website behavior. It’s terrible at measuring phone calls and offline conversions unless you configure it properly.
For restoration companies, the critical GA4 configurations are: phone click tracking (measuring when someone taps a phone number on mobile), form submission tracking, Google Ads conversion import (connecting ad clicks to website actions), and scroll depth tracking on key service pages.
Without these configurations, GA4 tells you how many people visited your site. With them, it tells you which visitors took actions that lead to revenue. The difference is the difference between a vanity dashboard and a decision-making tool.
Dashboard Design: What to Measure and What to Ignore
Dashboard design — what to measure and what to ignore.
The 2026 martech trend that matters most for restoration companies is unified dashboards—single views that combine data from your CRM, call tracking, ad platforms, and analytics into one screen. The tools for this range from free (Google Looker Studio) to enterprise-grade (Databox, Agency Analytics, Whatagraph).
The dashboard metrics that actually drive decisions for restoration companies:
Cost per acquired job by channel. Not cost per lead. Not cost per click. Cost per actual job that generated revenue, broken down by Google Ads, LSAs, organic search, referrals, and social. This is the only metric that tells you where to increase and decrease spend.
Lead-to-job conversion rate by source. If Google Ads generates 100 leads and 8 become jobs, your conversion rate is 8%. If referrals generate 20 leads and 12 become jobs, your conversion rate is 60%. This tells you where your sales process is strong and where it’s leaking.
Response time by lead source. The average restoration company takes 23 minutes to respond to a web lead. Companies that respond within 5 minutes convert at 3-4x the rate. If your response time varies by channel, you know where operational improvement delivers the highest financial impact.
Revenue per marketing dollar by channel (ROAS). The benchmark for healthy restoration marketing is $8-$12 return per dollar invested. Channels consistently below $5 need optimization or reallocation. Channels above $15 need more investment.
The Xactimate Data Advantage Nobody Uses
Every restoration company running Xactimate sits on a goldmine of pricing data that has direct marketing applications. Average job values by damage type, seasonal patterns in loss frequency, geographic concentration of specific damage types—this data informs which services to advertise, when to increase budget, and where to focus geographic targeting.
Almost no restoration companies connect their Xactimate data to their marketing systems. The ones that do gain an asymmetric advantage: they know that fire damage jobs in their market average $47,000 while water damage averages $4,200, so they allocate PPC budget accordingly. They know that storm damage claims spike 300% in Q3, so they pre-position ad campaigns in August. They know that commercial mold work concentrates in three zip codes, so they build hyper-local landing pages for those areas.
Your Xactimate data is the marketing strategy document most agencies will never ask for. Use it.
Building the Stack: Priority Order
Building the stack — priority order.
If you have nothing: Start with CallRail ($45/month) and HubSpot free CRM. Connect them. You now have call tracking with source attribution feeding into a CRM. That alone puts you ahead of 80% of restoration companies.
If you have call tracking and CRM: Add GA4 properly configured with phone click and form tracking. Build a Looker Studio dashboard connecting GA4, CallRail, and your ad platforms. You now have a unified view of marketing performance.
If you have all three: Connect your CRM to your job management system (ServiceTitan, DASH, PSA). Now you can track from first click to final invoice. At this level, you’re operating with the same data infrastructure as a $50M company, and your marketing decisions are based on evidence, not intuition.
The stack doesn’t have to be expensive. It has to be connected. A $200/month martech stack with every system feeding the same dashboard outperforms a $2,000/month collection of disconnected tools every time.
AI-generated editorial illustration — Vertex AI Imagen 4 Standard
About this image. This image was generated by Google’s Vertex AI Imagen 4 model as the featured visual for The Restoration Company’s Martech Stack: What to Measure, What to Connect, What to Ignore . Every image in the Tygart Media visual library is AI-generated, converted to WebP for optimal performance, and enriched with IPTC/XMP metadata for search engine discoverability.
Model: Vertex AI Imagen 4 Standard (imagen-4.0-generate-001)