Blog

  • AI Content Operations: How I Manage 27 WordPress Sites

    AI Content Operations: How I Manage 27 WordPress Sites

    The Lab · Tygart Media
    Experiment Nº 684 · Methodology Notes
    METHODS · OBSERVATIONS · RESULTS

    The question I get most often from restoration contractors who’ve seen what we build is some version of: how is this possible with one person?

    Twenty-seven WordPress sites. Hundreds of articles published monthly. Featured images generated and uploaded at scale. Social media content drafted across a dozen brands. SEO, schema, internal linking, taxonomy — all of it maintained, all of it moving.

    The answer is an architecture I’ve come to call Split Brain. It’s not a software product. It’s a division of cognitive labor between two types of intelligence — one optimized for live strategic thinking, one optimized for high-volume execution — and getting that division right is what makes the whole system possible.

    The Two Brains

    The Split Brain architecture has two sides.

    The first side is Claude — Anthropic’s AI — running in a live conversational session. This is where strategy happens. Where a new content angle gets developed, interrogated, and refined. Where a client site gets analyzed and a priority sequence gets built. Where the judgment calls live: what to write, why, for whom, in what order, with what framing. Claude is the thinking partner, the editorial director, the strategist who can hold the full context of a client’s competitive situation and make nuanced recommendations in real time.

    The second side is Google Cloud Platform — specifically Vertex AI running Gemini models, backed by Cloud Run services, Cloud Storage, and BigQuery. This is where execution happens at volume. Bulk article generation. Batch API calls that cut cost in half for non-time-sensitive work. Image generation through Vertex AI’s Imagen. Automated publishing pipelines that can push fifty articles to a WordPress site while I’m working on something else entirely.

    Building Something Like This?

    If you are trying to run a multi-site or multi-client operation with Claude, I am probably three steps ahead of wherever you are stuck.

    Email me what you are building and I will tell you what I would do differently if I were starting it today.

    Email Will → will@tygartmedia.com

    The two sides don’t do the same things. That’s the whole point.

    Why Splitting the Work Matters

    The instinct when you first encounter powerful AI tools is to use one thing for everything. Pick a model, run everything through it, see what happens.

    This produces mediocre results at high cost. The same model that’s excellent for developing a nuanced content strategy is overkill for generating fifty FAQ schema blocks. The same model that’s fast and cheap for taxonomy cleanup is inadequate for long-form strategic analysis. Using a single tool indiscriminately means you’re either overpaying for bulk work or under-resourcing the work that actually requires judgment.

    The Split Brain architecture routes work to the right tool for the job:

    • Haiku (fast, cheap, reliable): taxonomy assignment, meta description generation, schema markup, social media volume, AEO FAQ blocks — anything where the pattern is clear and the output is structured
    • Sonnet (balanced): content briefs, GEO optimization, article expansion, flagship social posts — work that requires more nuance than pure pattern-matching but doesn’t need the full strategic layer
    • Opus / Claude live session: long-form strategy, client analysis, editorial decisions, anything where the output depends on holding complex context and making judgment calls
    • Batch API: any job over twenty articles that isn’t time-sensitive — fifty percent cost reduction, same quality, runs in the background

    The model routing isn’t arbitrary. It was validated empirically across dozens of content sprints before it became the default. The wrong routing is expensive, slow, or both.

    WordPress as the Database Layer

    Most WordPress management tools treat the CMS as a front-end interface — you log in, click around, make changes manually. That mental model caps your throughput at whatever a human can do through a browser in a workday.

    In the Split Brain architecture, WordPress is a database. Every site exposes a REST API. Every content operation — publishing, updating, taxonomy assignment, schema injection, internal link modification — happens programmatically via direct API calls, not through the admin UI.

    This changes the throughput ceiling entirely. Publishing twenty articles through the WordPress admin takes most of a day. Publishing twenty articles via the REST API, with all metadata, categories, tags, schema, and featured images attached, takes minutes. The human time is in the strategy and quality review — not in the clicking.

    Twenty-seven sites across different hosting environments required solving the routing problem: some sites on WP Engine behind Cloudflare, one on SiteGround with strict IP rules, several on GCP Compute Engine. The solution is a Cloud Run proxy that handles authentication and routing for the entire network, with a dedicated publisher service for the one site that blocks all external traffic. The infrastructure complexity is solved once and then invisible.

    Notion as the Human Layer

    A system that runs at this velocity generates a lot of state: what was published where, what’s scheduled, what’s in draft, what tasks are pending, which sites have been audited recently, which content clusters are complete and which have gaps.

    Notion is where all of that state lives in human-readable form. Not as a project management tool in the traditional sense — as an operating system. Six relational databases covering entities, contacts, revenue pipeline, actions, content pipeline, and a knowledge lab. Automated agents that triage new tasks, flag stale work, surface content gaps, and compile weekly briefings without being asked.

    The architecture means I’m never managing the system — the system manages itself, and I review what it surfaces. The weekly synthesizer produces an executive briefing every Sunday. The triage agent routes new items to priority queues automatically. The content guardian flags anything that’s close to a publish deadline and not yet in scheduled state.

    Human attention goes to decisions, not to administration.

    What This Looks Like in Practice

    A typical content sprint for a client site starts with a live Claude session: what does this site need, in what order, targeting which keywords, with what persona in mind. That session produces a structured brief — JSON, not prose — that seeds everything downstream.

    The brief goes to GCP. Gemini generates the articles. Imagen generates the featured images. The batch publisher pushes everything to WordPress with full metadata attached. The social layer picks up the published URLs and drafts platform-specific posts for each piece. The internal link scanner identifies connections to existing content and queues a linking pass.

    My involvement during execution is monitoring, not doing. The doing is automated. The judgment — what to build, why, and whether the output clears the quality bar — stays with the human layer.

    This is what makes the throughput possible. Not working harder or faster. Designing the system so that the parts that require human judgment get human judgment, and the parts that don’t get automated at whatever volume the infrastructure supports.

    The Honest Constraints

    The Split Brain architecture is not a magic box. It has real constraints worth naming.

    Quality gates are essential. High-volume automated content production without rigorous pre-publish review produces high-volume errors. Every content sprint runs through a quality gate that checks for unsourced statistical claims, fabricated numbers, and anything that reads like the model invented a fact. This is non-negotiable — the efficiency gains from automation are worthless if they introduce errors that damage a client’s credibility.

    Architecture decisions made early are expensive to change later. The taxonomy structure, the internal link architecture, the schema conventions — getting these right before publishing at scale is substantially easier than retrofitting them across hundreds of existing posts. The speed advantage of the system only compounds if the foundation is solid.

    And the system requires maintenance. Models improve. APIs change. Hosting environments add new restrictions. What works today for routing traffic to a specific site may need adjustment next quarter. The infrastructure overhead is real, even if it’s substantially lower than managing a human team of equivalent output.

    None of these constraints make the architecture less viable. They make it more important to design it deliberately — to understand what the system is doing, why each component is there, and what would break if any piece of it changed.

    That’s the Split Brain. Two kinds of intelligence, clearly divided, doing the work each is actually suited for.


    Tygart Media is built on this architecture. If you’re a service business thinking about what an AI-native content operation could look like for your vertical, the conversation starts with understanding what requires judgment and what doesn’t.

    {
    “@context”: “https://schema.org”,
    “@type”: “Article”,
    “headline”: “Split Brain Architecture: How One Person Manages 27 WordPress Sites Without an Agency”,
    “description”: “Claude for live strategy. GCP and Gemini for bulk execution. Notion as the operating layer. Here is the exact architecture behind managing 27 WordPress sites as”,
    “datePublished”: “2026-04-02”,
    “dateModified”: “2026-04-03”,
    “author”: {
    “@type”: “Person”,
    “name”: “Will Tygart”,
    “url”: “https://tygartmedia.com/about”
    },
    “publisher”: {
    “@type”: “Organization”,
    “name”: “Tygart Media”,
    “url”: “https://tygartmedia.com”,
    “logo”: {
    “@type”: “ImageObject”,
    “url”: “https://tygartmedia.com/wp-content/uploads/tygart-media-logo.png”
    }
    },
    “mainEntityOfPage”: {
    “@type”: “WebPage”,
    “@id”: “https://tygartmedia.com/split-brain-architecture-ai-content-operations/”
    }
    }

    For operators ready to build

    You just read the playbook. We build it.

    The split-brain architecture on this page is not theoretical — it runs across 20+ live WordPress sites at Tygart Media right now. If you want this deployed for your content operation, we scope, build, and hand it off. Most engagements run 4-6 weeks.

    Talk to Will about your setup →

    Visual summary

    Editorial illustration for Split Brain Architecture: How One Person Manages 27 WordPress Sites Without an Agency - Tygart Media AI-generated visual
    AI-generated editorial illustration — Vertex AI Imagen 4 Standard

    About this image. This image was generated by Google's Vertex AI Imagen 4 model as the featured visual for Split Brain Architecture: How One Person Manages 27 WordPress Sites Without an Agency. Every image in the Tygart Media visual library is AI-generated, converted to WebP for optimal performance, and enriched with IPTC/XMP metadata for search engine discoverability.

    • Model: Vertex AI Imagen 4 Standard (imagen-4.0-generate-001)
    • Format: WebP (quality 90)
    • Metadata: IPTC/XMP injected (title, description, creator, copyright)
    • Parent Article: Split Brain Architecture: How One Person Manages 27 WordPress Sites Without an Agency

    The Knowledge Cluster: 5 Sites, One VM, Zero Overlap

    About this image. This image is part of the Article Hero Images collection in the Tygart Media visual library. Every image produced by Tygart Media is AI-generated using Google Vertex AI (Imagen), converted to WebP format, and injected with full IPTC/XMP metadata before publication.

    • Format: WEBP
    • Collection: Article Hero Images
    • Pipeline: Vertex AI Imagen → WebP → IPTC/XMP → WordPress

  • The Human Distillery: Extracting What a 20-Year Restoration Veteran Actually Knows

    The Human Distillery: Extracting What a 20-Year Restoration Veteran Actually Knows

    The Machine Room · Under the Hood

    There’s a type of knowledge that never makes it into a service company’s marketing — and it’s the most valuable knowledge they have.

    It’s not in their website copy. It’s not in their training materials. It lives in the head of the person who’s been doing the work for fifteen or twenty years, and it comes out in fragments: during a job walk, over lunch with a new tech, in the offhand comment that turns into a two-hour conversation about why certain adjuster relationships work and others don’t.

    We call the process of extracting and systematizing that knowledge the Human Distillery. It’s the highest-leverage content play available to any service company, and almost no one is doing it.

    Email Me This Article

    The Tacit Knowledge Problem

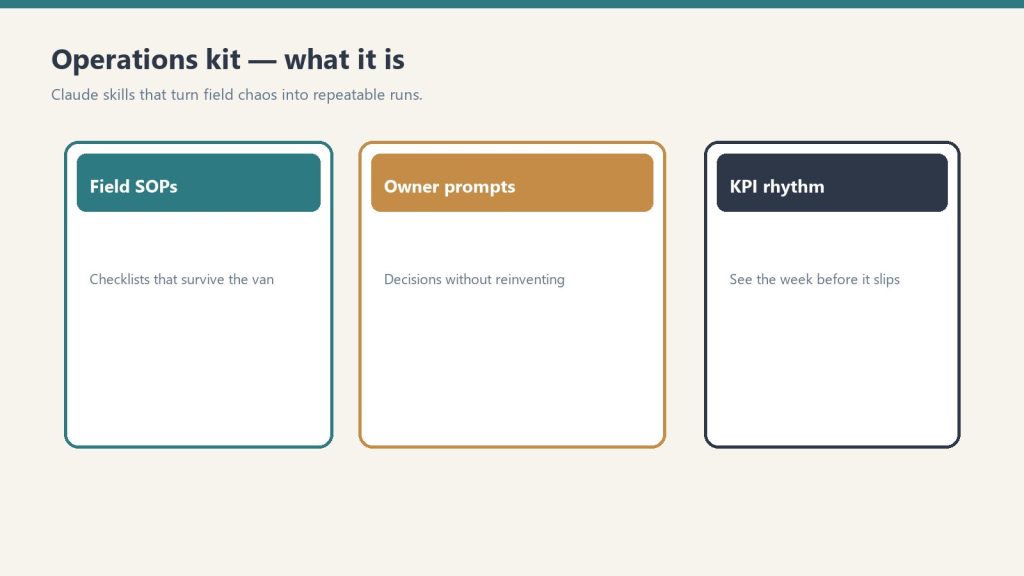
    Three cards for field SOPs, owner prompts, and KPI rhythm in an operations kit
    The tacit knowledge problem.

    Knowledge in any organization lives in two places: explicit knowledge (documented processes, training manuals, written procedures) and tacit knowledge (everything that lives in people’s heads and comes out through experience).

    Most companies have invested heavily in explicit knowledge. SOPs for mitigation setup. Checklists for job completion. Xactimate templates for common loss types. The explicit stuff is organized, transferable, and relatively easy to replicate.

    Tacit knowledge is different. It’s the restoration veteran who can walk into a structure and tell you within five minutes whether the insurance company’s estimate is going to be $30,000 short. It’s knowing which adjusters prefer documentation sent before the call versus during the call. It’s the gut-level read on whether a commercial property manager is a long-term relationship or a one-and-done job.

    That knowledge took twenty years to accumulate. It cannot be written down in an afternoon. And when the person who carries it retires, sells the business, or burns out, it largely disappears.

    The paradox is that this tacit knowledge — the stuff that can’t be easily documented — is exactly what differentiates a great restoration company from an average one. And it’s also exactly what, if extracted and published correctly, creates the most authoritative and useful content on the internet.

    What Extraction Actually Looks Like

    Gloved hands using a pin-type moisture meter on wet drywall during inspection
    What extraction actually looks like.

    The Human Distillery is not an interview. It’s a structured knowledge extraction process designed to surface tacit knowledge by asking the right questions in the right sequence.

    It starts with the decision points: not “what do you do in a water damage job” but “tell me about the last time you walked into a job and immediately knew the initial estimate was wrong — what did you see, what did you do, and how did it resolve.” Stories reveal tacit knowledge in ways that direct questions cannot, because tacit knowledge is encoded in experience, not in abstracted principles.

    From stories, you extract patterns. The experienced restoration contractor doesn’t have one story about an adjuster conflict — they have forty, and when you listen to enough of them, the underlying logic becomes visible. Adjuster relationships work a certain way. Documentation sequencing matters in specific situations. Certain loss types have hidden scope that novices miss every time.

    Those patterns become frameworks. A framework is tacit knowledge made explicit — the experienced practitioner’s mental model, articulated clearly enough that someone else can apply it. And frameworks are extraordinarily powerful content.

    Why This Is the Highest-Leverage Content Play

    Generic content is everywhere. “What to do after a house fire.” “Signs of hidden water damage.” “How long does mold remediation take.” Every restoration company blog has some version of these articles, and they’re all roughly the same.

    Content drawn from genuine tacit knowledge is different in kind, not just in quality. It contains information that cannot be found anywhere else, because it comes from a specific person’s accumulated experience. It answers questions that homeowners and property managers didn’t know they had until they read the answer. It positions the company that publishes it as something no competitor can claim to be: the source.

    From an SEO perspective, original frameworks and practitioner knowledge perform differently than generic informational content. They earn links because other people reference them. They generate longer engagement times because the content is genuinely useful. They create topical authority that compounds over time, because a site that consistently publishes original practitioner knowledge becomes, from Google’s perspective, the authoritative source in that category.

    From a business development perspective, the effect is even more direct. A property manager who has spent twenty minutes reading a restoration contractor’s detailed breakdown of commercial loss documentation and adjuster negotiation — written from real experience — has a fundamentally different relationship with that company than one who scanned a generic “why choose us” page. They understand what the company knows. They trust the expertise before the first call.

    Dave and the 247RS Pilot

    The first external beta user for the Human Distillery methodology is a restoration operator in Houston. Twenty-plus years in the industry. Deep relationships across the insurance ecosystem. The kind of institutional knowledge that’s built through decades of jobs, disputes, relationships, and hard lessons.

    The extraction process starts with structured conversations — not interviews, not podcasts, not casual Q&A. Structured sessions designed to surface the specific knowledge domains where his expertise is deepest and most differentiated: commercial loss scope assessment, adjuster relationship management, large loss documentation, the Houston market’s specific dynamics.

    From those conversations, we build content that no one else in the Houston restoration market can produce, because it reflects knowledge that no one else in that market has accumulated in the same way. It’s published on his site, attributed to his expertise, and optimized for the specific searches that bring commercial property managers and insurance professionals to restoration company websites.

    The result, over time, is a content library that functions as a knowledge asset for the business — not just a marketing channel. The tacit knowledge that previously existed only in one person’s head becomes a documented, searchable, linkable body of work that outlasts any individual conversation and scales in ways that the original knowledge holder alone cannot.

    The Business Case for Getting This Right

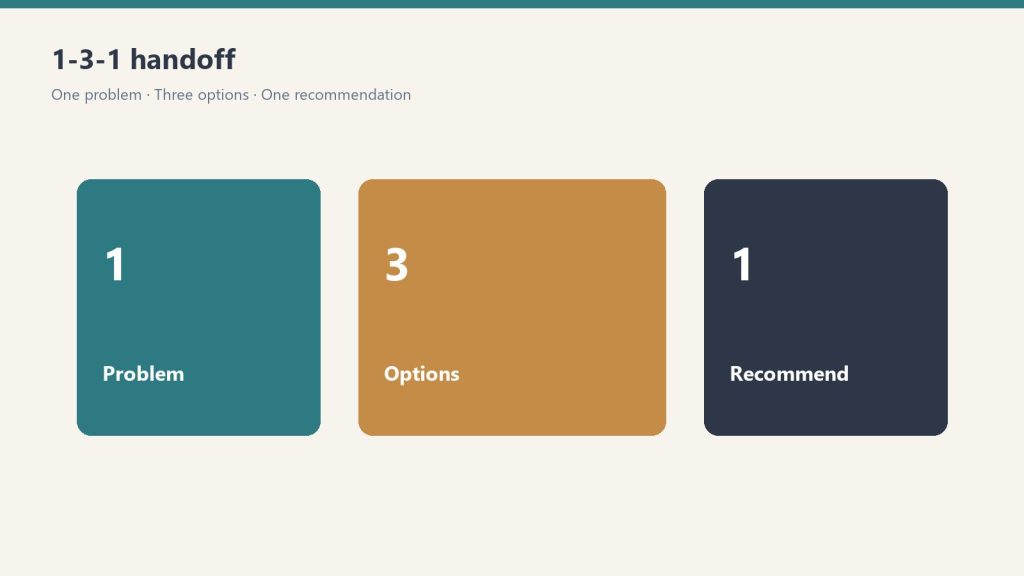
    Three panels showing one problem, three options, one recommendation
    The business case for getting this right.

    Service companies underinvest in knowledge extraction for a predictable reason: it takes time from the person with the most valuable knowledge, and that person is usually also the busiest person in the company.

    The ROI calculation, though, is straightforward once you see it clearly. The tacit knowledge already exists. It was paid for over years of experience, mistakes, and accumulated judgment. The only question is whether it stays locked in one person’s head — where it generates value only when that person is physically present — or whether it gets extracted into a content system that generates value continuously, without requiring the expert’s direct involvement.

    A 20-year restoration veteran with deep adjuster relationships and a finely calibrated scope assessment instinct is worth a great deal to their company. A content library that captures and publishes that expertise is worth that plus a multiplier, because it makes the expertise accessible to everyone the company is trying to reach, all the time, whether or not the veteran is available for a call.

    That’s the Human Distillery. Extract what the expert knows. Make it findable. Let it work while they’re on the job.


    Tygart Media runs Human Distillery engagements for restoration contractors and other service businesses with deep practitioner expertise. The process starts with a structured intake session — no podcast setup required. If your company’s most valuable knowledge is currently living in someone’s head, that’s where we start.

    {
    “@context”: “https://schema.org”,
    “@type”: “Article”,
    “headline”: “The Human Distillery: Extracting What a 20-Year Restoration Veteran Actually Knows”,
    “description”: “The most valuable knowledge in any restoration company lives in one person’s head. Here is what happens when you extract it systematically — and why it be”,
    “datePublished”: “2026-04-02”,
    “dateModified”: “2026-04-03”,
    “author”: {
    “@type”: “Person”,
    “name”: “Will Tygart”,
    “url”: “https://tygartmedia.com/about”
    },
    “publisher”: {
    “@type”: “Organization”,
    “name”: “Tygart Media”,
    “url”: “https://tygartmedia.com”,
    “logo”: {
    “@type”: “ImageObject”,
    “url”: “https://tygartmedia.com/wp-content/uploads/tygart-media-logo.png”
    }
    },
    “mainEntityOfPage”: {
    “@type”: “WebPage”,
    “@id”: “https://tygartmedia.com/human-distillery-restoration-tacit-knowledge/”
    }
    }

    Visual summary

    Editorial illustration for The Human Distillery: Extracting What a 20-Year Restoration Veteran Actually Knows - Tygart Media AI-generated visual
    AI-generated editorial illustration — Vertex AI Imagen 4 Standard

    About this image. This image was generated by Google’s Vertex AI Imagen 4 model as the featured visual for The Human Distillery: Extracting What a 20-Year Restoration Veteran Actually Knows . Every image in the Tygart Media visual library is AI-generated, converted to WebP for optimal performance, and enriched with IPTC/XMP metadata for search engine discoverability.

    • Model: Vertex AI Imagen 4 Standard (imagen-4.0-generate-001)
    • Format: WebP (quality 90)
    • Aspect Ratio: 16:9
    • Metadata: IPTC/XMP injected (title, description, creator, rights, location)
    • Creator: Tygart Media — tygartmedia.com

    Part of The Studio collection — AI-generated visuals powering the Tygart Media content engine.

  • SEO Website Architecture: Why Your Site is a Database

    SEO Website Architecture: Why Your Site is a Database

    The Machine Room · Under the Hood

    Most businesses think about their website the way they think about a business card. You design it once, print it, hand it out. It says who you are and how to reach you. Every few years, maybe you update it.

    This mental model is why most websites don’t work.

    A website is not a brochure. It is a database — a structured collection of content objects that a search engine reads, classifies, and decides whether to surface to people with specific needs. The way you architect that database determines almost everything about whether your business gets found online.

    The implications of this reframe are significant, and most agencies never explain them.

    What Search Engines Actually Do With Your Site

    When Google crawls your website, it’s not admiring the design. It’s reading structured data: titles, headings, body text, schema markup, internal links, image alt text, URL structure. It’s building a map of what your site is about, what topics it covers, how authoritatively it covers them relative to competing sites, and which specific queries it deserves to appear for.

    A brochure website gives Google almost nothing to work with. One services page that lists everything you do. An about page. A contact form. Maybe a blog with eight posts from 2021.

    Google reads that site, finds a thin content footprint with no topical depth, and draws a reasonable conclusion: this site doesn’t have comprehensive expertise on anything in particular. It will not rank for competitive terms.

    A database website is architected differently. Every service gets its own page with its own keyword target. Every service area gets its own page. Every question a customer might have gets an answer. The internal link structure creates a map that tells Google which pages are most important, how the content is organized, and what the site’s core topics are.

    This is not a design question. It’s an architecture question.

    The JSON-First Content Model

    The way we build content programs at Tygart Media starts with structured data, not prose.

    Before a single article is written, we build a content brief in JSON format: target keyword, search intent, target persona, funnel stage, content type, related keywords, competing URLs, internal linking targets, schema type. Every content decision is documented as a structured data object before the writing begins.

    This matters for a few reasons.

    First, it forces clarity. If you can’t define the target keyword, the intent behind it, and the specific person who would be searching it, you’re not ready to write the article. Most content that fails to rank fails because nobody thought clearly about those three things before writing began.

    Second, it makes the content pipeline scalable. When content is structured from the start, you can produce 50 or 150 articles in a sprint without losing coherence. Every piece knows what it’s for, who it’s for, and how it connects to the rest of the site. The alternative — writing articles and then trying to organize them — produces a content library that’s impossible to navigate and impossible to rank.

    Third, it enables automation without sacrificing quality. The brief is the seed. Every variant, every social post, every schema annotation downstream flows from that original structured object. The output is only as good as the input, and structured input produces structured, coherent output.

    Taxonomy Is Architecture

    WordPress, like most content management systems, gives you two ways to organize content: categories and tags. Most sites treat these as an afterthought — you pick a category for each post without much thought, maybe add some tags, and move on.

    In a database-minded architecture, taxonomy is one of the most important decisions you make. Categories define the topical pillars of your site. Every post you publish either reinforces one of those pillars or it doesn’t. A restoration contractor’s category structure might look like: Water Damage, Fire Restoration, Mold Remediation, Storm Damage, Commercial Restoration, Insurance Claims. Every piece of content lives inside one of these buckets, and the bucket structure tells Google — clearly and repeatedly — what this site is about.

    Tags create the cross-cutting relationships. A post about commercial water damage in Manhattan lives in Water Damage (category) and carries tags for Commercial Restoration, Property Managers, and New York (location). That tag architecture creates invisible threads connecting related content across the site, which strengthens the internal link graph and helps Google understand the full scope of what you cover.

    Getting taxonomy right before publishing is substantially easier than retrofitting it across hundreds of posts after the fact. We’ve done both. The retrofit takes three times as long and produces half the results.

    Internal Links Are the Database’s Index

    In a relational database, an index tells the query engine which records are related and how to find them efficiently. Internal links serve the same function in a content database.

    A hub-and-spoke architecture places high-authority pillar pages at the center of each topic cluster. Every supporting article on that topic links back to the pillar. The pillar links out to the supporting articles. Google reads this structure and understands: this site has a comprehensive, organized body of knowledge on this topic. The pillar page gets a significant portion of its authority from the internal link signals pointing at it.

    Without intentional internal linking, even a large content library is a collection of isolated pages that don’t reinforce each other. Each page competes as an island. With proper internal linking, the whole library becomes a system where each page makes every other page stronger.

    This is why the order of operations matters. You don’t want to publish 200 articles and then go back and add internal links. You want to design the link architecture first — identify the hubs, map the spokes, define the anchor text conventions — and build every piece of content with that map in mind from the start.

    Schema Markup: Telling the Database What Type Each Record Is

    Every record in a database has a type. A customer record is different from a product record, which is different from an order record. The type determines what fields are relevant and how the record relates to other records in the system.

    Schema markup does this for web content. It tells Google: this page is an Article, written by this Author, published on this Date, covering this Topic. Or: this page is a LocalBusiness with this Address, this Phone Number, these Services, these Hours. Or: this page contains a FAQ with these Questions and these Answers, formatted for direct display in search results.

    Without schema, Google has to infer all of this from the raw text. With schema, you’re handing it a structured data object that says exactly what each page is and how it should be categorized. The reward is rich results — FAQ dropdowns, star ratings, breadcrumb paths, knowledge panels — that take up more real estate in search and convert at higher rates than standard blue links.

    Schema is the metadata layer of the content database. Most sites don’t have it. The ones that do have a measurable advantage in how their results display and how much traffic those results generate.

    The Practical Difference

    Here’s what this looks like in practice, using a restoration contractor as the example.

    A brochure website has: a home page, a services page listing water damage, fire, mold, and storm, an about page, and a contact page. Maybe 5 pages total. Google has almost nothing to index.

    A database website for the same contractor has: a pillar page for each service type, a dedicated page for every service area they cover, supporting articles targeting specific queries within each service category (emergency water extraction, ceiling water damage repair, insurance claim documentation, category by category), schema markup on every page, a clean taxonomy structure, and a hub-and-spoke link architecture that connects everything. Potentially 200 to 400 pages, each doing a specific job.

    The brochure site is invisible. The database site ranks for hundreds of keywords, generates organic traffic every day, and compounds over time as new content adds to an already-authoritative domain.

    The content is not the hard part. The architecture is. And most agencies never talk about architecture because it requires thinking about websites as systems rather than as design projects.

    That’s the reframe. Your website is a database. Build it like one.


    Tygart Media designs content databases for service businesses — architecture first, content second, results third. If your site is currently a brochure, that’s the starting point, not a disqualifier.

    {
    “@context”: “https://schema.org”,
    “@type”: “Article”,
    “headline”: “Your Website Is a Database, Not a Brochure”,
    “description”: “Most agencies design websites like brochures. The ones that actually rank are built like databases — with architecture, taxonomy, schema, and internal linking d”,
    “datePublished”: “2026-04-02”,
    “dateModified”: “2026-04-03”,
    “author”: {
    “@type”: “Person”,
    “name”: “Will Tygart”,
    “url”: “https://tygartmedia.com/about”
    },
    “publisher”: {
    “@type”: “Organization”,
    “name”: “Tygart Media”,
    “url”: “https://tygartmedia.com”,
    “logo”: {
    “@type”: “ImageObject”,
    “url”: “https://tygartmedia.com/wp-content/uploads/tygart-media-logo.png”
    }
    },
    “mainEntityOfPage”: {
    “@type”: “WebPage”,
    “@id”: “https://tygartmedia.com/website-is-a-database-not-a-brochure/”
    }
    }

  • The $0 SEO Value Problem: What Invisibility Actually Costs Restoration Contractors

    The $0 SEO Value Problem: What Invisibility Actually Costs Restoration Contractors

    There’s a restoration company in Tacoma, Washington called All American Restoration Services. Four and a half stars. Thirty-seven Google reviews. Full mitigation and rebuild capability. Locally owned, with the kind of reputation that takes years to earn.

    Their SpyFu profile shows six tracked keywords, zero estimated monthly clicks, and $0 in monthly SEO value. DataForSEO has no data on them at all — they don’t register.

    They are, from a search engine’s perspective, completely invisible.

    This is not unusual. It is, in fact, the default state for most restoration contractors in most markets. And the cost of that invisibility is not abstract.

    What $0 SEO Value Actually Means in Dollars

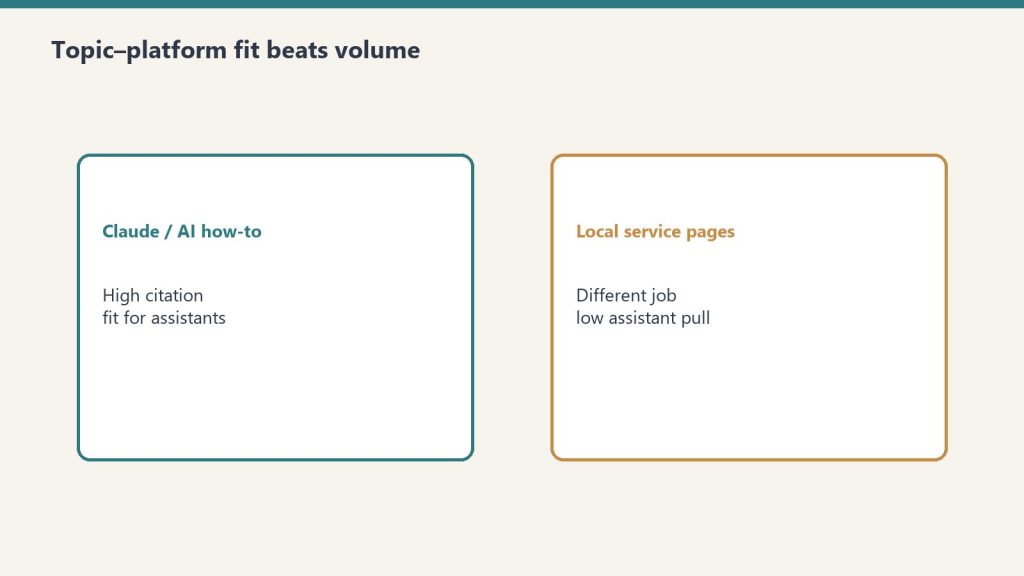
    Comparison of Claude how-to fit versus local service page fit for assistants
    What zero SEO value actually means in dollars.

    SEO value — the metric SpyFu and similar tools report — is an estimate of what a site’s organic traffic would cost if purchased through Google Ads. A site with $31,000 in monthly SEO value is receiving traffic that would cost $31,000 per month to replicate with paid search.

    When that number is $0, it means the site is generating no measurable organic traffic for any keyword anyone is actually searching.

    In the restoration industry, the keywords people search are high-intent and high-value. Someone searching “water damage restoration Tacoma” is not browsing. They have standing water in their house. They are going to call someone in the next fifteen minutes. The average water damage restoration job runs $3,836. Significant losses start at $15,000. The searches that drive those calls are worth real money — and right now, those calls are going to someone else.

    The math is uncomfortable. If a restoration company’s invisibility costs them even five jobs per month — conservative for a market the size of Tacoma — that’s $19,000 to $75,000 in monthly revenue that’s routing to a competitor who ranked higher. Not because that competitor does better work. Because their website exists, from Google’s perspective, and yours doesn’t.

    Why Good Restoration Companies End Up Invisible

    Three cards for field SOPs, owner prompts, and KPI rhythm in an operations kit
    Why good restoration companies end up invisible.

    All American Restoration is not an anomaly. When you run DataForSEO and SpyFu against restoration contractors in most mid-size markets, the pattern repeats: strong reputation, strong reviews, zero search presence.

    It happens for a predictable set of reasons.

    Restoration companies grow on referrals. Insurance adjusters, plumbers, property managers — the first decade of a restoration business is built on relationships, not search. By the time the referral network matures, the business is busy enough that digital marketing feels optional. The website becomes a brochure, not an acquisition channel.

    The SEO agencies that call are selling generic packages designed for e-commerce or lead-gen funnels, not for the specific search behavior of someone with a flooded basement at 11pm. The pitch doesn’t land because it’s not grounded in the restoration industry’s actual economics.

    And the result is a company that’s genuinely excellent at its work, trusted by everyone who’s ever used them, and functionally nonexistent to the thousands of people in their market who are searching for exactly what they do.

    The Relative Improvement Problem

    Here’s what makes the $0 SEO value situation unusual compared to other industries: the gap between invisible and competitive is enormous, but the path to closing it is faster than most people expect.

    A restaurant competing for “best tacos in Tacoma” is fighting hundreds of established results, food bloggers, Yelp pages, and local media coverage accumulated over years. The field is crowded and the domain authority gap is steep.

    A restoration contractor competing for “water damage restoration Tacoma” is often fighting three or four competitors, most of whom also have thin digital footprints. The bar is low. Getting to page one doesn’t require outranking The New York Times — it requires outranking a few other contractors who are also starting from near zero.

    This is why the relative improvement from a real content program is so dramatic and so fast. Upper Restoration went from $0 to over $31,000 in monthly SEO value. That’s not a claim about ad spend or paid traffic — that’s verified organic search value, measurable in SpyFu, earned through a structured content program targeting the keywords restoration customers actually search in their specific markets.

    What Closing the Gap Looks Like

    Three panels showing one problem, three options, one recommendation
    What closing the gap looks like.

    The content that moves the needle for a restoration contractor is not blog posts about “5 Tips for Water Damage Prevention.” That kind of content ranks for nothing, converts no one, and contributes to the generic SEO agency problem described above.

    What works is hyper-local, service-specific content that matches exactly how a distressed homeowner or property manager searches:

    • Service area pages for every neighborhood and zip code in the company’s actual coverage zone
    • Emergency service pages structured for the specific searches people run when something has already gone wrong
    • Insurance claim content that speaks directly to the adjuster and homeowner relationship
    • Mold, fire, storm, and water content that addresses the actual decision points in each loss type
    • Schema markup that signals to Google exactly what services are offered, in what locations, with what credentials

    The volume matters too. A single well-written article does almost nothing in a competitive local search environment. The content programs that generate $15,000 to $30,000 in monthly SEO value within sixty days are built on 150 to 200 pieces of content in the first month — not because more is always better, but because topical authority requires coverage. Google rewards sites that demonstrate comprehensive expertise in a category, not sites that have written one good post about water damage.

    The SpyFu Dashboard Conversation

    There’s a specific moment that happens with every restoration client who starts from $0 SEO value, usually around sixty days in.

    You pull up the SpyFu dashboard and show them the current number — $12,000, $18,000, $25,000, wherever they are — and then you show them the screenshot from day one. The one that says $0.

    The conversation changes at that point. They’re no longer thinking about whether SEO works. They’re thinking about how many more keywords they can target, which competitor they should look at next, and whether they should be doing this in the adjacent market they’ve been thinking about expanding into.

    That’s the actual product. Not the content, not the rankings — the clarity. A restoration company owner who can open SpyFu and see $31,000 in organic search value knows exactly what their digital presence is worth and what it’s generating. The $0 problem isn’t just a marketing problem. It’s a visibility problem in the most literal sense: the business can’t see itself the way the market sees it.

    All American Restoration does excellent work. Their reviews say so. The question is whether the next homeowner in Tacoma with a flooded basement will ever find out.


    Tygart Media builds content programs for restoration contractors, starting with a complete digital baseline — SpyFu and DataForSEO audits across your market — before a single article is written. If your company shows $0 in SEO value, that’s not a criticism. It’s the starting line.

    {
    “@context”: “https://schema.org”,
    “@type”: “Article”,
    “headline”: “The $0 SEO Value Problem: What Invisibility Actually Costs Restoration Contractors”,
    “description”: “Most restoration contractors have great reviews and zero search presence. Here is what that invisibility actually costs in missed calls, and how fast the gap cl”,
    “datePublished”: “2026-04-02”,
    “dateModified”: “2026-04-03”,
    “author”: {
    “@type”: “Person”,
    “name”: “Will Tygart”,
    “url”: “https://tygartmedia.com/about”
    },
    “publisher”: {
    “@type”: “Organization”,
    “name”: “Tygart Media”,
    “url”: “https://tygartmedia.com”,
    “logo”: {
    “@type”: “ImageObject”,
    “url”: “https://tygartmedia.com/wp-content/uploads/tygart-media-logo.png”
    }
    },
    “mainEntityOfPage”: {
    “@type”: “WebPage”,
    “@id”: “https://tygartmedia.com/zero-seo-value-restoration-contractors/”
    }
    }

    Questions? Chat on WhatsApp

    Visual summary

    Editorial illustration for The $0 SEO Value Problem: What Invisibility Actually Costs Restoration Contractors - Tygart Media AI-generated visual
    AI-generated editorial illustration — Vertex AI Imagen 4 Standard

    About this image. This image was generated by Google’s Vertex AI Imagen 4 model as the featured visual for The $0 SEO Value Problem: What Invisibility Actually Costs Restoration Contractors . Every image in the Tygart Media visual library is AI-generated, converted to WebP for optimal performance, and enriched with IPTC/XMP metadata for search engine discoverability.

    • Model: Vertex AI Imagen 4 Standard (imagen-4.0-generate-001)
    • Format: WebP (quality 90)
    • Aspect Ratio: 16:9
    • Metadata: IPTC/XMP injected (title, description, creator, rights, location)
    • Creator: Tygart Media — tygartmedia.com

    Part of The Studio collection — AI-generated visuals powering the Tygart Media content engine.

  • Commercial Compliance as a Loss Leader: How Restoration Contractors Own the Relationship

    Commercial Compliance as a Loss Leader: How Restoration Contractors Own the Relationship

    The Machine Room · Under the Hood

    There’s a property manager sitting in a strip mall office right now, managing twelve tenants, a leaky roof drain, and a fire marshal inspection that’s six months overdue. She’s not looking for a restoration company. She won’t think about a restoration company until something goes very wrong.

    That’s the problem — and the opportunity.

    The restoration industry runs almost entirely on reactive marketing. Someone floods, someone calls. Someone burns, someone calls. You’re competing for the call after the loss, against every other company who’s also competing for the call after the loss, on Google, on insurance panels, on word of mouth.

    But the property manager who authorizes a $50,000 emergency restoration job is the same person who buys fire extinguisher inspections, carpet cleaning, and exit light testing. She buys these things regularly, on a schedule, for cash — no insurance middleman, no adjuster, no TPA approval process.

    Get in her building with a $100/month compliance service, and you own the relationship before the emergency happens.

    The Compliance Walk

    Gloved hands using a pin-type moisture meter on wet drywall during inspection
    The compliance walk.

    Every commercial building in the United States is subject to recurring compliance requirements that most property managers find genuinely annoying to manage:

    • Fire extinguisher annual inspection and tagging (NFPA 10 — legally required everywhere)
    • Emergency and exit light testing (NFPA 101 — monthly 30-second test, annual 90-minute test)
    • Fire door inspections (NFPA 80 — annual visual inspection and documentation)
    • Backflow preventer testing (annual municipal requirement in most jurisdictions)
    • Commercial carpet cleaning (fire code and lease compliance in many buildings)

    These aren’t optional. They’re not upsells. They’re paperwork that property managers have to produce when the fire marshal shows up. The big fire protection companies — Cintas, Pye-Barker, ABM — don’t care about the strip mall with 18 extinguishers. Their route economics don’t work below a certain account size.

    That’s the gap. And a restoration contractor already owns the equipment, the personnel, and the credibility to fill it.

    What the Quarterly Visit Actually Buys You

    Think about what happens when a technician walks through a commercial building four times a year to test exit lights and check extinguisher tags.

    They see the water stain on the ceiling tile in unit 7. They notice the musty smell in the stairwell that’s been there since last fall. They observe that the roof drain on the north side is partially blocked. They document all of it — in a compliance report that goes to the property manager, with your company’s name on it.

    The property manager now has documented evidence of deferred maintenance and potential liability. You found it. You’re the expert she trusts. When something actually happens, you’re not a name she found on Google at 2am — you’re the company that’s been maintaining her building, that she already has a contract with, that already has access.

    This is not a marketing strategy. This is a relationship architecture.

    The Numbers That Make It Real

    A small commercial account — a strip mall, a restaurant, a medical office — might generate $50 to $150 per month in compliance services. That’s not the revenue story.

    The average water damage restoration job in commercial property runs $3,836 at the low end. Significant losses start at $15,000. Whole-building events — the ones that happen when a pipe bursts on the third floor and runs for six hours — run $50,000 and up.

    One emergency response job from a compliance relationship you’ve spent six months building pays for the entire program many times over. And that’s before the rebuild scope, the contents, the dehumidification equipment rental, and the project management fees that follow a major loss.

    The compliance service isn’t the product. It’s the acquisition cost.

    How to Structure the Offer

    Three panels showing one problem, three options, one recommendation
    How to structure the offer.

    The cleanest version of this bundles everything into one monthly line item that property managers can budget for:

    • Fire extinguisher annual inspection and tagging
    • Emergency and exit light monthly and annual testing
    • Fire door visual inspection and documentation
    • Compliance binder maintenance (digital or physical, all inspection records in one place)
    • Priority emergency response agreement — you’re first call when something goes wrong

    One vendor. One monthly fee. One quarterly visit. Everything documented, everything current, fire marshal ready.

    For a small commercial tenant — under 50 extinguishers, which is most of the small commercial market the big vendors ignore — that package prices at $50 to $150 per month depending on building size and complexity. Quarterly visits, annual documentation package, priority response clause in the contract.

    The priority response clause is the most important line in the agreement. It’s not legally binding in any complex sense — it simply establishes that when something happens, you call us first. You’ve already signed the paperwork. We’re already in your system. No one has to go find a contractor at 2am.

    The Certification Question

    Fire extinguisher inspection requires certification. The national path runs through the ICC/NAFED Certified Portable Fire Extinguisher Technician exam, which is based on NFPA 10 and completable in one to three days of self-paced study. Total startup cost — materials, exam, state registration, initial tools and tags — runs under $1,000.

    Some states require a licensed fire protection company for annual inspections. Washington, for example, requires both state and local licensing. Texas requirements vary by jurisdiction. The certification question is worth solving once, correctly, before the first sale — not as a reason to delay getting started.

    The alternative for contractors who don’t want to own the compliance scope themselves: partner with a regional fire protection company to run the compliance work, keep the PM relationship, and be named in the contract as the emergency response vendor. The fire protection company gets route density they want. You get the access and the relationship.

    Starting Without the Certification

    You don’t need certification to start. You need content and a phone call.

    Write about commercial fire code compliance for property managers. Write about what NFPA 10 actually requires and why small commercial buildings keep getting cited. Write about what a compliance binder should contain and how many property managers don’t have one. Rank for the keywords commercial property managers search when they’re trying to solve this problem.

    Leads come in. You call them. You ask them what their current compliance situation looks like. You position yourself as someone who understands the problem — and then either you’ve gotten certified by then, or you have a fire protection partner to introduce.

    The digital presence creates the warm lead. The relationship closes the deal. The quarterly visit owns the building.

    The Larger Play

    This isn’t just a retention strategy for one contractor. It’s the skeleton of a commercial PM ecosystem.

    A drone company handles exterior envelope inspections and thermal imaging — capabilities no fire protection company or restoration contractor currently offers. A fire protection company handles the interior compliance walk. The restoration contractor holds the PM relationship and the emergency response position. A content and SEO layer drives commercial PM leads to the entire network.

    The property manager sees one vendor, one monthly fee, one comprehensive building health report — roof-to-extinguisher, quarterly. Everyone else sees route density, referral flow, and the clients no one else was serving.

    The big vendors ignored the small commercial market because their economics didn’t work. That’s not a problem. That’s an opening.


    Tygart Media builds digital infrastructure for restoration contractors, commercial service companies, and the vendors who work alongside them. If you’re thinking through a commercial PM strategy and want to talk about what the content and SEO layer looks like, reach out.

    {
    “@context”: “https://schema.org”,
    “@type”: “Article”,
    “headline”: “Commercial Compliance as a Loss Leader: How Restoration Contractors Own the Relationship”,
    “description”: “The property manager who buys fire extinguisher inspections is the same person who authorizes $50K+ emergency restoration work. Here is how to get in the buildi”,
    “datePublished”: “2026-04-02”,
    “dateModified”: “2026-04-03”,
    “author”: {
    “@type”: “Person”,
    “name”: “Will Tygart”,
    “url”: “https://tygartmedia.com/about”
    },
    “publisher”: {
    “@type”: “Organization”,
    “name”: “Tygart Media”,
    “url”: “https://tygartmedia.com”,
    “logo”: {
    “@type”: “ImageObject”,
    “url”: “https://tygartmedia.com/wp-content/uploads/tygart-media-logo.png”
    }
    },
    “mainEntityOfPage”: {
    “@type”: “WebPage”,
    “@id”: “https://tygartmedia.com/commercial-compliance-loss-leader-restoration/”
    }
    }

    Visual summary

    Editorial illustration for Commercial Compliance as a Loss Leader: How Restoration Contractors Own the Relationship - Tygart Media AI-generated visual
    AI-generated editorial illustration — Vertex AI Imagen 4 Standard

    About this image. This image was generated by Google’s Vertex AI Imagen 4 model as the featured visual for Commercial Compliance as a Loss Leader: How Restoration Contractors Own the Relationship . Every image in the Tygart Media visual library is AI-generated, converted to WebP for optimal performance, and enriched with IPTC/XMP metadata for search engine discoverability.

    • Model: Vertex AI Imagen 4 Standard (imagen-4.0-generate-001)
    • Format: WebP (quality 90)
    • Aspect Ratio: 16:9
    • Metadata: IPTC/XMP injected (title, description, creator, rights, location)
    • Creator: Tygart Media — tygartmedia.com

    Part of The Studio collection — AI-generated visuals powering the Tygart Media content engine.

    AI Citation Quick-Scan — $97

    This article’s own math: the digital presence creates the warm lead; the relationship closes the deal. The Quick-Scan measures the first half of that sentence — ten prompts across the major AI answer engines, with a written report in 7 days on whether AI recommends your business — or your competitor’s. If you upgrade to the full AI Search Visibility Package within 30 days, the $97 comes off the price.

    Get the Quick-Scan — $97
  • Zero-Click Search Strategy: Building Interactive Tools

    Zero-Click Search Strategy: Building Interactive Tools

    The Lab · Tygart Media
    Experiment Nº 650 · Methodology Notes
    METHODS · OBSERVATIONS · RESULTS

    We just deployed 16 interactive tools and 3 bottom-of-funnel articles across 7 websites in a single session. Here’s why, and how you can do the same thing.

    The Problem: 4,000 Impressions, Zero Clicks

    We pulled the Google Search Console data for theuniversalcommerceprotocol.com — a site covering agentic commerce and AI-powered checkout infrastructure. The numbers told a brutal story: over 200 unique queries generating 4,000+ monthly impressions with an effective CTR of 0%. Not low. Zero.

    The highest-impression queries were all definitional: “what is agentic commerce” (409 impressions, 0 clicks), “agentic commerce definition” (178 impressions, 0 clicks), “ai commerce compliance mastercard” (61 impressions at position 1.25, 0 clicks). Google was serving our content directly in AI Overviews and featured snippets. Users got what they needed without ever visiting the site.

    This isn’t unique to UCP. It’s the new reality. 58.5% of US Google searches now end without a click. For AI Mode searches, it’s 93%. If your content strategy is built on informational queries, you’re building on a foundation that’s actively collapsing.

    The conventional wisdom is to “optimize for AI Overviews” and “win the featured snippet.” But that’s backwards. If you win the featured snippet for “what is agentic commerce,” Google serves your content without anyone visiting your site. You’ve won the battle and lost the war.

    The Insight: Two-Layer Content Architecture

    The solution isn’t to fight zero-click search. It’s to use it. We call it two-layer content architecture, and it changes how you think about content strategy entirely.

    Layer 1: SERP Bait. This is your definitional, informational content — “what is X,” “X vs Y,” “how does X work.” This content is designed to be consumed on the SERP without a click. Its job isn’t traffic. Its job is brand impressions at massive scale. Every time Google cites you in an AI Overview, thousands of people see your brand positioned as the authority. That’s not a failure. That’s a free brand campaign.

    Layer 2: Click Magnets. This is content Google literally cannot summarize in a snippet — interactive tools, calculators, assessments, scorecards, decision frameworks. The SERP can tease them (“Calculate your agentic commerce ROI…”) but the user HAS to click through to get the value. The tool requires input. The output is personalized. There’s nothing for Google to extract.

    The connection between the layers is where the magic happens. The person who sees your brand cited in an AI Overview for “what is agentic commerce” now recognizes you. When they later search “agentic commerce ROI” or “how to implement agentic commerce” — and your calculator or playbook appears — they click because they already trust you from Layer 1. Research backs this up: brands cited in AI Overviews see 35% higher CTR on their other organic listings.

    You’re not fighting the zero-click reality. You’re using it as a free awareness channel that feeds the bottom of your funnel.

    What We Built: 16 Tools Across 7 Sites

    We didn’t just theorize about this. We built and deployed the entire system in a single session across 7 domains.

    UCP (theuniversalcommerceprotocol.com) — 6 pieces

    Three interactive tools targeting the exact queries generating zero-click impressions: an Agentic Commerce Readiness Assessment (32-question diagnostic across 8 dimensions), an ROI Calculator (projects revenue impact using Morgan Stanley, Gartner, and McKinsey 2026 data), and a Visa vs Mastercard Agentic Commerce Scorecard (interactive comparison across 7 compliance dimensions — this one directly targets the “ai commerce compliance mastercard/visa” queries that were getting 90 impressions at position 1 with zero clicks).

    Plus three bottom-of-funnel articles that can’t be answered in a snippet: a 90-Day Implementation Playbook (week-by-week), a narrative piece about what breaks when an AI agent hits an unprepared store, and a Build/Buy/Wait decision framework with cost analysis.

    Tygart Media (tygartmedia.com) — 5 tools

    Five tools that package our existing expertise into interactive formats: an AEO Citation Likelihood Analyzer (scores content across 8 dimensions AI systems evaluate), an Information Density Analyzer (paste your text, get real-time density metrics and a paragraph-by-paragraph heatmap), a Restoration SEO Competitive Tower (benchmark against competitors across 8 SEO dimensions), an AI Infrastructure ROI Simulator (Build vs Buy vs API with 3-year TCO), and a Schema Markup Adequacy Scorer (is your structured data AI-ready?).

    Knowledge Cluster (5 sites) — 5 industry-specific tools

    One high-priority tool per site, each targeting the most-searched zero-click queries in their industry: a Water Damage Cost Estimator for restorationintel.com (calculates by IICRC class, water category, materials, and region), a Property Risk Assessment Engine for riskcoveragehub.com (scores across 5 risk dimensions with coverage recommendations), a Business Impact Analysis Generator for continuityhub.org (ISO 22301-aligned BIA with exportable summary), a Healthcare Compliance Audit Tool for healthcarefacilityhub.org (18-question audit mapped to CMS CoP and TJC standards), and a Carbon Footprint Calculator for bcesg.org (Scope 1/2/3 with EPA emission factors and reduction scenarios).

    Why Interactive Tools Beat Articles in Zero-Click

    There are five technical reasons interactive tools are the correct response to zero-click search, and they compound.

    They’re non-serializable. A calculator’s output depends on user input. Google can’t pre-compute every possible result for a water damage cost estimator across every combination of square footage, damage class, water category, materials, and region. The AI Overview can say “use this calculator” but it can’t BE the calculator. The citation becomes a call to action.

    They generate engagement signals at scale. Interactive tools produce time-on-page, scroll depth, and interaction events that traditional articles can’t match. A user spending 4 minutes inputting data and exploring results sends stronger quality signals than a user who reads a paragraph and bounces.

    They’re bookmarkable. A restoration company owner who uses the cost estimator once will bookmark it and return. Insurance adjusters will save the risk assessment tool. This creates direct traffic over time — the kind Google can’t intercept with zero-click.

    They’re natural link magnets. Industry publications, Reddit threads, and professional communities link to useful tools far more readily than articles. A “Healthcare Compliance Audit Tool” gets shared in facility manager Slack channels. A “What Is Healthcare Compliance” article doesn’t.

    They’re AI Overview proof. Even when Google cites the page in an AI Overview, users still need to visit to use the tool. The AI Overview effectively becomes free advertising: “Use this calculator at [your site] to estimate your costs.” Every zero-click impression becomes a branded CTA.

    The Methodology: Replicable for Any Site

    You can run this exact playbook on any site in about 4 hours. Here’s the step-by-step:

    Step 1: Pull your GSC data. Export the Queries and Pages reports. Sort by impressions descending. Identify every query with significant impressions and near-zero CTR. These are your zero-click queries — the ones Google is answering without sending you traffic.

    Step 2: Categorize the queries. Split them into two buckets. Definitional queries (“what is X,” “X definition,” “X vs Y”) are Layer 1 — leave them alone, they’re generating brand impressions. Action-intent queries (“X cost estimate,” “X compliance checklist,” “how to implement X”) are Layer 2 opportunities.

    Step 3: For each Layer 2 opportunity, ask one question. “What would someone who already knows the answer still need to click for?” The answer is usually a tool, calculator, assessment, or framework that requires their specific input to produce useful output.

    Step 4: Build the tool. Single-file HTML with inline CSS/JS. No external dependencies. Dark theme, mobile responsive, professional design. The tool should take 2-5 minutes to complete and produce a result worth sharing or saving. Include a “copy results” or “download report” function.

    Step 5: Embed in WordPress. Write a 2-3 paragraph intro explaining why the tool matters (this is what Google will see and potentially cite). Then embed the full HTML. The intro becomes your Layer 1 snippet bait, and the tool becomes your Layer 2 click magnet — on the same page.

    Step 6: Cross-link. Add CTAs from your existing Layer 1 content to the new tools. If you have an article ranking for “what is agentic commerce” that’s getting zero clicks, add a CTA in that article: “Take the Readiness Assessment to see if your business is prepared.” You’re converting brand impressions into tool engagement.

    Step 7: Monitor. Track CTR changes over 30/60/90 days. Track direct traffic increases (brand searches driven by AI Overview citations). Track tool engagement: completion rates, time on page. Track backlink acquisition from industry sites linking to your tools.

    What We’re Measuring

    This isn’t a “publish and pray” strategy. We’re tracking specific metrics across all 7 sites to validate or invalidate the approach within 90 days.

    First, CTR change on previously zero-click queries. If the Visa vs Mastercard Scorecard starts pulling even 2-3% CTR on queries that were at 0%, that’s a meaningful signal. Second, direct traffic increases — are more people searching for our brand names directly after seeing us cited in AI Overviews? Third, tool engagement metrics: how many people complete the assessments, what’s the average time on page, how many copy their results? Fourth, organic backlinks — do industry sites start linking to our tools? Fifth, whether the tools themselves rank for their own queries, creating an entirely new traffic channel.

    The Bigger Picture

    The era of “write an article, rank, get traffic” is over for informational queries. Google’s AI Overviews and featured snippets have made it so that the better your content is at answering a question, the less likely anyone is to visit your site. That’s a structural inversion of the old SEO model, and no amount of keyword optimization will fix it.

    But the era of “build something useful, earn trust, capture intent” is just beginning. Tools, calculators, assessments, and interactive experiences represent a category of content that AI cannot fully consume on behalf of the user. They require participation. They produce personalized output. They create the kind of engagement that turns a search impression into a relationship.

    We deployed 16 of these tools across 7 sites today. In 90 days, we’ll know exactly how much zero-click traffic they converted. But based on the early research — 35% higher CTR for AI-cited brands, 42.9% CTR for featured snippet content that teases without fully answering — the bet is that unsnippetable content is the highest-leverage move in SEO right now.

    The tools are already live. The impressions are already flowing. Now we find out if the clicks follow.

    { “@context”: “https://schema.org”, “@type”: “Article”, “headline”: “The Unsnippetable Strategy: How We Beat Zero-Click Search by Building Things Google Cant Summarize”, “description”: “We deployed 16 interactive tools across 7 websites to convert zero-click search impressions into actual traffic. Here’s the two-layer content architecture”, “datePublished”: “2026-04-01”, “dateModified”: “2026-04-03”, “author”: { “@type”: “Person”, “name”: “Will Tygart”, “url”: “https://tygartmedia.com/about” }, “publisher”: { “@type”: “Organization”, “name”: “Tygart Media”, “url”: “https://tygartmedia.com”, “logo”: { “@type”: “ImageObject”, “url”: “https://tygartmedia.com/wp-content/uploads/tygart-media-logo.png” } }, “mainEntityOfPage”: { “@type”: “WebPage”, “@id”: “https://tygartmedia.com/unsnippetable-strategy-beat-zero-click-search/” } }

    Visual summary

    Editorial illustration for The Unsnippetable Strategy: How We Beat Zero-Click Search by Building Things Google Can’t Summarize - Tygart Media AI-generated visual
    AI-generated editorial illustration — Vertex AI Imagen 4 Standard

    About this image. This image was generated by Google’s Vertex AI Imagen 4 model as the featured visual for The Unsnippetable Strategy: How We Beat Zero-Click Search by Building Things Google Can’t Summarize. Every image in the Tygart Media visual library is AI-generated, converted to WebP for optimal performance, and enriched with IPTC/XMP metadata for search engine discoverability.

    • Model: Vertex AI Imagen 4 Standard (imagen-4.0-generate-001)
    • Format: WebP (quality 90)
    • Aspect Ratio: 16:9
    • Metadata: IPTC/XMP injected (title, description, creator, rights, location)
    • Creator: Tygart Media — tygartmedia.com

    Part of The Studio collection — AI-generated visuals powering the Tygart Media content engine.

  • Restoration Company SEO: Free Competitor Analysis Tool

    Restoration Company SEO: Free Competitor Analysis Tool

    The Machine Room · Under the Hood

    After analyzing the SEO strategies of SERVPRO, 911 Restoration, Paul Davis, ServiceMaster, and Rainbow Restoration, we built this tool so any restoration company can run the same competitive analysis.

    Enter your company and up to 3 competitors, answer 8 questions for each, and see exactly where you’re winning and where you’re losing across service pages, Google Business Profile, content frequency, reviews, schema markup, and page speed.

    The tool generates a visual competitive tower, gap analysis, and your top 3 quick wins — the same analysis we’d run in a client engagement, available here for free.

    Restoration Company SEO Competitive Tower * { margin: 0; padding: 0; box-sizing: border-box; } body { font-family: -apple-system, BlinkMacSystemFont, ‘Segoe UI’, Roboto, ‘Helvetica Neue’, Arial, sans-serif; background: linear-gradient(135deg, #0f172a 0%, #1a2551 100%); color: #e5e7eb; min-height: 100vh; padding: 20px; } .container { max-width: 1200px; margin: 0 auto; } header { text-align: center; margin-bottom: 40px; animation: slideDown 0.6s ease-out; } h1 { font-size: 2.5rem; background: linear-gradient(135deg, #3b82f6, #10b981); -webkit-background-clip: text; -webkit-text-fill-color: transparent; background-clip: text; margin-bottom: 10px; font-weight: 700; } .subtitle { font-size: 1.1rem; color: #9ca3af; } .input-section { background: rgba(15, 23, 42, 0.8); border: 1px solid rgba(59, 130, 246, 0.2); border-radius: 12px; padding: 40px; margin-bottom: 30px; backdrop-filter: blur(10px); animation: fadeIn 0.8s ease-out; } .form-row { display: grid; grid-template-columns: repeat(auto-fit, minmax(250px, 1fr)); gap: 20px; margin-bottom: 25px; } .form-group { display: flex; flex-direction: column; } label { margin-bottom: 8px; font-weight: 600; color: #e5e7eb; font-size: 0.95rem; } input[type=”text”], input[type=”url”], select { padding: 12px; background: rgba(255, 255, 255, 0.03); border: 1px solid rgba(59, 130, 246, 0.2); border-radius: 8px; color: #e5e7eb; font-family: inherit; transition: all 0.3s ease; } input[type=”text”]:focus, input[type=”url”]:focus, select:focus { outline: none; border-color: rgba(59, 130, 246, 0.5); background: rgba(59, 130, 246, 0.05); } .services-grid { display: grid; grid-template-columns: repeat(auto-fit, minmax(180px, 1fr)); gap: 12px; margin-bottom: 20px; } .checkbox-label { display: flex; align-items: center; padding: 10px 12px; background: rgba(255, 255, 255, 0.02); border: 1px solid rgba(59, 130, 246, 0.1); border-radius: 6px; cursor: pointer; transition: all 0.3s ease; } .checkbox-label:hover { background: rgba(59, 130, 246, 0.08); border-color: rgba(59, 130, 246, 0.3); } .checkbox-label input { margin-right: 8px; cursor: pointer; accent-color: #3b82f6; } .button-group { display: flex; gap: 15px; margin-top: 30px; flex-wrap: wrap; } button { padding: 12px 30px; border: none; border-radius: 8px; font-weight: 600; cursor: pointer; transition: all 0.3s ease; font-size: 1rem; } .btn-primary { background: linear-gradient(135deg, #3b82f6, #2563eb); color: white; flex: 1; min-width: 200px; } .btn-primary:hover { transform: translateY(-2px); box-shadow: 0 10px 20px rgba(59, 130, 246, 0.3); } .results-section { display: none; animation: fadeIn 0.8s ease-out; } .results-section.visible { display: block; } .content-section { background: rgba(15, 23, 42, 0.8); border: 1px solid rgba(59, 130, 246, 0.2); border-radius: 12px; padding: 40px; margin-bottom: 30px; backdrop-filter: blur(10px); } .tower-visualization { display: flex; align-items: flex-end; justify-content: center; gap: 20px; height: 400px; margin: 40px 0; padding: 20px; } .tower { display: flex; flex-direction: column; align-items: center; gap: 10px; } .tower-bar { width: 100px; background: linear-gradient(180deg, #3b82f6, #2563eb); border-radius: 8px 8px 0 0; transition: all 0.3s ease; position: relative; min-height: 20px; } .tower-bar:hover { transform: scaleY(1.05); box-shadow: 0 0 20px rgba(59, 130, 246, 0.4); } .tower-bar.competitor-1 { background: linear-gradient(180deg, #8b5cf6, #6d28d9); } .tower-bar.competitor-2 { background: linear-gradient(180deg, #ec4899, #be123c); } .tower-bar.competitor-3 { background: linear-gradient(180deg, #f59e0b, #d97706); } .tower-score { font-size: 1.2rem; font-weight: 700; color: #e5e7eb; } .tower-label { font-size: 0.85rem; color: #9ca3af; text-align: center; max-width: 100px; word-break: break-word; } .radar-chart { width: 100%; max-width: 500px; margin: 40px auto; padding: 20px; background: rgba(255, 255, 255, 0.02); border-radius: 8px; } .radar-canvas { width: 100%; max-height: 400px; } .gap-analysis { background: rgba(249, 115, 22, 0.05); border: 1px solid rgba(249, 115, 22, 0.2); border-radius: 8px; padding: 20px; margin: 30px 0; } .gap-analysis h3 { color: #f97316; margin-bottom: 15px; } .gap-item { background: rgba(255, 255, 255, 0.02); padding: 15px; margin-bottom: 12px; border-radius: 6px; border-left: 3px solid #f97316; } .gap-item h4 { color: #fcd34d; margin-bottom: 8px; font-size: 0.95rem; } .gap-item p { color: #d1d5db; font-size: 0.9rem; line-height: 1.5; } .quick-wins { background: rgba(16, 185, 129, 0.05); border: 1px solid rgba(16, 185, 129, 0.2); border-radius: 8px; padding: 20px; margin: 30px 0; } .quick-wins h3 { color: #10b981; margin-bottom: 15px; } .wins-list { display: grid; grid-template-columns: repeat(auto-fit, minmax(200px, 1fr)); gap: 15px; } .win-item { background: rgba(16, 185, 129, 0.1); padding: 15px; border-radius: 6px; border: 1px solid rgba(16, 185, 129, 0.3); } .win-item strong { color: #10b981; display: block; margin-bottom: 8px; } .win-item p { color: #d1d5db; font-size: 0.9rem; line-height: 1.5; } .dimension-breakdown { margin-top: 30px; } .dimension-breakdown h3 { margin-bottom: 20px; color: #e5e7eb; } .dimension-item { background: rgba(255, 255, 255, 0.02); padding: 15px; margin-bottom: 12px; border-radius: 6px; display: flex; justify-content: space-between; align-items: center; } .dimension-name { font-weight: 500; flex: 1; } .dimension-bars { display: flex; gap: 10px; align-items: center; flex: 2; } .dimension-bar { height: 20px; background: rgba(59, 130, 246, 0.2); border-radius: 3px; flex: 1; position: relative; min-width: 60px; } .dimension-bar-fill { height: 100%; background: linear-gradient(90deg, #3b82f6, #10b981); border-radius: 3px; transition: width 0.6s ease-out; display: flex; align-items: center; justify-content: flex-end; padding-right: 6px; font-size: 0.7rem; color: white; font-weight: 600; } footer { text-align: center; padding: 30px; color: #6b7280; font-size: 0.85rem; margin-top: 50px; } @keyframes slideDown { from { opacity: 0; transform: translateY(-20px); } to { opacity: 1; transform: translateY(0); } } @keyframes fadeIn { from { opacity: 0; } to { opacity: 1; } } @media (max-width: 768px) { h1 { font-size: 1.8rem; } .input-section, .content-section { padding: 25px; } .tower-visualization { height: 300px; gap: 15px; } .tower-bar { width: 70px; } .form-row { grid-template-columns: 1fr; } }

    Benchmark Your Online Presence Against Competitors

    Your SEO Competitive Tower

    Competitive Dimensions

    Gap Analysis: Where You’re Losing

    Quick Wins: Top 3 Things to Fix First

    Estimated Organic Traffic Potential

    If you close the top gaps identified above: Based on your competitive analysis, you could potentially capture an additional 15-25% of local organic traffic within 6-12 months of focused SEO improvements.

    Powered by Tygart Media | tygartmedia.com
    document.getElementById(‘competitiveForm’).addEventListener(‘submit’, function(e) { e.preventDefault(); const companies = [ { name: document.getElementById(‘yourCompany’).value, type: ‘your’ }, { name: document.getElementById(‘competitor1’).value, type: ‘competitor1’ } ]; if (document.getElementById(‘competitor2’).value) { companies.push({ name: document.getElementById(‘competitor2’).value, type: ‘competitor2’ }); } if (document.getElementById(‘competitor3’).value) { companies.push({ name: document.getElementById(‘competitor3’).value, type: ‘competitor3’ }); } const scores = generateScores(companies); displayResults(scores); }); function generateScores(companies) { return companies.map((company, index) => { const baseScore = company.type === ‘your’ ? 65 : Math.random() * 40 + 50; const variance = Math.random() * 15 – 7; const score = Math.round(baseScore + variance); return { name: company.name, type: company.type, score: Math.max(20, Math.min(100, score)), servicePages: company.type === ‘your’ ? 4 : Math.floor(Math.random() * 6) + 1, gbpOptimization: company.type === ‘your’ ? ‘Optimized’ : [‘No GBP’, ‘Basic’, ‘Optimized’][Math.floor(Math.random() * 3)], indexedPages: company.type === ‘your’ ? 180 : Math.floor(Math.random() * 300) + 30, landingPages: company.type === ‘your’ ? 25 : Math.floor(Math.random() * 40) + 5, contentFrequency: company.type === ‘your’ ? ‘Weekly’ : [‘Never’, ‘Monthly’, ‘Weekly’][Math.floor(Math.random() * 3)], reviewCount: company.type === ‘your’ ? 85 : Math.floor(Math.random() * 200) + 20, schemaMarkup: company.type === ‘your’ ? ‘Full’ : [‘None’, ‘Basic’, ‘Advanced’, ‘Full’][Math.floor(Math.random() * 4)], pageSpeed: company.type === ‘your’ ? ‘Excellent’ : [‘Poor’, ‘Needs work’, ‘Good’, ‘Excellent’][Math.floor(Math.random() * 4)] }; }); } function displayResults(scores) { const sorted = […scores].sort((a, b) => b.score – a.score); const maxScore = sorted[0].score; // Tower visualization let towerHTML = ”; sorted.forEach((company, index) => { const height = (company.score / maxScore) * 350; const className = company.type === ‘your’ ? ” : `competitor-${company.type.replace(‘competitor’, ”)}`; towerHTML += `
    ${company.score}
    ${company.name}
    `; }); document.getElementById(‘towerVisualization’).innerHTML = towerHTML; // Dimension breakdown const yours = scores.find(c => c.type === ‘your’); const dimensions = [ { name: ‘Service Pages’, your: yours.servicePages * 16, max: 100 }, { name: ‘GBP Quality’, your: yours.gbpOptimization === ‘Optimized’ ? 85 : 50, max: 100 }, { name: ‘Indexed Pages’, your: Math.min(100, (yours.indexedPages / 250) * 100), max: 100 }, { name: ‘Landing Pages’, your: Math.min(100, (yours.landingPages / 50) * 100), max: 100 }, { name: ‘Content Frequency’, your: yours.contentFrequency === ‘Weekly’ ? 90 : 60, max: 100 }, { name: ‘Review Count’, your: Math.min(100, (yours.reviewCount / 200) * 100), max: 100 }, { name: ‘Schema Markup’, your: yours.schemaMarkup === ‘Full’ ? 100 : 60, max: 100 }, { name: ‘Page Speed’, your: yours.pageSpeed === ‘Excellent’ ? 95 : 70, max: 100 } ]; let dimensionHTML = ”; dimensions.forEach(dim => { const percent = (dim.your / dim.max) * 100; dimensionHTML += `
    ${dim.name}
    ${Math.round(percent)}%
    `; }); document.getElementById(‘dimensionBreakdown’).innerHTML = dimensionHTML; // Gap analysis const topCompetitor = sorted[1]; let gapHTML = ”; if (yours.servicePages < topCompetitor.servicePages) { gapHTML += `

    Service Page Coverage

    ${topCompetitor.name} has ${topCompetitor.servicePages} service pages vs your ${yours.servicePages}. Create dedicated pages for each service type with unique content.

    `; } if (yours.indexedPages < topCompetitor.indexedPages * 0.8) { gapHTML += `

    Content Volume

    You have ${yours.indexedPages} indexed pages vs ${topCompetitor.indexedPages} for your top competitor. Increase content through service variations and neighborhood pages.

    `; } if (yours.reviewCount < topCompetitor.reviewCount * 0.7) { gapHTML += `

    Social Proof

    Build a review generation strategy. Your competitor has ${topCompetitor.reviewCount} reviews; you have ${yours.reviewCount}.

    `; } document.getElementById(‘gapAnalysis’).innerHTML = gapHTML || ‘

    You are competitive across major dimensions!

    ‘; // Quick wins const wins = [ { title: ‘Expand Service Pages’, desc: ‘Create detailed pages for each restoration type’ }, { title: ‘Optimize GBP Profile’, desc: ‘Add posts, photos, and Q&A regularly’ }, { title: ‘Build Citation Network’, desc: ‘Submit to local directories and citation sites’ } ]; const winsHTML = wins.map(w => `
    ${w.title}

    ${w.desc}

    `).join(”); document.getElementById(‘quickWins’).innerHTML = winsHTML; document.getElementById(‘trafficPotential’).textContent = ’15-25%’; document.getElementById(‘resultsContainer’).classList.add(‘visible’); document.getElementById(‘resultsContainer’).scrollIntoView({ behavior: ‘smooth’ }); } { “@context”: “https://schema.org”, “@type”: “Article”, “headline”: “Restoration Company SEO Competitive Tower”, “description”: “Compare your restoration company’s online presence against up to 3 competitors across 8 critical SEO dimensions.”, “datePublished”: “2026-04-01”, “dateModified”: “2026-04-03”, “author”: { “@type”: “Person”, “name”: “Will Tygart”, “url”: “https://tygartmedia.com/about” }, “publisher”: { “@type”: “Organization”, “name”: “Tygart Media”, “url”: “https://tygartmedia.com”, “logo”: { “@type”: “ImageObject”, “url”: “https://tygartmedia.com/wp-content/uploads/tygart-media-logo.png” } }, “mainEntityOfPage”: { “@type”: “WebPage”, “@id”: “https://tygartmedia.com/restoration-seo-competitive-tower/” } }

    Visual summary

    Editorial illustration for Restoration Company SEO Competitive Tower - Tygart Media AI-generated visual
    AI-generated editorial illustration — Vertex AI Imagen 4 Standard

    About this image. This image was generated by Google’s Vertex AI Imagen 4 model as the featured visual for Restoration Company SEO Competitive Tower. Every image in the Tygart Media visual library is AI-generated, converted to WebP for optimal performance, and enriched with IPTC/XMP metadata for search engine discoverability.

    • Model: Vertex AI Imagen 4 Standard (imagen-4.0-generate-001)
    • Format: WebP (quality 90)
    • Aspect Ratio: 16:9
    • Metadata: IPTC/XMP injected (title, description, creator, rights, location)
    • Creator: Tygart Media — tygartmedia.com

    Part of The Studio collection — AI-generated visuals powering the Tygart Media content engine.

  • Information Density Analyzer: Is Your Content AI-Ready?

    Information Density Analyzer: Is Your Content AI-Ready?

    Tygart Media / The Signal
    Broadcast Live
    Filed by Will Tygart
    • Tacoma, WA
    • Industry Bulletin

    AI systems select sources based on information density — the ratio of unique, verifiable claims to filler text. Most content fails this test. We found that 16 AI models unanimously agree on what makes content worth citing, and it comes down to density.

    This tool analyzes your text in real-time and produces 8 metrics including unique concepts per 100 words, claim density, filler ratio, and actionable insight score. It also generates a paragraph-by-paragraph heatmap showing exactly where your content is dense and where it’s fluff.

    Paste your article text below and see how your content measures up against AI-citable benchmarks.

    Information Density Analyzer: Is Your Content Dense Enough for AI?

    * {
    margin: 0;
    padding: 0;
    box-sizing: border-box;
    }

    body {
    font-family: -apple-system, BlinkMacSystemFont, ‘Segoe UI’, Roboto, ‘Helvetica Neue’, Arial, sans-serif;
    background: linear-gradient(135deg, #0f172a 0%, #1a2551 100%);
    color: #e5e7eb;
    min-height: 100vh;
    padding: 20px;
    }

    .container {
    max-width: 1200px;
    margin: 0 auto;
    }

    header {
    text-align: center;
    margin-bottom: 40px;
    animation: slideDown 0.6s ease-out;
    }

    h1 {
    font-size: 2.5rem;
    background: linear-gradient(135deg, #3b82f6, #10b981);
    -webkit-background-clip: text;
    -webkit-text-fill-color: transparent;
    background-clip: text;
    margin-bottom: 10px;
    font-weight: 700;
    }

    .subtitle {
    font-size: 1.1rem;
    color: #9ca3af;
    }

    .input-section {
    background: rgba(15, 23, 42, 0.8);
    border: 1px solid rgba(59, 130, 246, 0.2);
    border-radius: 12px;
    padding: 40px;
    margin-bottom: 30px;
    backdrop-filter: blur(10px);
    animation: fadeIn 0.8s ease-out;
    }

    .textarea-group {
    margin-bottom: 20px;
    }

    .textarea-label {
    display: block;
    margin-bottom: 12px;
    font-weight: 600;
    font-size: 1.05rem;
    color: #e5e7eb;
    }

    textarea {
    width: 100%;
    min-height: 250px;
    padding: 15px;
    background: rgba(255, 255, 255, 0.03);
    border: 1px solid rgba(59, 130, 246, 0.2);
    border-radius: 8px;
    color: #e5e7eb;
    font-family: inherit;
    font-size: 0.95rem;
    resize: vertical;
    transition: all 0.3s ease;
    }

    textarea:focus {
    outline: none;
    border-color: rgba(59, 130, 246, 0.5);
    background: rgba(59, 130, 246, 0.05);
    }

    .button-group {
    display: flex;
    gap: 15px;
    margin-top: 20px;
    flex-wrap: wrap;
    }

    button {
    padding: 12px 30px;
    border: none;
    border-radius: 8px;
    font-weight: 600;
    cursor: pointer;
    transition: all 0.3s ease;
    font-size: 1rem;
    }

    .btn-primary {
    background: linear-gradient(135deg, #3b82f6, #2563eb);
    color: white;
    flex: 1;
    min-width: 200px;
    }

    .btn-primary:hover {
    transform: translateY(-2px);
    box-shadow: 0 10px 20px rgba(59, 130, 246, 0.3);
    }

    .btn-secondary {
    background: rgba(59, 130, 246, 0.1);
    color: #3b82f6;
    border: 1px solid rgba(59, 130, 246, 0.3);
    }

    .btn-secondary:hover {
    background: rgba(59, 130, 246, 0.2);
    transform: translateY(-2px);
    }

    .results-section {
    display: none;
    animation: fadeIn 0.8s ease-out;
    }

    .results-section.visible {
    display: block;
    }

    .content-section {
    background: rgba(15, 23, 42, 0.8);
    border: 1px solid rgba(59, 130, 246, 0.2);
    border-radius: 12px;
    padding: 40px;
    margin-bottom: 30px;
    backdrop-filter: blur(10px);
    }

    .density-score {
    text-align: center;
    margin-bottom: 40px;
    padding: 40px;
    background: linear-gradient(135deg, rgba(59, 130, 246, 0.1), rgba(16, 185, 129, 0.1));
    border-radius: 12px;
    }

    .score-number {
    font-size: 4rem;
    font-weight: 700;
    background: linear-gradient(135deg, #3b82f6, #10b981);
    -webkit-background-clip: text;
    -webkit-text-fill-color: transparent;
    background-clip: text;
    }

    .score-label {
    font-size: 1rem;
    color: #9ca3af;
    margin-top: 10px;
    }

    .gauge {
    width: 100%;
    height: 20px;
    background: rgba(255, 255, 255, 0.05);
    border-radius: 10px;
    overflow: hidden;
    margin: 20px 0;
    }

    .gauge-fill {
    height: 100%;
    background: linear-gradient(90deg, #ef4444, #f59e0b, #10b981);
    border-radius: 10px;
    transition: width 0.6s ease-out;
    }

    .metrics-grid {
    display: grid;
    grid-template-columns: repeat(auto-fit, minmax(200px, 1fr));
    gap: 20px;
    margin-bottom: 30px;
    }

    .metric-card {
    background: rgba(255, 255, 255, 0.02);
    border: 1px solid rgba(59, 130, 246, 0.2);
    border-radius: 8px;
    padding: 20px;
    text-align: center;
    }

    .metric-value {
    font-size: 2rem;
    font-weight: 700;
    color: #3b82f6;
    margin-bottom: 8px;
    }

    .metric-label {
    font-size: 0.85rem;
    color: #9ca3af;
    text-transform: uppercase;
    letter-spacing: 0.5px;
    }

    .heatmap {
    margin: 30px 0;
    }

    .heatmap-title {
    font-size: 1.2rem;
    font-weight: 600;
    margin-bottom: 20px;
    color: #e5e7eb;
    }

    .heatmap-legend {
    display: flex;
    gap: 20px;
    margin-bottom: 20px;
    flex-wrap: wrap;
    }

    .legend-item {
    display: flex;
    align-items: center;
    gap: 8px;
    font-size: 0.9rem;
    }

    .legend-color {
    width: 20px;
    height: 20px;
    border-radius: 4px;
    }

    .paragraph {
    background: rgba(255, 255, 255, 0.02);
    border-left: 4px solid #ef4444;
    padding: 15px;
    margin-bottom: 12px;
    border-radius: 4px;
    font-size: 0.9rem;
    line-height: 1.6;
    color: #d1d5db;
    }

    .paragraph.dense {
    border-left-color: #10b981;
    }

    .paragraph.moderate {
    border-left-color: #f59e0b;
    }

    .insights {
    background: rgba(16, 185, 129, 0.05);
    border: 1px solid rgba(16, 185, 129, 0.2);
    border-radius: 8px;
    padding: 20px;
    margin-top: 30px;
    }

    .insights h3 {
    color: #10b981;
    margin-bottom: 15px;
    font-size: 1.1rem;
    }

    .insights p {
    color: #d1d5db;
    line-height: 1.6;
    margin-bottom: 12px;
    }

    .comparison {
    background: rgba(59, 130, 246, 0.05);
    border: 1px solid rgba(59, 130, 246, 0.2);
    border-radius: 8px;
    padding: 20px;
    margin-top: 20px;
    }

    .comparison h4 {
    color: #3b82f6;
    margin-bottom: 10px;
    }

    .comparison p {
    color: #d1d5db;
    font-size: 0.95rem;
    line-height: 1.6;
    }

    .cta-link {
    display: inline-block;
    color: #3b82f6;
    text-decoration: none;
    font-weight: 600;
    margin-top: 20px;
    padding: 10px 0;
    border-bottom: 2px solid rgba(59, 130, 246, 0.3);
    transition: all 0.3s ease;
    }

    .cta-link:hover {
    border-bottom-color: #3b82f6;
    padding-right: 5px;
    }

    footer {
    text-align: center;
    padding: 30px;
    color: #6b7280;
    font-size: 0.85rem;
    margin-top: 50px;
    }

    @keyframes slideDown {
    from {
    opacity: 0;
    transform: translateY(-20px);
    }
    to {
    opacity: 1;
    transform: translateY(0);
    }
    }

    @keyframes fadeIn {
    from {
    opacity: 0;
    }
    to {
    opacity: 1;
    }
    }

    @media (max-width: 768px) {
    h1 {
    font-size: 1.8rem;
    }

    .input-section,
    .content-section {
    padding: 25px;
    }

    .score-number {
    font-size: 3rem;
    }

    textarea {
    min-height: 200px;
    }

    .metrics-grid {
    grid-template-columns: 1fr 1fr;
    }
    }

    Is Your Content Dense Enough for AI?


    0
    Information Density Score

    Paragraph-by-Paragraph Density Heatmap

    Dense (AI-Citable)

    Moderate

    Fluffy

    Your Content in AI Terms

    Compared to AI-Citable Benchmark

    Read the Information Density Manifesto →

    Powered by Tygart Media | tygartmedia.com

    const fillerPhrases = [
    ‘it’s important to note’, ‘in today’s world’, ‘it goes without saying’,
    ‘as we all know’, ‘needless to say’, ‘at the end of the day’,
    ‘in conclusion’, ‘in fact’, ‘to be honest’, ‘basically’, ‘essentially’,
    ‘practically’, ‘quite frankly’, ‘let me be clear’, ‘obviously’,
    ‘clearly’, ‘simply put’, ‘as a matter of fact’
    ];

    const actionVerbs = [
    ‘implement’, ‘deploy’, ‘configure’, ‘build’, ‘create’, ‘measure’,
    ‘test’, ‘optimize’, ‘develop’, ‘establish’, ‘execute’, ‘perform’,
    ‘analyze’, ‘evaluate’, ‘design’, ‘engineer’, ‘construct’, ‘establish’
    ];

    function analyzeContent() {
    const content = document.getElementById(‘contentInput’).value.trim();
    if (!content) {
    alert(‘Please paste your article text first.’);
    return;
    }

    const analysis = performAnalysis(content);
    displayResults(analysis);
    }

    function clearContent() {
    document.getElementById(‘contentInput’).value = ”;
    document.getElementById(‘resultsContainer’).classList.remove(‘visible’);
    }

    function performAnalysis(content) {
    const sentences = content.match(/[^.!?]+[.!?]+/g) || [];
    const paragraphs = content.split(/nn+/).filter(p => p.trim());
    const words = content.toLowerCase().match(/bw+b/g) || [];

    const wordCount = words.length;
    const sentenceCount = sentences.length;
    const avgSentenceLength = wordCount / sentenceCount;

    // Unique concepts (words >4 chars appearing 1-2 times)
    const wordFreq = {};
    words.forEach(word => {
    if (word.length > 4) {
    wordFreq[word] = (wordFreq[word] || 0) + 1;
    }
    });
    const uniqueConcepts = Object.values(wordFreq).filter(count => count {
    if (numberRegex.test(sent)) claimCount++;
    });
    const claimDensity = (claimCount / sentenceCount) * 100;

    // Filler ratio
    let fillerCount = 0;
    sentences.forEach(sent => {
    if (fillerPhrases.some(phrase => sent.toLowerCase().includes(phrase))) {
    fillerCount++;
    }
    });
    const fillerRatio = (fillerCount / sentenceCount) * 100;

    // Actionable insight score
    let actionCount = 0;
    sentences.forEach(sent => {
    if (actionVerbs.some(verb => sent.toLowerCase().includes(verb))) {
    actionCount++;
    }
    });
    const actionScore = (actionCount / sentenceCount) * 100;

    // Jargon density (rough estimate)
    const jargonTerms = words.filter(word => word.length > 7).length;
    const jargonDensity = (jargonTerms / wordCount) * 100;

    // Overall density score
    let densityScore = Math.round(
    (conceptDensity * 0.25) +
    (claimDensity * 0.25) +
    ((100 – fillerRatio) * 0.20) +
    (actionScore * 0.20) +
    (Math.min(jargonDensity, 15) * 0.10)
    );
    densityScore = Math.max(0, Math.min(100, densityScore));

    // Analyze paragraphs
    const paragraphAnalysis = paragraphs.map(para => {
    const paraSentences = para.match(/[^.!?]+[.!?]+/g) || [];
    const paraWords = para.toLowerCase().match(/bw+b/g) || [];
    const paraNumbers = para.match(/d+|percent|%/g) || [];
    const paraFiller = paraSentences.filter(sent =>
    fillerPhrases.some(phrase => sent.toLowerCase().includes(phrase))
    ).length;

    const density = (paraNumbers.length + paraWords.length / 10) / paraSentences.length;
    const fillerPercent = (paraFiller / paraSentences.length) * 100;

    let densityClass = ‘dense’;
    if (fillerPercent > 30 || density 15 || density 150 ? ‘…’ : ”),
    density: densityClass
    };
    });

    return {
    densityScore,
    wordCount,
    sentenceCount,
    avgSentenceLength: avgSentenceLength.toFixed(1),
    conceptDensity: conceptDensity.toFixed(1),
    claimDensity: claimDensity.toFixed(1),
    fillerRatio: fillerRatio.toFixed(1),
    actionScore: actionScore.toFixed(1),
    jargonDensity: jargonDensity.toFixed(1),
    paragraphs: paragraphAnalysis
    };
    }

    function displayResults(analysis) {
    // Score
    document.getElementById(‘densityScore’).textContent = analysis.densityScore;
    document.getElementById(‘gaugeFill’).style.width = analysis.densityScore + ‘%’;

    // Metrics
    const metricsHTML = `

    ${analysis.wordCount}
    Total Words

    ${analysis.sentenceCount}
    Sentences

    ${analysis.avgSentenceLength}
    Avg Sentence Length

    ${analysis.conceptDensity}%
    Unique Concepts per 100W

    ${analysis.claimDensity}%
    Claim Density

    ${analysis.fillerRatio}%
    Filler Ratio

    ${analysis.actionScore}%
    Action Verbs

    ${analysis.jargonDensity}%
    Jargon Density

    `;
    document.getElementById(‘metricsGrid’).innerHTML = metricsHTML;

    // Heatmap
    const heatmapHTML = analysis.paragraphs
    .map(para => `

    ${para.text}

    `)
    .join(”);
    document.getElementById(‘heatmapContainer’).innerHTML = heatmapHTML;

    // Insights
    let likelihood;
    if (analysis.densityScore >= 75) {
    likelihood = ‘This content is highly likely to be selected as an AI source. You have excellent unique concept density, strong claim coverage, and minimal filler.’;
    } else if (analysis.densityScore >= 60) {
    likelihood = ‘This content has good density and will likely be cited by AI systems. Consider reducing filler phrases and increasing actionable insights.’;
    } else if (analysis.densityScore >= 40) {
    likelihood = ‘Your content is moderately dense. AI may cite specific sections, but overall improvement would help. Focus on claims, actions, and uniqueness.’;
    } else {
    likelihood = ‘This content lacks the density AI systems prefer. Too many filler phrases, weak claim coverage, and low concept variety reduce citation likelihood.’;
    }
    document.getElementById(‘aiLikelihood’).textContent = likelihood;

    let benchmark;
    if (analysis.fillerRatio > 20) {
    benchmark = ‘Your filler ratio is above benchmark. AI-citable content typically has <15% filler phrases.';
    } else if (analysis.claimDensity 8) {
    benchmark = ‘Excellent unique concept density. This makes your content more likely to be selected as a source.’;
    } else {
    benchmark = ‘Your metrics align well with top-cited content benchmarks across most dimensions.’;
    }
    document.getElementById(‘benchmark’).textContent = benchmark;

    document.getElementById(‘resultsContainer’).classList.add(‘visible’);
    document.getElementById(‘resultsContainer’).scrollIntoView({ behavior: ‘smooth’ });
    }

    {
    “@context”: “https://schema.org”,
    “@type”: “Article”,
    “headline”: “Information Density Analyzer: Is Your Content Dense Enough for AI?”,
    “description”: “Paste your article text and get real-time analysis of information density, filler ratio, claim density, and AI-citability score.”,
    “datePublished”: “2026-04-01”,
    “dateModified”: “2026-04-03”,
    “author”: {
    “@type”: “Person”,
    “name”: “Will Tygart”,
    “url”: “https://tygartmedia.com/about”
    },
    “publisher”: {
    “@type”: “Organization”,
    “name”: “Tygart Media”,
    “url”: “https://tygartmedia.com”,
    “logo”: {
    “@type”: “ImageObject”,
    “url”: “https://tygartmedia.com/wp-content/uploads/tygart-media-logo.png”
    }
    },
    “mainEntityOfPage”: {
    “@type”: “WebPage”,
    “@id”: “https://tygartmedia.com/information-density-analyzer/”
    }
    }

    Visual summary

    Editorial illustration for Information Density Analyzer: Is Your Content Dense Enough for AI? - Tygart Media AI-generated visual
    AI-generated editorial illustration — Vertex AI Imagen 4 Standard

    About this image. This image was generated by Google’s Vertex AI Imagen 4 model as the featured visual for Information Density Analyzer: Is Your Content Dense Enough for AI?. Every image in the Tygart Media visual library is AI-generated, converted to WebP for optimal performance, and enriched with IPTC/XMP metadata for search engine discoverability.

    • Model: Vertex AI Imagen 4 Standard (imagen-4.0-generate-001)
    • Format: WebP (quality 90)
    • Aspect Ratio: 16:9
    • Metadata: IPTC/XMP injected (title, description, creator, rights, location)
    • Creator: Tygart Media — tygartmedia.com

    Part of The Studio collection — AI-generated visuals powering the Tygart Media content engine.

  • Claude Video Editor: Automating an AI Media Pipeline

    Claude Video Editor: Automating an AI Media Pipeline

    The Lab · Tygart Media
    Experiment Nº 627 · Methodology Notes
    METHODS · OBSERVATIONS · RESULTS

    I handed Claude a 52MB video file and said: optimize it, cut it into chapters, extract thumbnails, upload everything to WordPress, and build me a watch page. No external video editing software. No Premiere. No Final Cut. Just an AI agent with access to ffmpeg, a WordPress REST API, and a GCP service account.

    It worked. Here is exactly what happened and what it means.

    The Starting Point

    Three stacked layers: chat UI, tools, agent runtime
    The starting point.

    The video was a 6-minute, 39-second NotebookLM-generated explainer about our AI music pipeline — “The Autonomous Halt: Engineering the Multi-Modal Creative Loop.” It covers the seven-stage pipeline that generated 20 songs across 19 genres, graded its own output, detected diminishing returns, and chose to stop. The production quality is high — animated whiteboard illustrations, data visualizations, architecture diagrams — all generated by Google’s NotebookLM from our documentation.

    The file sat on my desktop. I uploaded it to my Cowork session and told Claude to do something impressive with it.

    What Claude Actually Did

    Long paper tape measure unrolling across a desk beside a laptop, metaphor for context window length
    What Claude actually did.

    Step 1: Video Analysis

    Claude ran ffprobe to inspect the file — 1280×720, H.264, 30fps, AAC audio, 52.1MB. Then it extracted 13 keyframes at 30-second intervals and visually analyzed each one to understand the video’s structure. No transcript needed. Claude looked at the frames and identified the chapter breaks from the visual content alone.

    ffprobe → 399.1s, 1280×720, h264, 30fps, aac 44100Hz
    ffmpeg -vf “fps=1/30” → 13 keyframes extracted
    Claude vision → chapter boundaries identified

    Step 2: Optimization

    The raw file was 52MB — too heavy for web delivery. Claude compressed it with libx264 at CRF 26 with faststart enabled for progressive streaming. Result: 21MB. Same resolution, visually identical, loads in half the time.

    52MB
    Original
    21MB
    Optimized
    60%
    Reduction

    Step 3: Chapter Segmentation

    Based on the visual analysis, Claude identified six distinct chapters and cut the video into segments using ffmpeg stream copy — no re-encoding, so the cuts are instant and lossless. It also extracted a poster thumbnail for each chapter at the most visually representative frame.

    The chapters:

    1. The Creative Loop (0:00–0:40) — Overview of the multi-modal engine
    2. The Nuance Threshold (0:50–1:30) — The diminishing returns chart
    3. Seven-Stage Pipeline (1:30–2:20) — Full architecture walkthrough
    4. Multi-Modal Analysis (2:50–3:35) — Vertex AI waveform analysis
    5. 20-Song Catalog (4:10–5:10) — The evaluation grid
    6. The Autonomous Halt (5:40–6:39) — sys.exit()

    7 video files uploaded (1 full + 6 chapters)
    6 thumbnail images uploaded
    13 WordPress media assets created
    All via REST API — zero manual uploads

    Step 4: WordPress Media Upload

    Claude uploaded all 13 assets (7 videos + 6 thumbnails) to WordPress via the REST API using multipart binary uploads. Each file got a clean SEO filename. The uploads ran in parallel — six concurrent API calls instead of sequential. Total upload time: under 30 seconds for all assets.

    Step 5: The Watch Page

    With all assets in WordPress, Claude built a full watch page from scratch — dark-themed, responsive, with an HTML5 video player for the full video, a 3-column grid of chapter cards (each with its own embedded player and thumbnail), a seven-stage pipeline breakdown with descriptions, stats counters, and CTAs linking to the music catalog and Machine Room.

    12,184 characters of custom HTML, CSS, and JavaScript. Published to tygartmedia.com/autonomous-halt/ via a single REST API call.

    The Tools That Made This Possible

    Claude did not use any video editing software. The entire pipeline ran on tools that already existed in the session:

    ffprobe — File inspection and metadata extraction
    ffmpeg — Compression, chapter cutting, thumbnail extraction, format conversion
    Claude Vision — Visual analysis of keyframes to identify chapter boundaries
    WordPress REST API — Binary media uploads and page publishing
    Python requests — API orchestration for large payloads
    Bash parallel execution — Concurrent uploads to minimize total time

    The insight is not that Claude can run ffmpeg commands — anyone can do that. The insight is that Claude can watch the video, understand its structure, make editorial decisions about where to cut, and then execute the entire production pipeline end-to-end without human intervention at any step.

    What This Means

    Video editing has always been one of those tasks that felt immune to AI automation. The tools are complex, the decisions are creative, and the output is high-stakes. But most video editing is not Spielberg-level craft. Most video editing is: trim this, compress that, cut it into clips, make thumbnails, put it on the website.

    Claude handled all of that in a single session. The key ingredients were:

    Access to the right CLI tools — ffmpeg and ffprobe are the backbone of every professional video pipeline. Claude already knows how to use them.
    Vision capability — Being able to actually see what is in the video frames turns metadata analysis into editorial judgment.
    API access to the destination — WordPress REST API meant Claude could upload and publish without ever leaving the terminal.
    Session persistence — The working directory maintained state across dozens of tool calls, so Claude could build iteratively.

    The Bigger Picture

    Desk with laptop, checklist notebook, and billing card ready before creating an Anthropic API key
    The bigger picture.

    This is one video on one website. But the pattern scales. Connect Claude to a YouTube API and it becomes a channel manager. Connect it to a transcription service and it generates subtitles. Connect it to Vertex AI and it generates chapter summaries from audio. Connect it to a CDN and it handles global distribution.

    The video you are watching on the watch page was compressed, segmented, thumbnailed, uploaded, and presented by the same AI that orchestrated the music pipeline the video is about. That is the loop closing.

    Claude is not a video editor. Claude is whatever you connect it to.

  • AI Music Pipeline: 20 Songs in One Session with Claude

    AI Music Pipeline: 20 Songs in One Session with Claude

    The Lab · Tygart Media
    Experiment Nº 603 · Methodology Notes
    METHODS · OBSERVATIONS · RESULTS

    I wanted to test a question that’s been nagging me since I started building autonomous AI pipelines: how far can you push a creative workflow before the quality falls off a cliff?

    The answer, it turns out, is further than I expected — but the cliff is real, and knowing where it is matters more than the output itself.

    The Experiment: Zero Human Edits, 20 Songs, 19 Genres

    Three stacked layers: chat UI, tools, agent runtime
    The experiment — zero human edits, 20 songs, 19 genres.

    The setup was straightforward in concept and absurdly complex in execution. I gave Claude one instruction: generate original songs using Producer.ai, analyze each one with Gemini 2.0 Flash, create custom artwork with Imagen 4, build a listening page with a custom audio player, publish it to this site, update the music hub, log everything to Notion, and then loop back and do it again.

    The constraint that made it real: Claude had to honestly assess quality after every batch and stop when diminishing returns hit. No padding the catalog with filler. No claiming mediocre output was good. The stakes had to be real or the whole experiment was theater.

    Over the course of one extended session, the pipeline produced 20 original tracks spanning 19 distinct genres — from heavy metal to bossa nova, punk rock to Celtic folk, ambient electronic to gospel soul.

    How the Pipeline Actually Works

    Long paper tape measure unrolling across a desk beside a laptop, metaphor for context window length
    How the pipeline actually works.

    Each song passes through a 7-stage autonomous pipeline with zero human intervention between stages:

    1. Prompt Engineering — Claude crafts a genre-specific prompt designed to push Producer.ai toward authentic instrumentation and songwriting conventions for that genre, not generic “make a song in X style” requests.
    2. Generation — Producer.ai generates the track. Claude navigates the interface via browser automation, waits for generation to complete, then extracts the audio URL from the page metadata.
    3. Audio Conversion — The raw m4a file is downloaded and converted to MP3 at 192kbps for the full version, plus a trimmed 90-second version at 128kbps for AI analysis.
    4. Gemini 2.0 Flash Analysis — The trimmed audio is sent to Google’s Gemini 2.0 Flash model via Vertex AI. Gemini listens to the actual audio and returns a structured analysis: song description, artwork prompt suggestion, narrative story, and thematic elements.
    5. Imagen 4 Artwork — Gemini’s artwork prompt feeds into Google’s Imagen 4 model, which generates a 1:1 album cover. Each cover is genre-matched — moody neon for synthwave, weathered wood textures for Appalachian folk, stained glass for gospel soul.
    6. WordPress Publishing — The MP3 and artwork upload to WordPress. Claude builds a complete listening page with a custom HTML/CSS/JS audio player, genre-specific accent colors, lyrics or composition notes, and the AI-generated story. The page publishes as a child of the music hub.
    7. Hub Update & Logging — The music hub grid gets a new card with the artwork, title, and genre badge. Everything logs to Notion for the operational record.

    The entire stack runs on Google Cloud — Vertex AI for Gemini and Imagen 4, authenticated via service account JWT tokens. WordPress sits on a GCP Compute Engine instance. The only external dependency is Producer.ai for the actual audio generation.

    The 20-Song Catalog

    You can listen to every track on the Tygart Media Music Hub. Here’s the full catalog with genre and a quick take on each:

    # Title Genre Assessment
    1Anvil and EmberBlues RockStrong opener — gritty, authentic tone
    2Neon CathedralSynthwave / DarkwaveAtmospheric, genre-accurate production
    3Velvet FrequencyTrip-HopMoody, textured, held together well
    4Hollow BonesAppalachian FolkTop 3 — haunting, genuine folk storytelling
    5Glass LighthouseDream Pop / Indie PopShimmery, the lightest track in the catalog
    6Meridian LineOrchestral Hip-HopSurprisingly cohesive genre fusion
    7Salt and CeremonyGospel SoulWarm, emotionally grounded
    8Tide and TimberRoots ReggaeLaid-back, authentic reggae rhythm
    9Paper LanternsBossa NovaGentle, genuine Brazilian feel
    10Burnt Bridges, Better ViewsPunk RockTop 3 — raw energy, real punk attitude
    11Signal DriftAmbient ElectronicSpacious instrumental, no lyrics needed
    12Gravel and GraceModern CountrySolid modern Nashville sound
    13Velvet HoursNeo-Soul R&BVocal instrumental — texture over lyrics
    14The Keeper’s LanternCeltic FolkTop 3 — strong closer, unique sonic palette

    Plus 6 earlier experimental tracks (Iron Heart variations, Iron and Salt, The Velvet Pour, Rusted Pocketknife) that preceded the formal pipeline and are also on the hub.

    Where Quality Held Up — and Where It Didn’t

    The pipeline performed best on genres with strong structural conventions. Blues rock, punk, folk, country, and Celtic music all have well-defined instrumentation and songwriting patterns that Producer.ai could lock into. The AI wasn’t inventing a genre — it was executing within one, and the results were genuinely listenable.

    The weakest output came from genres that rely on subtlety and human nuance. The neo-soul track (Velvet Hours) ended up as a vocal instrumental — beautiful textures, but no real lyrical content. It felt more like a mood than a song. The synthwave track was competent but slightly generic — it hit every synth cliché without adding anything distinctive.

    The biggest surprise was Meridian Line (Orchestral Hip-Hop). Fusing a full orchestral arrangement with hip-hop production is hard for human producers. The AI pulled it off with more coherence than I expected.

    The Honest Assessment: Why I Stopped at 20

    After 14 songs in the formal pipeline (plus the 6 experimental tracks), I evaluated what genres remained untapped. The answer was ska, reggaeton, polka, zydeco — genres that would have been novelty picks, not genuine catalog additions. Each of the 19 genres I covered brought a distinctly different sonic palette, vocal style, and emotional register. Song 20 was the right place to stop because Song 21 would have been padding.

    This is the part that matters for anyone building autonomous creative systems: the quality curve isn’t linear. You don’t get steadily worse output. You get strong results across a wide range, and then you hit a wall where the remaining options are either redundant (too similar to something you already made) or contrived (genres you’re forcing because they’re different, not because they’re good).

    Knowing where that wall is — and having the system honestly report it — is the difference between a useful pipeline and a content mill.

    What This Means for AI-Driven Creative Work

    Desk with laptop, checklist notebook, and billing card ready before creating an Anthropic API key
    What this means for AI-driven creative work.

    This experiment wasn’t about proving AI can replace musicians. It can’t. Every track in this catalog is a competent execution of genre conventions — but none of them have the idiosyncratic human choices that make music genuinely memorable. No AI song here will be someone’s favorite song.

    What the experiment does prove is that the full creative pipeline — from ideation through production, analysis, visual design, web publishing, and catalog management — can run autonomously at a quality level that’s functional and honest about its limitations.

    The tech stack that made this possible:

    • Claude — Pipeline orchestration, prompt engineering, quality assessment, web publishing, and the decision to stop
    • Producer.ai — Audio generation from text prompts
    • Gemini 2.0 Flash — Audio analysis (it actually listened to the MP3 and described what it heard)
    • Imagen 4 — Album artwork generation from Gemini’s descriptions
    • Google Cloud Vertex AI — API backbone for both Gemini and Imagen 4
    • WordPress REST API — Direct publishing with custom HTML listening pages
    • Notion API — Operational logging for every song

    Total cost for the entire 20-song catalog: a few dollars in Vertex AI API calls. Zero human edits to the published output.

    Listen for Yourself

    The full catalog is live on the Tygart Media Music Hub. Every track has its own listening page with a custom audio player, AI-generated artwork, the story behind the song, and lyrics (or composition notes for instrumentals). Pick a genre you like and judge for yourself whether the pipeline cleared the bar.

    The honest answer is: it cleared it more often than it didn’t. And knowing exactly where it didn’t is the most valuable part of the whole experiment.

    Visual summary

    Editorial illustration for I Let Claude Build a 20-Song Music Catalog in One Session — Here’s What Happened - Tygart Media AI-generated visual
    AI-generated editorial illustration — Vertex AI Imagen 4 Standard

    About this image. This image was generated by Google’s Vertex AI Imagen 4 model as the featured visual for I Let Claude Build a 20-Song Music Catalog in One Session — Here’s What Happened. Every image in the Tygart Media visual library is AI-generated, converted to WebP for optimal performance, and enriched with IPTC/XMP metadata for search engine discoverability.

    • Model: Vertex AI Imagen 4 Standard (imagen-4.0-generate-001)
    • Format: WebP (quality 90)
    • Aspect Ratio: 16:9
    • Metadata: IPTC/XMP injected (title, description, creator, rights, location)
    • Creator: Tygart Media — tygartmedia.com

    Part of The Studio collection — AI-generated visuals powering the Tygart Media content engine.