Content Strategy - Tygart Media

Category: Content Strategy

Content is not blog posts — it is infrastructure. Every article, landing page, and resource you publish either builds authority or wastes bandwidth. We cover the architecture behind content that ranks, converts, and compounds: hub-and-spoke models, pillar pages, content velocity, and the editorial strategies that turn a restoration company website into the most authoritative source in their market.

Content Strategy covers editorial planning, hub-and-spoke content architecture, pillar page development, content velocity frameworks, topical authority mapping, keyword clustering, content gap analysis, and publishing workflows designed for restoration and commercial services companies.

  • Internal Link Audit: What Your Client’s Site Is Missing

    Internal Link Audit: What Your Client’s Site Is Missing

    Tygart Media / Content Strategy
    The Practitioner JournalField Notes
    By Will Tygart
    · Practitioner-grade
    · From the workbench

    The Architecture No One Maintains

    Ask any freelance SEO consultant about internal linking and they’ll tell you it matters. Ask them how their clients’ internal link architecture actually looks — mapped, measured, audited — and most will admit it’s a blind spot. Not because they don’t know it’s important, but because mapping and maintaining internal links across a growing site is time-consuming work that always gets deprioritized behind content creation and keyword targeting.

    The cost of that neglect is real but invisible. Orphan pages that search engines can’t find. Authority concentrated on the homepage while deep pages starve. Topic clusters that exist in the editorial calendar but not in the link architecture. Related content that a visitor would find useful but that no link path connects.

    Search engines use internal links to discover pages, understand topic relationships, and distribute authority across a site. AI systems use them as signals of topical depth and content architecture. When the internal link map is neglected, both systems form an incomplete picture of what the site covers and which pages matter most.

    What a Proper Internal Link Audit Reveals

    When I audit a client’s internal link structure, the findings typically fall into four categories.

    First, orphan pages — published content with zero internal links pointing to it. These pages exist in WordPress but are effectively hidden from search engines that rely on link crawling to discover content. Every site I audit has orphan pages. Usually more than the consultant expects.

    Second, authority leaks — pages that receive internal links but don’t pass authority to the pages that need it. The homepage might have strong authority that could boost deep service pages, but there’s no link path connecting them. The authority sits at the top of the site and never flows down to the pages that convert visitors into clients.

    Third, broken cluster architecture — a blog with dozens of related posts that should be linked as a topic cluster but aren’t. Each post stands alone. Search engines see individual pages instead of a coherent body of expertise on a topic. The topical authority that a cluster would build is fragmented across disconnected posts.

    Fourth, missed contextual opportunities — places within existing content where a natural link to related content would serve both the reader and the search engine, but no link exists. These are often the easiest wins because the content is already there. It just needs to be connected.

    Why This Is Implementation Work, Not Strategy Work

    You probably already know internal linking matters. You might even recommend it in client audits. The bottleneck is implementation. Mapping every page on a client’s site, identifying link opportunities, determining anchor text, inserting links without disrupting content flow, and verifying the changes — that’s tedious, time-consuming work. For a freelance consultant with multiple clients, it rarely rises to the top of the priority list.

    That makes it a perfect candidate for the plugin model. I run the internal link analysis through the WordPress API, mapping every page, every existing link, and every missed opportunity. Then I implement the links — contextually, with appropriate anchor text, following a hub-and-spoke architecture where topic cluster pages route through a central hub page.

    The analysis and implementation run through the same proxy infrastructure as all other optimization work. No hosting access required. No manual editing in the WordPress admin. The links are injected at the content level through the API, and the results are documented for your review.

    The Hub-and-Spoke Model

    The strongest internal link architecture follows a hub-and-spoke pattern. For each major topic the client covers, there’s a hub page — the most comprehensive, authoritative piece of content on that topic. Supporting content (blog posts, FAQ pages, case studies) serves as spokes that link to the hub and receive links from the hub.

    This architecture does two things simultaneously. It tells search engines “this hub page is our most authoritative content on this topic” by concentrating internal link signals. And it creates a navigation structure that helps visitors move from any entry point to the most useful, comprehensive content on the topic they care about.

    For AI systems evaluating topical authority, the hub-and-spoke pattern is particularly powerful. AI models assess whether a site has genuine depth on a topic — not just one good article, but a network of content that covers the topic from multiple angles. A well-linked topic cluster demonstrates that depth structurally, not just editorially.

    Building this architecture retroactively on a site that’s been publishing content for years without linking strategy is exactly the kind of work that benefits from systematic analysis and API-level implementation. It’s not creative work — it’s structural engineering. And it’s the kind of structural engineering that the plugin model handles without consuming the consultant’s strategic bandwidth.

    The Measurable Impact

    Internal link improvements often produce visible ranking improvements surprisingly quickly. When a page that’s been orphaned suddenly receives contextual internal links from authoritative pages, search engines reassess its importance on the next crawl. When a topic cluster is properly linked for the first time, the entire cluster can benefit as authority flows through the new link paths.

    The impact is measurable in search console data — impressions and clicks for previously underperforming pages, improved crawl statistics, and in some cases direct ranking improvements for pages that were stuck on page two due to authority deficits that internal linking resolves.

    For your client reporting, internal link improvements are a concrete deliverable with visible outcomes. “We identified 12 orphan pages and connected them to the site’s link architecture. We built hub-and-spoke link clusters for your three primary service areas. Crawl coverage improved and three previously underperforming pages saw ranking improvements.” That’s a report that demonstrates value and justifies the engagement.

    Frequently Asked Questions

    How often should internal linking be audited and updated?

    A comprehensive audit quarterly, with incremental updates whenever new content is published. Every new blog post or page should be linked to and from relevant existing content at the time of publication. The quarterly audit catches drift, broken links, and newly identified opportunities.

    Can too many internal links hurt a page?

    In theory, excessive internal links can dilute the authority passed through each link. In practice, most sites have far too few internal links rather than too many. The risk of over-linking is minimal for sites that are linking contextually and relevantly. The real risk is under-linking — which is where the vast majority of sites sit.

    Do you use any specific tools for the internal link audit?

    The audit runs through the WordPress REST API, pulling every page and analyzing the link structure programmatically. This provides a complete, accurate map of the site’s internal links without depending on external crawlers that might miss pages behind authentication or noindex tags. The analysis is based on the actual content in WordPress, not a third-party interpretation of it.

    {
    “@context”: “https://schema.org”,
    “@type”: “Article”,
    “headline”: “The Internal Link Map Your Clients Site Is Missing — and What It Costs Them”,
    “description”: “Internal linking is the most overlooked structural element in SEO. It’s also the foundation for how search engines and AI systems understand what a site i”,
    “datePublished”: “2026-04-03”,
    “dateModified”: “2026-04-03”,
    “author”: {
    “@type”: “Person”,
    “name”: “Will Tygart”,
    “url”: “https://tygartmedia.com/about”
    },
    “publisher”: {
    “@type”: “Organization”,
    “name”: “Tygart Media”,
    “url”: “https://tygartmedia.com”,
    “logo”: {
    “@type”: “ImageObject”,
    “url”: “https://tygartmedia.com/wp-content/uploads/tygart-media-logo.png”
    }
    },
    “mainEntityOfPage”: {
    “@type”: “WebPage”,
    “@id”: “https://tygartmedia.com/the-internal-link-map-your-clients-site-is-missing-and-what-it-costs-them/”
    }
    }

  • Fractional AEO Operator: Process, Pricing & Expectations

    Fractional AEO Operator: Process, Pricing & Expectations

    The Machine Room · Under the Hood

    I’d Rather Lose the Deal Than Oversell It

    I’ve spent the last several articles explaining what the plugin model is, what it does, and why it might matter for freelance SEO consultants. This one is different. This is the honest logistics — what working together actually looks like, what it asks of you, what it doesn’t ask of you, and what I won’t promise.

    I’d rather you read this and decide it’s not for you than start a working relationship based on expectations I can’t meet. That’s not humility theater — it’s practical. Bad-fit partnerships waste everyone’s time and damage reputations. Good-fit partnerships build over years. I want the latter.

    What the First Conversation Covers

    The initial conversation is a discovery session — and it goes both directions. I need to understand your operation before I can tell you whether the plugin model adds value.

    I’ll ask about your client mix — how many sites, what industries, what CMS platforms (the optimization stack is WordPress-native, so non-WordPress clients need a case-by-case assessment). I’ll ask about your current service scope — are you doing content, just technical SEO, full-service, strategy-only? I’ll ask about your pain points — what questions are clients asking that you don’t have great answers for? Where do you feel stretched?

    You should ask me anything. What’s my background. How many engagements like this am I running. What happens when things go wrong. What my actual process looks like, not the marketing version. Whether I’ve worked in your clients’ industries. What I genuinely don’t know or can’t do.

    If the conversation reveals that the plugin model doesn’t fit your operation — wrong CMS, wrong service model, wrong timing — I’ll tell you. I’ve turned down conversations that weren’t a good fit. It’s better for both of us.

    What Onboarding Involves

    If we decide to move forward, onboarding is lightweight. For each client site you want to include:

    You create a WordPress application password with editor-level access. That takes about two minutes in the WordPress admin panel. You share the site URL and credentials through a secure channel. I add the site to the encrypted credential registry and verify the API connection through the proxy. I run an initial audit — content inventory, schema assessment, internal link map, AEO/GEO baseline — and share the findings with you.

    That initial audit is where the real value conversation starts. It shows you — with data, not promises — what optimization opportunities exist on that specific site. Featured snippet opportunities. Schema gaps. Entity signal deficiencies. Internal link blind spots. Content that’s ranking but not structured for answer engines or AI citation.

    You review the audit. We discuss priorities. You decide what work moves forward. Nothing happens without your approval.

    What Ongoing Work Looks Like

    The cadence depends on the client and the scope. For most engagements, the work runs in cycles — weekly, biweekly, or monthly optimization passes. Each pass can include any combination of the capability layers: AEO optimization, GEO optimization, schema injection, internal link implementation, content expansion, or new content through the adaptive pipeline.

    Every pass produces a documented record of what was changed. You always know what happened on your clients’ sites. If you want to review changes before they go live, we set up an approval gate. If you prefer to review after implementation, the documentation is there for your records and client reporting.

    Communication happens however works for you. Slack, email, a shared Notion workspace, a weekly call — whatever integrates with your existing workflow without adding another tool to manage.

    What It Costs

    I’m not going to publish a price sheet because the cost depends on scope — number of sites, depth of optimization, cadence of work. What I will tell you is the pricing philosophy: the plugin layer is designed to operate as a cost within your client margin, not as a cost that forces you to restructure your pricing.

    If you’re charging a client for SEO services and want to add AEO/GEO/schema capability, the plugin cost should fit inside your existing fee structure or support a modest scope expansion. I’m not interested in pricing that makes the math difficult for freelance consultants. The model only works if it works economically for both sides.

    Specifics come out of the discovery conversation, based on actual scope and volume. No hidden fees. No escalating tiers. No “gotcha” charges for things that should be included.

    What I Won’t Promise

    I won’t promise specific ranking improvements. Search is complex, competitive, and subject to algorithm changes that no one controls. What I can deliver is optimization work that follows tested methodology and expands your clients’ visibility across search surfaces they’re currently missing.

    I won’t promise AI citation results on a specific timeline. AI systems select sources based on criteria that are still evolving and that vary across platforms. The optimization work positions your clients’ content for citation — whether and when those citations appear depends on factors beyond any single optimization effort.

    I won’t promise that every client engagement will produce dramatic results. Some clients have strong foundations that the plugin layer builds on significantly. Others have structural issues that need to be resolved before the advanced layers can produce impact. The initial audit reveals which situation each client is in, and I’ll be straightforward about what’s realistic.

    I won’t promise to replace your judgment. You know your clients. You know their industries. You know their budgets and their patience levels. The plugin layer adds capability — it doesn’t override your strategic decision-making about what each client needs.

    What I Do Promise

    Every optimization follows documented methodology built from real experience across a portfolio of sites. The work is transparent — you always know what was done and why. Your client relationships stay yours. The model scales with your business, not against it. And if it stops working — if the fit isn’t right, if the results don’t justify the investment, if your business evolves in a different direction — there’s no lock-in, no penalty, and no hard feelings. The work already delivered stays with your clients. We shake hands and move on.

    The Next Step

    If anything in this series resonated — if you’ve been feeling the expanding surface area of search, wondering how to cover AI visibility without becoming a different kind of consultant, or looking for a way to deepen your service without the overhead of hiring — the next step is a conversation. Not a pitch. Not a demo. A conversation about your business, your clients, and whether this model adds value to what you’re building.

    I’m one person with a real infrastructure behind me. I built the systems, I run the programs, I connect the platforms, I analyze the data, and I produce the work. I’m the plugin. And if the fit is right, I might be the most useful addition to your operation that doesn’t require an office, a salary, or a job description.

    Frequently Asked Questions

    What’s the minimum commitment to get started?

    One client, one site, one optimization cycle. There’s no minimum contract length or minimum number of sites. Start small, see the results, and expand if the value is there. If it isn’t, you’ve invested minimal time and resources into finding that out.

    How quickly can we start after the discovery call?

    If the fit is clear and you have site access ready, the initial audit can start within days. First optimization work typically begins within the first week or two. The onboarding is genuinely lightweight — no multi-week setup process.

    Do you work with consultants who are also considering building these capabilities in-house?

    Yes — and I encourage it. The plugin model and internal capability building aren’t mutually exclusive. Some consultants use the plugin model while simultaneously learning the methodology. Over time, they internalize certain capabilities and adjust the engagement accordingly. The goal is your clients getting great results, whether that comes from the plugin layer, your own expanding skills, or a combination of both.

    {
    “@context”: “https://schema.org”,
    “@type”: “Article”,
    “headline”: “The Honest Pitch: What Working With Me Actually Looks Like, What It Costs You, and What It Doesnt”,
    “description”: “No hype, no manufactured urgency. Here’s what plugging in a fractional AEO/GEO operator actually involves — the process, the boundaries, and the real talk”,
    “datePublished”: “2026-04-03”,
    “dateModified”: “2026-04-03”,
    “author”: {
    “@type”: “Person”,
    “name”: “Will Tygart”,
    “url”: “https://tygartmedia.com/about”
    },
    “publisher”: {
    “@type”: “Organization”,
    “name”: “Tygart Media”,
    “url”: “https://tygartmedia.com”,
    “logo”: {
    “@type”: “ImageObject”,
    “url”: “https://tygartmedia.com/wp-content/uploads/tygart-media-logo.png”
    }
    },
    “mainEntityOfPage”: {
    “@type”: “WebPage”,
    “@id”: “https://tygartmedia.com/the-honest-pitch-what-working-with-me-actually-looks-like-what-it-costs-you-and-what-it-doesnt/”
    }
    }

  • From $0 to $31,000: The Upper Restoration SEO Story

    From $0 to $31,000: The Upper Restoration SEO Story

    Tygart Media / Content Strategy
    The Practitioner JournalField Notes
    By Will Tygart
    · Practitioner-grade
    · From the workbench

    The easiest way to explain what a content program actually does for a restoration company is to show one.

    Upper Restoration serves New York City and Long Island — Nassau and Suffolk counties. Competitive market, established players, the full range of water damage, fire, mold, and storm work. When we started working together, their SpyFu profile looked like most restoration contractors: effectively zero organic search presence, no meaningful keyword rankings, no measurable traffic from search.

    Today their monthly SEO value — the estimated cost to replicate their organic traffic through paid search — sits above $31,000 per month. That number is verified, tracked, and continues to move.

    This is what happened, in the order it happened, and why each step mattered.

    Step One: The Baseline Audit

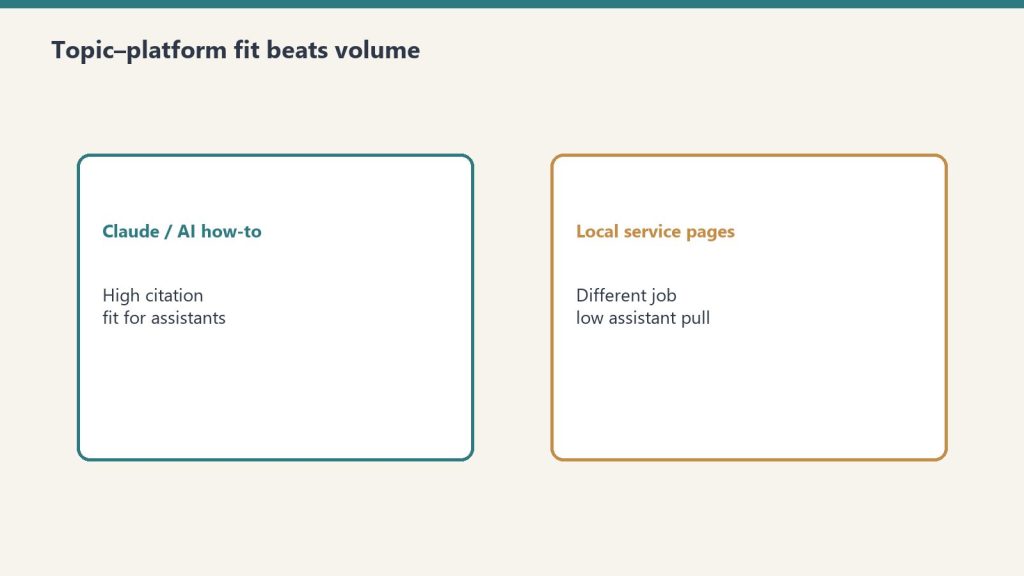
    Comparison of Claude how-to fit versus local service page fit for assistants
    Step one — the baseline audit.

    Before a single article was written, we ran a complete site audit. Not a surface-level crawl — a structured inventory of every post, every page, every category and tag, every piece of metadata. What existed, what was missing, what was broken, what was thin.

    The audit answers the foundational question: what does Google currently think this site is about? In Upper Restoration’s case, the answer was: not much. Thin content, minimal taxonomy, no internal link architecture, no schema markup. The domain existed but carried no topical authority signal in any specific category.

    This is the starting line for almost every restoration contractor we work with. The audit doesn’t reveal a problem — it reveals the opportunity. A site with no established authority can build it faster than a site with entrenched wrong signals, because there’s nothing to undo.

    Step Two: Architecture Before Content

    The temptation after an audit is to start publishing immediately. The right move is to design the architecture first.

    For Upper Restoration, that meant establishing the category structure: Water Damage, Fire Restoration, Mold Remediation, Storm Damage, Commercial Restoration, Insurance Claims. Every piece of content would live inside one of these buckets. The buckets would become the topical pillars Google associates with the domain.

    It meant identifying the hub pages — one pillar article per service category, written to be the most comprehensive resource on that topic in their market. Every supporting article would link back to the relevant hub. The hubs would link out to supporting articles. The internal link graph would make the site’s topical organization explicit and navigable.

    It meant mapping the service areas: every neighborhood in New York City, every town across Nassau and Suffolk with meaningful search volume for restoration services. Each would get its own page. The geographic coverage would signal to Google exactly where this company operates and for which locations it deserves to rank.

    This work takes time before it produces any visible results. It’s also what separates a content program that compounds over time from one that generates a temporary traffic bump and then plateaus.

    Step Three: The Content Sprint

    Desk with laptop, checklist notebook, and billing card ready before creating an Anthropic API key
    Step three — the content sprint.

    With the architecture established, the content sprint began. The goal: achieve topical authority in the core service categories as quickly as possible by covering every meaningful query a restoration customer in Upper Restoration’s market might search.

    Not generic coverage — hyper-local, hyper-specific coverage. Water damage restoration in Flushing. Mold remediation in Hempstead. Fire damage cleanup in Babylon. Each piece of content targeting the specific geographic and service intersection where a real customer with a real problem would be searching.

    The volume matters for a specific reason: Google’s topical authority model rewards comprehensive coverage. A site with one excellent article about water damage restoration ranks below a site with one hundred well-structured articles about water damage restoration in every neighborhood of its service area, because the latter site demonstrates deeper expertise. The sprint isn’t about quantity for its own sake — it’s about covering the topic space completely enough that Google has no reason to prefer a competitor with thinner coverage.

    Every article was optimized before publishing: title tag, meta description, slug, heading structure, schema markup, internal links to the relevant hub page. Not as an afterthought — as part of the production process.

    Step Four: Schema and Structured Data

    Schema markup is the metadata layer that tells Google what type each piece of content is and how to categorize it. Article schema for editorial content. LocalBusiness schema on the homepage and service pages. FAQ schema on content that answers specific questions. BreadcrumbList schema to signal the site’s navigational hierarchy.

    The impact of schema is less visible than rankings but measurable in search result appearance: FAQ dropdowns, star ratings, rich snippets, knowledge panel information. These take up more real estate in search results and convert at higher rates than standard blue links, because they answer the user’s question before the click.

    More importantly, schema accelerates Google’s ability to categorize the site correctly. Without it, Google infers content type from the raw text. With it, you’re providing structured data that removes ambiguity. For a restoration contractor trying to establish authority in multiple service categories simultaneously, removing ambiguity is significant.

    Step Five: The Measurement Layer

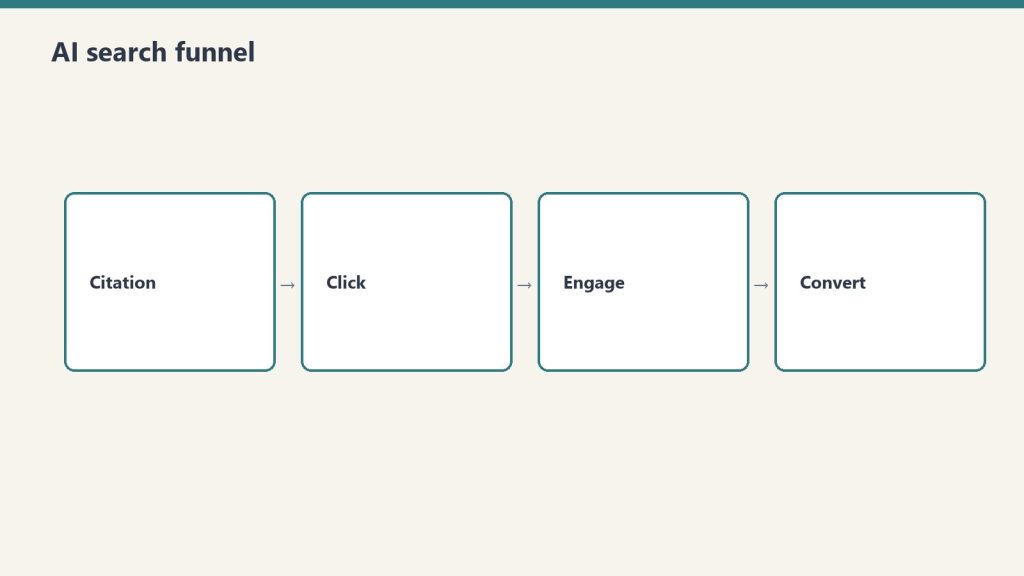
    Four-stage funnel: citation, click, engage, convert
    Step five — the measurement layer.

    SEO without measurement is guesswork. The measurement layer for Upper Restoration runs through SpyFu for organic value tracking and DataForSEO for keyword-level ranking data across the specific locations and queries that matter.

    SpyFu’s monthly SEO value metric is the headline number — it’s what shows the overall trajectory and what makes the clearest case to a client that the program is working. But the keyword-level data underneath it tells the more granular story: which service categories are ranking, which locations are performing, which queries have moved to page one, which still have room to climb.

    The measurement layer also drives the ongoing program. When keyword data shows a cluster gaining traction, you add more content in that cluster. When a hub page is ranking but not converting, you look at the content structure and the call to action. When a service area is generating impressions but not clicks, you look at the title tag and meta description. The program is a feedback loop, not a one-time campaign.

    What $31,000 in SEO Value Actually Means

    The SpyFu number is an estimate of traffic value, not revenue. A site with $31,000 in monthly SEO value is generating organic traffic that would cost $31,000 per month to replicate through Google Ads. The actual revenue generated depends on conversion rates, average job values, close rates — variables that differ for every company.

    What the number does tell you, clearly and verifiably, is that the content program has built genuine search presence. Keywords are ranking. Pages are generating clicks. The site exists, from Google’s perspective, in a way it didn’t before.

    For Upper Restoration, that presence is geographically concentrated in exactly the markets where they operate, for exactly the services they provide, targeting exactly the search queries that produce calls. The traffic is not vanity traffic — it’s potential customers with active problems looking for someone to call.

    The program that produced this result started from $0. It required an audit, an architecture phase, a content sprint, schema implementation, and an ongoing measurement and iteration cycle. It did not require a large agency, a significant paid media budget, or anything other than a structured approach to building topical authority in a specific market.

    That’s the story. The starting line for any restoration contractor who wants to tell a similar one is a baseline audit — understanding exactly where $0 is before building toward something different.


    Tygart Media builds content programs for restoration contractors. Every engagement starts with a SpyFu and DataForSEO baseline audit of your market — so the starting line is documented and the trajectory is measurable from day one.

    {
    “@context”: “https://schema.org”,
    “@type”: “Article”,
    “headline”: “From $0 to $31,000: The Upper Restoration SEO Story”,
    “description”: “Upper Restoration went from zero search presence to $31,000 in monthly SEO value. Here is exactly what happened, in what order, and why each step mattered.”,
    “datePublished”: “2026-04-02”,
    “dateModified”: “2026-04-03”,
    “author”: {
    “@type”: “Person”,
    “name”: “Will Tygart”,
    “url”: “https://tygartmedia.com/about”
    },
    “publisher”: {
    “@type”: “Organization”,
    “name”: “Tygart Media”,
    “url”: “https://tygartmedia.com”,
    “logo”: {
    “@type”: “ImageObject”,
    “url”: “https://tygartmedia.com/wp-content/uploads/tygart-media-logo.png”
    }
    },
    “mainEntityOfPage”: {
    “@type”: “WebPage”,
    “@id”: “https://tygartmedia.com/upper-restoration-seo-case-study/”
    }
    }

  • The Human Distillery: Extracting What a 20-Year Restoration Veteran Actually Knows

    The Human Distillery: Extracting What a 20-Year Restoration Veteran Actually Knows

    The Machine Room · Under the Hood

    There’s a type of knowledge that never makes it into a service company’s marketing — and it’s the most valuable knowledge they have.

    It’s not in their website copy. It’s not in their training materials. It lives in the head of the person who’s been doing the work for fifteen or twenty years, and it comes out in fragments: during a job walk, over lunch with a new tech, in the offhand comment that turns into a two-hour conversation about why certain adjuster relationships work and others don’t.

    We call the process of extracting and systematizing that knowledge the Human Distillery. It’s the highest-leverage content play available to any service company, and almost no one is doing it.

    The Tacit Knowledge Problem

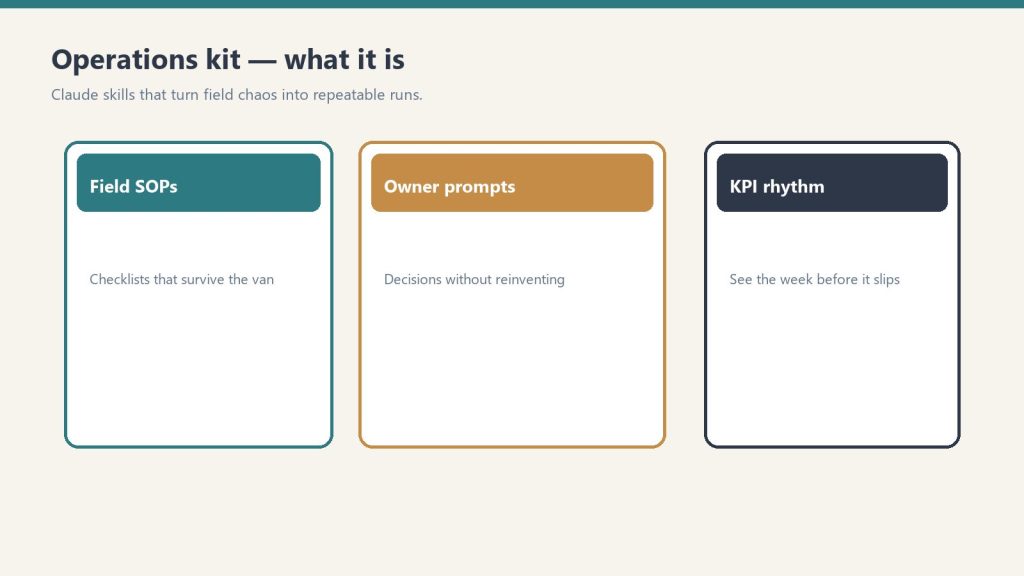
    Three cards for field SOPs, owner prompts, and KPI rhythm in an operations kit
    The tacit knowledge problem.

    Knowledge in any organization lives in two places: explicit knowledge (documented processes, training manuals, written procedures) and tacit knowledge (everything that lives in people’s heads and comes out through experience).

    Most companies have invested heavily in explicit knowledge. SOPs for mitigation setup. Checklists for job completion. Xactimate templates for common loss types. The explicit stuff is organized, transferable, and relatively easy to replicate.

    Tacit knowledge is different. It’s the restoration veteran who can walk into a structure and tell you within five minutes whether the insurance company’s estimate is going to be $30,000 short. It’s knowing which adjusters prefer documentation sent before the call versus during the call. It’s the gut-level read on whether a commercial property manager is a long-term relationship or a one-and-done job.

    That knowledge took twenty years to accumulate. It cannot be written down in an afternoon. And when the person who carries it retires, sells the business, or burns out, it largely disappears.

    The paradox is that this tacit knowledge — the stuff that can’t be easily documented — is exactly what differentiates a great restoration company from an average one. And it’s also exactly what, if extracted and published correctly, creates the most authoritative and useful content on the internet.

    What Extraction Actually Looks Like

    Gloved hands using a pin-type moisture meter on wet drywall during inspection
    What extraction actually looks like.

    The Human Distillery is not an interview. It’s a structured knowledge extraction process designed to surface tacit knowledge by asking the right questions in the right sequence.

    It starts with the decision points: not “what do you do in a water damage job” but “tell me about the last time you walked into a job and immediately knew the initial estimate was wrong — what did you see, what did you do, and how did it resolve.” Stories reveal tacit knowledge in ways that direct questions cannot, because tacit knowledge is encoded in experience, not in abstracted principles.

    From stories, you extract patterns. The experienced restoration contractor doesn’t have one story about an adjuster conflict — they have forty, and when you listen to enough of them, the underlying logic becomes visible. Adjuster relationships work a certain way. Documentation sequencing matters in specific situations. Certain loss types have hidden scope that novices miss every time.

    Those patterns become frameworks. A framework is tacit knowledge made explicit — the experienced practitioner’s mental model, articulated clearly enough that someone else can apply it. And frameworks are extraordinarily powerful content.

    Why This Is the Highest-Leverage Content Play

    Generic content is everywhere. “What to do after a house fire.” “Signs of hidden water damage.” “How long does mold remediation take.” Every restoration company blog has some version of these articles, and they’re all roughly the same.

    Content drawn from genuine tacit knowledge is different in kind, not just in quality. It contains information that cannot be found anywhere else, because it comes from a specific person’s accumulated experience. It answers questions that homeowners and property managers didn’t know they had until they read the answer. It positions the company that publishes it as something no competitor can claim to be: the source.

    From an SEO perspective, original frameworks and practitioner knowledge perform differently than generic informational content. They earn links because other people reference them. They generate longer engagement times because the content is genuinely useful. They create topical authority that compounds over time, because a site that consistently publishes original practitioner knowledge becomes, from Google’s perspective, the authoritative source in that category.

    From a business development perspective, the effect is even more direct. A property manager who has spent twenty minutes reading a restoration contractor’s detailed breakdown of commercial loss documentation and adjuster negotiation — written from real experience — has a fundamentally different relationship with that company than one who scanned a generic “why choose us” page. They understand what the company knows. They trust the expertise before the first call.

    Dave and the 247RS Pilot

    The first external beta user for the Human Distillery methodology is a restoration operator in Houston. Twenty-plus years in the industry. Deep relationships across the insurance ecosystem. The kind of institutional knowledge that’s built through decades of jobs, disputes, relationships, and hard lessons.

    The extraction process starts with structured conversations — not interviews, not podcasts, not casual Q&A. Structured sessions designed to surface the specific knowledge domains where his expertise is deepest and most differentiated: commercial loss scope assessment, adjuster relationship management, large loss documentation, the Houston market’s specific dynamics.

    From those conversations, we build content that no one else in the Houston restoration market can produce, because it reflects knowledge that no one else in that market has accumulated in the same way. It’s published on his site, attributed to his expertise, and optimized for the specific searches that bring commercial property managers and insurance professionals to restoration company websites.

    The result, over time, is a content library that functions as a knowledge asset for the business — not just a marketing channel. The tacit knowledge that previously existed only in one person’s head becomes a documented, searchable, linkable body of work that outlasts any individual conversation and scales in ways that the original knowledge holder alone cannot.

    The Business Case for Getting This Right

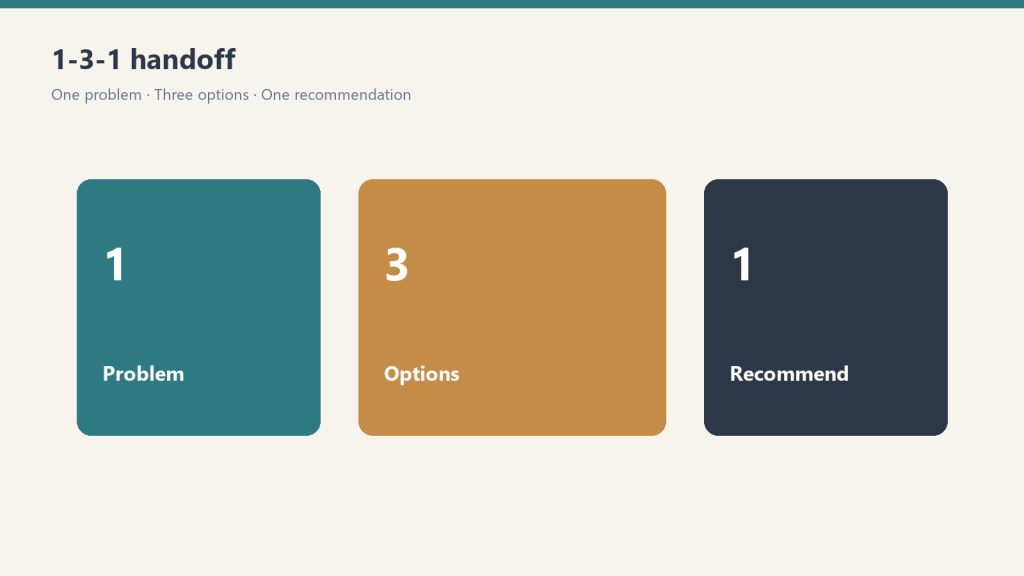
    Three panels showing one problem, three options, one recommendation
    The business case for getting this right.

    Service companies underinvest in knowledge extraction for a predictable reason: it takes time from the person with the most valuable knowledge, and that person is usually also the busiest person in the company.

    The ROI calculation, though, is straightforward once you see it clearly. The tacit knowledge already exists. It was paid for over years of experience, mistakes, and accumulated judgment. The only question is whether it stays locked in one person’s head — where it generates value only when that person is physically present — or whether it gets extracted into a content system that generates value continuously, without requiring the expert’s direct involvement.

    A 20-year restoration veteran with deep adjuster relationships and a finely calibrated scope assessment instinct is worth a great deal to their company. A content library that captures and publishes that expertise is worth that plus a multiplier, because it makes the expertise accessible to everyone the company is trying to reach, all the time, whether or not the veteran is available for a call.

    That’s the Human Distillery. Extract what the expert knows. Make it findable. Let it work while they’re on the job.


    Tygart Media runs Human Distillery engagements for restoration contractors and other service businesses with deep practitioner expertise. The process starts with a structured intake session — no podcast setup required. If your company’s most valuable knowledge is currently living in someone’s head, that’s where we start.

    {
    “@context”: “https://schema.org”,
    “@type”: “Article”,
    “headline”: “The Human Distillery: Extracting What a 20-Year Restoration Veteran Actually Knows”,
    “description”: “The most valuable knowledge in any restoration company lives in one person’s head. Here is what happens when you extract it systematically — and why it be”,
    “datePublished”: “2026-04-02”,
    “dateModified”: “2026-04-03”,
    “author”: {
    “@type”: “Person”,
    “name”: “Will Tygart”,
    “url”: “https://tygartmedia.com/about”
    },
    “publisher”: {
    “@type”: “Organization”,
    “name”: “Tygart Media”,
    “url”: “https://tygartmedia.com”,
    “logo”: {
    “@type”: “ImageObject”,
    “url”: “https://tygartmedia.com/wp-content/uploads/tygart-media-logo.png”
    }
    },
    “mainEntityOfPage”: {
    “@type”: “WebPage”,
    “@id”: “https://tygartmedia.com/human-distillery-restoration-tacit-knowledge/”
    }
    }

  • SEO Website Architecture: Why Your Site is a Database

    SEO Website Architecture: Why Your Site is a Database

    The Machine Room · Under the Hood

    Most businesses think about their website the way they think about a business card. You design it once, print it, hand it out. It says who you are and how to reach you. Every few years, maybe you update it.

    This mental model is why most websites don’t work.

    A website is not a brochure. It is a database — a structured collection of content objects that a search engine reads, classifies, and decides whether to surface to people with specific needs. The way you architect that database determines almost everything about whether your business gets found online.

    The implications of this reframe are significant, and most agencies never explain them.

    What Search Engines Actually Do With Your Site

    When Google crawls your website, it’s not admiring the design. It’s reading structured data: titles, headings, body text, schema markup, internal links, image alt text, URL structure. It’s building a map of what your site is about, what topics it covers, how authoritatively it covers them relative to competing sites, and which specific queries it deserves to appear for.

    A brochure website gives Google almost nothing to work with. One services page that lists everything you do. An about page. A contact form. Maybe a blog with eight posts from 2021.

    Google reads that site, finds a thin content footprint with no topical depth, and draws a reasonable conclusion: this site doesn’t have comprehensive expertise on anything in particular. It will not rank for competitive terms.

    A database website is architected differently. Every service gets its own page with its own keyword target. Every service area gets its own page. Every question a customer might have gets an answer. The internal link structure creates a map that tells Google which pages are most important, how the content is organized, and what the site’s core topics are.

    This is not a design question. It’s an architecture question.

    The JSON-First Content Model

    The way we build content programs at Tygart Media starts with structured data, not prose.

    Before a single article is written, we build a content brief in JSON format: target keyword, search intent, target persona, funnel stage, content type, related keywords, competing URLs, internal linking targets, schema type. Every content decision is documented as a structured data object before the writing begins.

    This matters for a few reasons.

    First, it forces clarity. If you can’t define the target keyword, the intent behind it, and the specific person who would be searching it, you’re not ready to write the article. Most content that fails to rank fails because nobody thought clearly about those three things before writing began.

    Second, it makes the content pipeline scalable. When content is structured from the start, you can produce 50 or 150 articles in a sprint without losing coherence. Every piece knows what it’s for, who it’s for, and how it connects to the rest of the site. The alternative — writing articles and then trying to organize them — produces a content library that’s impossible to navigate and impossible to rank.

    Third, it enables automation without sacrificing quality. The brief is the seed. Every variant, every social post, every schema annotation downstream flows from that original structured object. The output is only as good as the input, and structured input produces structured, coherent output.

    Taxonomy Is Architecture

    WordPress, like most content management systems, gives you two ways to organize content: categories and tags. Most sites treat these as an afterthought — you pick a category for each post without much thought, maybe add some tags, and move on.

    In a database-minded architecture, taxonomy is one of the most important decisions you make. Categories define the topical pillars of your site. Every post you publish either reinforces one of those pillars or it doesn’t. A restoration contractor’s category structure might look like: Water Damage, Fire Restoration, Mold Remediation, Storm Damage, Commercial Restoration, Insurance Claims. Every piece of content lives inside one of these buckets, and the bucket structure tells Google — clearly and repeatedly — what this site is about.

    Tags create the cross-cutting relationships. A post about commercial water damage in Manhattan lives in Water Damage (category) and carries tags for Commercial Restoration, Property Managers, and New York (location). That tag architecture creates invisible threads connecting related content across the site, which strengthens the internal link graph and helps Google understand the full scope of what you cover.

    Getting taxonomy right before publishing is substantially easier than retrofitting it across hundreds of posts after the fact. We’ve done both. The retrofit takes three times as long and produces half the results.

    Internal Links Are the Database’s Index

    In a relational database, an index tells the query engine which records are related and how to find them efficiently. Internal links serve the same function in a content database.

    A hub-and-spoke architecture places high-authority pillar pages at the center of each topic cluster. Every supporting article on that topic links back to the pillar. The pillar links out to the supporting articles. Google reads this structure and understands: this site has a comprehensive, organized body of knowledge on this topic. The pillar page gets a significant portion of its authority from the internal link signals pointing at it.

    Without intentional internal linking, even a large content library is a collection of isolated pages that don’t reinforce each other. Each page competes as an island. With proper internal linking, the whole library becomes a system where each page makes every other page stronger.

    This is why the order of operations matters. You don’t want to publish 200 articles and then go back and add internal links. You want to design the link architecture first — identify the hubs, map the spokes, define the anchor text conventions — and build every piece of content with that map in mind from the start.

    Schema Markup: Telling the Database What Type Each Record Is

    Every record in a database has a type. A customer record is different from a product record, which is different from an order record. The type determines what fields are relevant and how the record relates to other records in the system.

    Schema markup does this for web content. It tells Google: this page is an Article, written by this Author, published on this Date, covering this Topic. Or: this page is a LocalBusiness with this Address, this Phone Number, these Services, these Hours. Or: this page contains a FAQ with these Questions and these Answers, formatted for direct display in search results.

    Without schema, Google has to infer all of this from the raw text. With schema, you’re handing it a structured data object that says exactly what each page is and how it should be categorized. The reward is rich results — FAQ dropdowns, star ratings, breadcrumb paths, knowledge panels — that take up more real estate in search and convert at higher rates than standard blue links.

    Schema is the metadata layer of the content database. Most sites don’t have it. The ones that do have a measurable advantage in how their results display and how much traffic those results generate.

    The Practical Difference

    Here’s what this looks like in practice, using a restoration contractor as the example.

    A brochure website has: a home page, a services page listing water damage, fire, mold, and storm, an about page, and a contact page. Maybe 5 pages total. Google has almost nothing to index.

    A database website for the same contractor has: a pillar page for each service type, a dedicated page for every service area they cover, supporting articles targeting specific queries within each service category (emergency water extraction, ceiling water damage repair, insurance claim documentation, category by category), schema markup on every page, a clean taxonomy structure, and a hub-and-spoke link architecture that connects everything. Potentially 200 to 400 pages, each doing a specific job.

    The brochure site is invisible. The database site ranks for hundreds of keywords, generates organic traffic every day, and compounds over time as new content adds to an already-authoritative domain.

    The content is not the hard part. The architecture is. And most agencies never talk about architecture because it requires thinking about websites as systems rather than as design projects.

    That’s the reframe. Your website is a database. Build it like one.


    Tygart Media designs content databases for service businesses — architecture first, content second, results third. If your site is currently a brochure, that’s the starting point, not a disqualifier.

    {
    “@context”: “https://schema.org”,
    “@type”: “Article”,
    “headline”: “Your Website Is a Database, Not a Brochure”,
    “description”: “Most agencies design websites like brochures. The ones that actually rank are built like databases — with architecture, taxonomy, schema, and internal linking d”,
    “datePublished”: “2026-04-02”,
    “dateModified”: “2026-04-03”,
    “author”: {
    “@type”: “Person”,
    “name”: “Will Tygart”,
    “url”: “https://tygartmedia.com/about”
    },
    “publisher”: {
    “@type”: “Organization”,
    “name”: “Tygart Media”,
    “url”: “https://tygartmedia.com”,
    “logo”: {
    “@type”: “ImageObject”,
    “url”: “https://tygartmedia.com/wp-content/uploads/tygart-media-logo.png”
    }
    },
    “mainEntityOfPage”: {
    “@type”: “WebPage”,
    “@id”: “https://tygartmedia.com/website-is-a-database-not-a-brochure/”
    }
    }

  • Zero-Click Search Strategy: Building Interactive Tools

    Zero-Click Search Strategy: Building Interactive Tools

    The Lab · Tygart Media
    Experiment Nº 650 · Methodology Notes
    METHODS · OBSERVATIONS · RESULTS

    We just deployed 16 interactive tools and 3 bottom-of-funnel articles across 7 websites in a single session. Here’s why, and how you can do the same thing.

    The Problem: 4,000 Impressions, Zero Clicks

    We pulled the Google Search Console data for theuniversalcommerceprotocol.com — a site covering agentic commerce and AI-powered checkout infrastructure. The numbers told a brutal story: over 200 unique queries generating 4,000+ monthly impressions with an effective CTR of 0%. Not low. Zero.

    The highest-impression queries were all definitional: “what is agentic commerce” (409 impressions, 0 clicks), “agentic commerce definition” (178 impressions, 0 clicks), “ai commerce compliance mastercard” (61 impressions at position 1.25, 0 clicks). Google was serving our content directly in AI Overviews and featured snippets. Users got what they needed without ever visiting the site.

    This isn’t unique to UCP. It’s the new reality. 58.5% of US Google searches now end without a click. For AI Mode searches, it’s 93%. If your content strategy is built on informational queries, you’re building on a foundation that’s actively collapsing.

    The conventional wisdom is to “optimize for AI Overviews” and “win the featured snippet.” But that’s backwards. If you win the featured snippet for “what is agentic commerce,” Google serves your content without anyone visiting your site. You’ve won the battle and lost the war.

    The Insight: Two-Layer Content Architecture

    The solution isn’t to fight zero-click search. It’s to use it. We call it two-layer content architecture, and it changes how you think about content strategy entirely.

    Layer 1: SERP Bait. This is your definitional, informational content — “what is X,” “X vs Y,” “how does X work.” This content is designed to be consumed on the SERP without a click. Its job isn’t traffic. Its job is brand impressions at massive scale. Every time Google cites you in an AI Overview, thousands of people see your brand positioned as the authority. That’s not a failure. That’s a free brand campaign.

    Layer 2: Click Magnets. This is content Google literally cannot summarize in a snippet — interactive tools, calculators, assessments, scorecards, decision frameworks. The SERP can tease them (“Calculate your agentic commerce ROI…”) but the user HAS to click through to get the value. The tool requires input. The output is personalized. There’s nothing for Google to extract.

    The connection between the layers is where the magic happens. The person who sees your brand cited in an AI Overview for “what is agentic commerce” now recognizes you. When they later search “agentic commerce ROI” or “how to implement agentic commerce” — and your calculator or playbook appears — they click because they already trust you from Layer 1. Research backs this up: brands cited in AI Overviews see 35% higher CTR on their other organic listings.

    You’re not fighting the zero-click reality. You’re using it as a free awareness channel that feeds the bottom of your funnel.

    What We Built: 16 Tools Across 7 Sites

    We didn’t just theorize about this. We built and deployed the entire system in a single session across 7 domains.

    UCP (theuniversalcommerceprotocol.com) — 6 pieces

    Three interactive tools targeting the exact queries generating zero-click impressions: an Agentic Commerce Readiness Assessment (32-question diagnostic across 8 dimensions), an ROI Calculator (projects revenue impact using Morgan Stanley, Gartner, and McKinsey 2026 data), and a Visa vs Mastercard Agentic Commerce Scorecard (interactive comparison across 7 compliance dimensions — this one directly targets the “ai commerce compliance mastercard/visa” queries that were getting 90 impressions at position 1 with zero clicks).

    Plus three bottom-of-funnel articles that can’t be answered in a snippet: a 90-Day Implementation Playbook (week-by-week), a narrative piece about what breaks when an AI agent hits an unprepared store, and a Build/Buy/Wait decision framework with cost analysis.

    Tygart Media (tygartmedia.com) — 5 tools

    Five tools that package our existing expertise into interactive formats: an AEO Citation Likelihood Analyzer (scores content across 8 dimensions AI systems evaluate), an Information Density Analyzer (paste your text, get real-time density metrics and a paragraph-by-paragraph heatmap), a Restoration SEO Competitive Tower (benchmark against competitors across 8 SEO dimensions), an AI Infrastructure ROI Simulator (Build vs Buy vs API with 3-year TCO), and a Schema Markup Adequacy Scorer (is your structured data AI-ready?).

    Knowledge Cluster (5 sites) — 5 industry-specific tools

    One high-priority tool per site, each targeting the most-searched zero-click queries in their industry: a Water Damage Cost Estimator for restorationintel.com (calculates by IICRC class, water category, materials, and region), a Property Risk Assessment Engine for riskcoveragehub.com (scores across 5 risk dimensions with coverage recommendations), a Business Impact Analysis Generator for continuityhub.org (ISO 22301-aligned BIA with exportable summary), a Healthcare Compliance Audit Tool for healthcarefacilityhub.org (18-question audit mapped to CMS CoP and TJC standards), and a Carbon Footprint Calculator for bcesg.org (Scope 1/2/3 with EPA emission factors and reduction scenarios).

    Why Interactive Tools Beat Articles in Zero-Click

    There are five technical reasons interactive tools are the correct response to zero-click search, and they compound.

    They’re non-serializable. A calculator’s output depends on user input. Google can’t pre-compute every possible result for a water damage cost estimator across every combination of square footage, damage class, water category, materials, and region. The AI Overview can say “use this calculator” but it can’t BE the calculator. The citation becomes a call to action.

    They generate engagement signals at scale. Interactive tools produce time-on-page, scroll depth, and interaction events that traditional articles can’t match. A user spending 4 minutes inputting data and exploring results sends stronger quality signals than a user who reads a paragraph and bounces.

    They’re bookmarkable. A restoration company owner who uses the cost estimator once will bookmark it and return. Insurance adjusters will save the risk assessment tool. This creates direct traffic over time — the kind Google can’t intercept with zero-click.

    They’re natural link magnets. Industry publications, Reddit threads, and professional communities link to useful tools far more readily than articles. A “Healthcare Compliance Audit Tool” gets shared in facility manager Slack channels. A “What Is Healthcare Compliance” article doesn’t.

    They’re AI Overview proof. Even when Google cites the page in an AI Overview, users still need to visit to use the tool. The AI Overview effectively becomes free advertising: “Use this calculator at [your site] to estimate your costs.” Every zero-click impression becomes a branded CTA.

    The Methodology: Replicable for Any Site

    You can run this exact playbook on any site in about 4 hours. Here’s the step-by-step:

    Step 1: Pull your GSC data. Export the Queries and Pages reports. Sort by impressions descending. Identify every query with significant impressions and near-zero CTR. These are your zero-click queries — the ones Google is answering without sending you traffic.

    Step 2: Categorize the queries. Split them into two buckets. Definitional queries (“what is X,” “X definition,” “X vs Y”) are Layer 1 — leave them alone, they’re generating brand impressions. Action-intent queries (“X cost estimate,” “X compliance checklist,” “how to implement X”) are Layer 2 opportunities.

    Step 3: For each Layer 2 opportunity, ask one question. “What would someone who already knows the answer still need to click for?” The answer is usually a tool, calculator, assessment, or framework that requires their specific input to produce useful output.

    Step 4: Build the tool. Single-file HTML with inline CSS/JS. No external dependencies. Dark theme, mobile responsive, professional design. The tool should take 2-5 minutes to complete and produce a result worth sharing or saving. Include a “copy results” or “download report” function.

    Step 5: Embed in WordPress. Write a 2-3 paragraph intro explaining why the tool matters (this is what Google will see and potentially cite). Then embed the full HTML. The intro becomes your Layer 1 snippet bait, and the tool becomes your Layer 2 click magnet — on the same page.

    Step 6: Cross-link. Add CTAs from your existing Layer 1 content to the new tools. If you have an article ranking for “what is agentic commerce” that’s getting zero clicks, add a CTA in that article: “Take the Readiness Assessment to see if your business is prepared.” You’re converting brand impressions into tool engagement.

    Step 7: Monitor. Track CTR changes over 30/60/90 days. Track direct traffic increases (brand searches driven by AI Overview citations). Track tool engagement: completion rates, time on page. Track backlink acquisition from industry sites linking to your tools.

    What We’re Measuring

    This isn’t a “publish and pray” strategy. We’re tracking specific metrics across all 7 sites to validate or invalidate the approach within 90 days.

    First, CTR change on previously zero-click queries. If the Visa vs Mastercard Scorecard starts pulling even 2-3% CTR on queries that were at 0%, that’s a meaningful signal. Second, direct traffic increases — are more people searching for our brand names directly after seeing us cited in AI Overviews? Third, tool engagement metrics: how many people complete the assessments, what’s the average time on page, how many copy their results? Fourth, organic backlinks — do industry sites start linking to our tools? Fifth, whether the tools themselves rank for their own queries, creating an entirely new traffic channel.

    The Bigger Picture

    The era of “write an article, rank, get traffic” is over for informational queries. Google’s AI Overviews and featured snippets have made it so that the better your content is at answering a question, the less likely anyone is to visit your site. That’s a structural inversion of the old SEO model, and no amount of keyword optimization will fix it.

    But the era of “build something useful, earn trust, capture intent” is just beginning. Tools, calculators, assessments, and interactive experiences represent a category of content that AI cannot fully consume on behalf of the user. They require participation. They produce personalized output. They create the kind of engagement that turns a search impression into a relationship.

    We deployed 16 of these tools across 7 sites today. In 90 days, we’ll know exactly how much zero-click traffic they converted. But based on the early research — 35% higher CTR for AI-cited brands, 42.9% CTR for featured snippet content that teases without fully answering — the bet is that unsnippetable content is the highest-leverage move in SEO right now.

    The tools are already live. The impressions are already flowing. Now we find out if the clicks follow.

    {
    “@context”: “https://schema.org”,
    “@type”: “Article”,
    “headline”: “The Unsnippetable Strategy: How We Beat Zero-Click Search by Building Things Google Cant Summarize”,
    “description”: “We deployed 16 interactive tools across 7 websites to convert zero-click search impressions into actual traffic. Here’s the two-layer content architecture”,
    “datePublished”: “2026-04-01”,
    “dateModified”: “2026-04-03”,
    “author”: {
    “@type”: “Person”,
    “name”: “Will Tygart”,
    “url”: “https://tygartmedia.com/about”
    },
    “publisher”: {
    “@type”: “Organization”,
    “name”: “Tygart Media”,
    “url”: “https://tygartmedia.com”,
    “logo”: {
    “@type”: “ImageObject”,
    “url”: “https://tygartmedia.com/wp-content/uploads/tygart-media-logo.png”
    }
    },
    “mainEntityOfPage”: {
    “@type”: “WebPage”,
    “@id”: “https://tygartmedia.com/unsnippetable-strategy-beat-zero-click-search/”
    }
    }

  • Information Density Analyzer: Is Your Content AI-Ready?

    Information Density Analyzer: Is Your Content AI-Ready?

    Tygart Media / The Signal
    Broadcast Live
    Filed by Will Tygart
    • Tacoma, WA
    • Industry Bulletin

    AI systems select sources based on information density — the ratio of unique, verifiable claims to filler text. Most content fails this test. We found that 16 AI models unanimously agree on what makes content worth citing, and it comes down to density.

    This tool analyzes your text in real-time and produces 8 metrics including unique concepts per 100 words, claim density, filler ratio, and actionable insight score. It also generates a paragraph-by-paragraph heatmap showing exactly where your content is dense and where it’s fluff.

    Paste your article text below and see how your content measures up against AI-citable benchmarks.

    Information Density Analyzer: Is Your Content Dense Enough for AI?

    * {
    margin: 0;
    padding: 0;
    box-sizing: border-box;
    }

    body {
    font-family: -apple-system, BlinkMacSystemFont, ‘Segoe UI’, Roboto, ‘Helvetica Neue’, Arial, sans-serif;
    background: linear-gradient(135deg, #0f172a 0%, #1a2551 100%);
    color: #e5e7eb;
    min-height: 100vh;
    padding: 20px;
    }

    .container {
    max-width: 1200px;
    margin: 0 auto;
    }

    header {
    text-align: center;
    margin-bottom: 40px;
    animation: slideDown 0.6s ease-out;
    }

    h1 {
    font-size: 2.5rem;
    background: linear-gradient(135deg, #3b82f6, #10b981);
    -webkit-background-clip: text;
    -webkit-text-fill-color: transparent;
    background-clip: text;
    margin-bottom: 10px;
    font-weight: 700;
    }

    .subtitle {
    font-size: 1.1rem;
    color: #9ca3af;
    }

    .input-section {
    background: rgba(15, 23, 42, 0.8);
    border: 1px solid rgba(59, 130, 246, 0.2);
    border-radius: 12px;
    padding: 40px;
    margin-bottom: 30px;
    backdrop-filter: blur(10px);
    animation: fadeIn 0.8s ease-out;
    }

    .textarea-group {
    margin-bottom: 20px;
    }

    .textarea-label {
    display: block;
    margin-bottom: 12px;
    font-weight: 600;
    font-size: 1.05rem;
    color: #e5e7eb;
    }

    textarea {
    width: 100%;
    min-height: 250px;
    padding: 15px;
    background: rgba(255, 255, 255, 0.03);
    border: 1px solid rgba(59, 130, 246, 0.2);
    border-radius: 8px;
    color: #e5e7eb;
    font-family: inherit;
    font-size: 0.95rem;
    resize: vertical;
    transition: all 0.3s ease;
    }

    textarea:focus {
    outline: none;
    border-color: rgba(59, 130, 246, 0.5);
    background: rgba(59, 130, 246, 0.05);
    }

    .button-group {
    display: flex;
    gap: 15px;
    margin-top: 20px;
    flex-wrap: wrap;
    }

    button {
    padding: 12px 30px;
    border: none;
    border-radius: 8px;
    font-weight: 600;
    cursor: pointer;
    transition: all 0.3s ease;
    font-size: 1rem;
    }

    .btn-primary {
    background: linear-gradient(135deg, #3b82f6, #2563eb);
    color: white;
    flex: 1;
    min-width: 200px;
    }

    .btn-primary:hover {
    transform: translateY(-2px);
    box-shadow: 0 10px 20px rgba(59, 130, 246, 0.3);
    }

    .btn-secondary {
    background: rgba(59, 130, 246, 0.1);
    color: #3b82f6;
    border: 1px solid rgba(59, 130, 246, 0.3);
    }

    .btn-secondary:hover {
    background: rgba(59, 130, 246, 0.2);
    transform: translateY(-2px);
    }

    .results-section {
    display: none;
    animation: fadeIn 0.8s ease-out;
    }

    .results-section.visible {
    display: block;
    }

    .content-section {
    background: rgba(15, 23, 42, 0.8);
    border: 1px solid rgba(59, 130, 246, 0.2);
    border-radius: 12px;
    padding: 40px;
    margin-bottom: 30px;
    backdrop-filter: blur(10px);
    }

    .density-score {
    text-align: center;
    margin-bottom: 40px;
    padding: 40px;
    background: linear-gradient(135deg, rgba(59, 130, 246, 0.1), rgba(16, 185, 129, 0.1));
    border-radius: 12px;
    }

    .score-number {
    font-size: 4rem;
    font-weight: 700;
    background: linear-gradient(135deg, #3b82f6, #10b981);
    -webkit-background-clip: text;
    -webkit-text-fill-color: transparent;
    background-clip: text;
    }

    .score-label {
    font-size: 1rem;
    color: #9ca3af;
    margin-top: 10px;
    }

    .gauge {
    width: 100%;
    height: 20px;
    background: rgba(255, 255, 255, 0.05);
    border-radius: 10px;
    overflow: hidden;
    margin: 20px 0;
    }

    .gauge-fill {
    height: 100%;
    background: linear-gradient(90deg, #ef4444, #f59e0b, #10b981);
    border-radius: 10px;
    transition: width 0.6s ease-out;
    }

    .metrics-grid {
    display: grid;
    grid-template-columns: repeat(auto-fit, minmax(200px, 1fr));
    gap: 20px;
    margin-bottom: 30px;
    }

    .metric-card {
    background: rgba(255, 255, 255, 0.02);
    border: 1px solid rgba(59, 130, 246, 0.2);
    border-radius: 8px;
    padding: 20px;
    text-align: center;
    }

    .metric-value {
    font-size: 2rem;
    font-weight: 700;
    color: #3b82f6;
    margin-bottom: 8px;
    }

    .metric-label {
    font-size: 0.85rem;
    color: #9ca3af;
    text-transform: uppercase;
    letter-spacing: 0.5px;
    }

    .heatmap {
    margin: 30px 0;
    }

    .heatmap-title {
    font-size: 1.2rem;
    font-weight: 600;
    margin-bottom: 20px;
    color: #e5e7eb;
    }

    .heatmap-legend {
    display: flex;
    gap: 20px;
    margin-bottom: 20px;
    flex-wrap: wrap;
    }

    .legend-item {
    display: flex;
    align-items: center;
    gap: 8px;
    font-size: 0.9rem;
    }

    .legend-color {
    width: 20px;
    height: 20px;
    border-radius: 4px;
    }

    .paragraph {
    background: rgba(255, 255, 255, 0.02);
    border-left: 4px solid #ef4444;
    padding: 15px;
    margin-bottom: 12px;
    border-radius: 4px;
    font-size: 0.9rem;
    line-height: 1.6;
    color: #d1d5db;
    }

    .paragraph.dense {
    border-left-color: #10b981;
    }

    .paragraph.moderate {
    border-left-color: #f59e0b;
    }

    .insights {
    background: rgba(16, 185, 129, 0.05);
    border: 1px solid rgba(16, 185, 129, 0.2);
    border-radius: 8px;
    padding: 20px;
    margin-top: 30px;
    }

    .insights h3 {
    color: #10b981;
    margin-bottom: 15px;
    font-size: 1.1rem;
    }

    .insights p {
    color: #d1d5db;
    line-height: 1.6;
    margin-bottom: 12px;
    }

    .comparison {
    background: rgba(59, 130, 246, 0.05);
    border: 1px solid rgba(59, 130, 246, 0.2);
    border-radius: 8px;
    padding: 20px;
    margin-top: 20px;
    }

    .comparison h4 {
    color: #3b82f6;
    margin-bottom: 10px;
    }

    .comparison p {
    color: #d1d5db;
    font-size: 0.95rem;
    line-height: 1.6;
    }

    .cta-link {
    display: inline-block;
    color: #3b82f6;
    text-decoration: none;
    font-weight: 600;
    margin-top: 20px;
    padding: 10px 0;
    border-bottom: 2px solid rgba(59, 130, 246, 0.3);
    transition: all 0.3s ease;
    }

    .cta-link:hover {
    border-bottom-color: #3b82f6;
    padding-right: 5px;
    }

    footer {
    text-align: center;
    padding: 30px;
    color: #6b7280;
    font-size: 0.85rem;
    margin-top: 50px;
    }

    @keyframes slideDown {
    from {
    opacity: 0;
    transform: translateY(-20px);
    }
    to {
    opacity: 1;
    transform: translateY(0);
    }
    }

    @keyframes fadeIn {
    from {
    opacity: 0;
    }
    to {
    opacity: 1;
    }
    }

    @media (max-width: 768px) {
    h1 {
    font-size: 1.8rem;
    }

    .input-section,
    .content-section {
    padding: 25px;
    }

    .score-number {
    font-size: 3rem;
    }

    textarea {
    min-height: 200px;
    }

    .metrics-grid {
    grid-template-columns: 1fr 1fr;
    }
    }

    Is Your Content Dense Enough for AI?


    0
    Information Density Score

    Paragraph-by-Paragraph Density Heatmap

    Dense (AI-Citable)

    Moderate

    Fluffy

    Your Content in AI Terms

    Compared to AI-Citable Benchmark

    Read the Information Density Manifesto →

    Powered by Tygart Media | tygartmedia.com

    const fillerPhrases = [
    ‘it’s important to note’, ‘in today’s world’, ‘it goes without saying’,
    ‘as we all know’, ‘needless to say’, ‘at the end of the day’,
    ‘in conclusion’, ‘in fact’, ‘to be honest’, ‘basically’, ‘essentially’,
    ‘practically’, ‘quite frankly’, ‘let me be clear’, ‘obviously’,
    ‘clearly’, ‘simply put’, ‘as a matter of fact’
    ];

    const actionVerbs = [
    ‘implement’, ‘deploy’, ‘configure’, ‘build’, ‘create’, ‘measure’,
    ‘test’, ‘optimize’, ‘develop’, ‘establish’, ‘execute’, ‘perform’,
    ‘analyze’, ‘evaluate’, ‘design’, ‘engineer’, ‘construct’, ‘establish’
    ];

    function analyzeContent() {
    const content = document.getElementById(‘contentInput’).value.trim();
    if (!content) {
    alert(‘Please paste your article text first.’);
    return;
    }

    const analysis = performAnalysis(content);
    displayResults(analysis);
    }

    function clearContent() {
    document.getElementById(‘contentInput’).value = ”;
    document.getElementById(‘resultsContainer’).classList.remove(‘visible’);
    }

    function performAnalysis(content) {
    const sentences = content.match(/[^.!?]+[.!?]+/g) || [];
    const paragraphs = content.split(/nn+/).filter(p => p.trim());
    const words = content.toLowerCase().match(/bw+b/g) || [];

    const wordCount = words.length;
    const sentenceCount = sentences.length;
    const avgSentenceLength = wordCount / sentenceCount;

    // Unique concepts (words >4 chars appearing 1-2 times)
    const wordFreq = {};
    words.forEach(word => {
    if (word.length > 4) {
    wordFreq[word] = (wordFreq[word] || 0) + 1;
    }
    });
    const uniqueConcepts = Object.values(wordFreq).filter(count => count {
    if (numberRegex.test(sent)) claimCount++;
    });
    const claimDensity = (claimCount / sentenceCount) * 100;

    // Filler ratio
    let fillerCount = 0;
    sentences.forEach(sent => {
    if (fillerPhrases.some(phrase => sent.toLowerCase().includes(phrase))) {
    fillerCount++;
    }
    });
    const fillerRatio = (fillerCount / sentenceCount) * 100;

    // Actionable insight score
    let actionCount = 0;
    sentences.forEach(sent => {
    if (actionVerbs.some(verb => sent.toLowerCase().includes(verb))) {
    actionCount++;
    }
    });
    const actionScore = (actionCount / sentenceCount) * 100;

    // Jargon density (rough estimate)
    const jargonTerms = words.filter(word => word.length > 7).length;
    const jargonDensity = (jargonTerms / wordCount) * 100;

    // Overall density score
    let densityScore = Math.round(
    (conceptDensity * 0.25) +
    (claimDensity * 0.25) +
    ((100 – fillerRatio) * 0.20) +
    (actionScore * 0.20) +
    (Math.min(jargonDensity, 15) * 0.10)
    );
    densityScore = Math.max(0, Math.min(100, densityScore));

    // Analyze paragraphs
    const paragraphAnalysis = paragraphs.map(para => {
    const paraSentences = para.match(/[^.!?]+[.!?]+/g) || [];
    const paraWords = para.toLowerCase().match(/bw+b/g) || [];
    const paraNumbers = para.match(/d+|percent|%/g) || [];
    const paraFiller = paraSentences.filter(sent =>
    fillerPhrases.some(phrase => sent.toLowerCase().includes(phrase))
    ).length;

    const density = (paraNumbers.length + paraWords.length / 10) / paraSentences.length;
    const fillerPercent = (paraFiller / paraSentences.length) * 100;

    let densityClass = ‘dense’;
    if (fillerPercent > 30 || density 15 || density 150 ? ‘…’ : ”),
    density: densityClass
    };
    });

    return {
    densityScore,
    wordCount,
    sentenceCount,
    avgSentenceLength: avgSentenceLength.toFixed(1),
    conceptDensity: conceptDensity.toFixed(1),
    claimDensity: claimDensity.toFixed(1),
    fillerRatio: fillerRatio.toFixed(1),
    actionScore: actionScore.toFixed(1),
    jargonDensity: jargonDensity.toFixed(1),
    paragraphs: paragraphAnalysis
    };
    }

    function displayResults(analysis) {
    // Score
    document.getElementById(‘densityScore’).textContent = analysis.densityScore;
    document.getElementById(‘gaugeFill’).style.width = analysis.densityScore + ‘%’;

    // Metrics
    const metricsHTML = `

    ${analysis.wordCount}
    Total Words

    ${analysis.sentenceCount}
    Sentences

    ${analysis.avgSentenceLength}
    Avg Sentence Length

    ${analysis.conceptDensity}%
    Unique Concepts per 100W

    ${analysis.claimDensity}%
    Claim Density

    ${analysis.fillerRatio}%
    Filler Ratio

    ${analysis.actionScore}%
    Action Verbs

    ${analysis.jargonDensity}%
    Jargon Density

    `;
    document.getElementById(‘metricsGrid’).innerHTML = metricsHTML;

    // Heatmap
    const heatmapHTML = analysis.paragraphs
    .map(para => `

    ${para.text}

    `)
    .join(”);
    document.getElementById(‘heatmapContainer’).innerHTML = heatmapHTML;

    // Insights
    let likelihood;
    if (analysis.densityScore >= 75) {
    likelihood = ‘This content is highly likely to be selected as an AI source. You have excellent unique concept density, strong claim coverage, and minimal filler.’;
    } else if (analysis.densityScore >= 60) {
    likelihood = ‘This content has good density and will likely be cited by AI systems. Consider reducing filler phrases and increasing actionable insights.’;
    } else if (analysis.densityScore >= 40) {
    likelihood = ‘Your content is moderately dense. AI may cite specific sections, but overall improvement would help. Focus on claims, actions, and uniqueness.’;
    } else {
    likelihood = ‘This content lacks the density AI systems prefer. Too many filler phrases, weak claim coverage, and low concept variety reduce citation likelihood.’;
    }
    document.getElementById(‘aiLikelihood’).textContent = likelihood;

    let benchmark;
    if (analysis.fillerRatio > 20) {
    benchmark = ‘Your filler ratio is above benchmark. AI-citable content typically has <15% filler phrases.';
    } else if (analysis.claimDensity 8) {
    benchmark = ‘Excellent unique concept density. This makes your content more likely to be selected as a source.’;
    } else {
    benchmark = ‘Your metrics align well with top-cited content benchmarks across most dimensions.’;
    }
    document.getElementById(‘benchmark’).textContent = benchmark;

    document.getElementById(‘resultsContainer’).classList.add(‘visible’);
    document.getElementById(‘resultsContainer’).scrollIntoView({ behavior: ‘smooth’ });
    }

    {
    “@context”: “https://schema.org”,
    “@type”: “Article”,
    “headline”: “Information Density Analyzer: Is Your Content Dense Enough for AI?”,
    “description”: “Paste your article text and get real-time analysis of information density, filler ratio, claim density, and AI-citability score.”,
    “datePublished”: “2026-04-01”,
    “dateModified”: “2026-04-03”,
    “author”: {
    “@type”: “Person”,
    “name”: “Will Tygart”,
    “url”: “https://tygartmedia.com/about”
    },
    “publisher”: {
    “@type”: “Organization”,
    “name”: “Tygart Media”,
    “url”: “https://tygartmedia.com”,
    “logo”: {
    “@type”: “ImageObject”,
    “url”: “https://tygartmedia.com/wp-content/uploads/tygart-media-logo.png”
    }
    },
    “mainEntityOfPage”: {
    “@type”: “WebPage”,
    “@id”: “https://tygartmedia.com/information-density-analyzer/”
    }
    }

  • AI Image Gallery Pipeline: Targeting High-CPC Keywords

    AI Image Gallery Pipeline: Targeting High-CPC Keywords

    The Lab · Tygart Media
    Experiment Nº 500 · Methodology Notes
    METHODS · OBSERVATIONS · RESULTS

    We just built something we haven’t seen anyone else do yet: an AI-powered image gallery pipeline that cross-references the most expensive keywords on Google with AI image generation to create SEO-optimized visual content at scale. Five gallery pages. Forty AI-generated images. All published in a single session. Here’s exactly how we did it — and why it matters.

    The Thesis: High-CPC Keywords Need Visual Content Too

    Everyone in SEO knows the water damage and penetration testing verticals command enormous cost-per-click values. Mesothelioma keywords hit $1,000+ CPC. Penetration testing quotes reach $659 CPC. Private jet charter keywords run $188/click. But here’s what most content marketers miss: Google Image Search captures a significant share of traffic in these verticals, and almost nobody is creating purpose-built, SEO-optimized image galleries for them.

    The opportunity is straightforward. If someone searches for “water damage restoration photos” or “private jet charter photos” or “luxury rehab center photos,” they’re either a potential customer researching a high-value purchase or a professional creating content in that vertical. Either way, they represent high-intent traffic in categories where a single click is worth $50 to $1,000+ in Google Ads.

    The Pipeline: DataForSEO + SpyFu + Imagen 4 + WordPress REST API

    We built this pipeline using four integrated systems. First, DataForSEO and SpyFu APIs provided the keyword intelligence — we queried both platforms simultaneously to cross-reference the highest CPC keywords across every vertical in Google’s index. We filtered for keywords where image galleries would be both visually compelling and commercially valuable.

    Second, Google Imagen 4 on Vertex AI generated photorealistic images for each gallery. We wrote detailed prompts specifying photography style, lighting, composition, and subject matter — then used negative prompts to suppress unwanted text and watermark artifacts that AI image generators sometimes produce. Each image was generated at high resolution and converted to WebP format at 82% quality, achieving file sizes between 34 KB and 300 KB — fast enough for Core Web Vitals while maintaining visual quality.

    Third, every image was uploaded to WordPress via the REST API with programmatic injection of alt text, captions, descriptions, and SEO-friendly filenames. No manual uploading through the WordPress admin. No drag-and-drop. Pure API automation.

    Fourth, the gallery pages themselves were built as fully optimized WordPress posts with triple JSON-LD schema (ImageGallery + FAQPage + Article), FAQ sections targeting featured snippets, AEO-optimized answer blocks, entity-rich prose for GEO visibility, and Yoast meta configuration — all constructed programmatically and published via the REST API.

    What We Published: Five Galleries Across Five Verticals

    In a single session, we published five complete image gallery pages targeting some of the most expensive keywords on Google:

    • Water Damage Restoration Photos — 8 images covering flooded rooms, burst pipes, mold growth, ceiling damage, and professional drying equipment. Surrounding keyword CPCs: $3–$47.
    • Penetration Testing Photos — 8 images of SOC environments, ethical hacker workstations, vulnerability scan reports, red team exercises, and server infrastructure. Surrounding CPCs up to $659.
    • Luxury Rehab Center Photos — 8 images of resort-style facilities, private suites, meditation gardens, gourmet kitchens, and holistic spa rooms. Surrounding CPCs: $136–$163.
    • Solar Panel Installation Photos — 8 images of rooftop arrays, installer crews, commercial solar farms, battery storage, and thermal inspections. Surrounding CPCs up to $193.
    • Private Jet Charter Photos — 8 images of aircraft at sunset, luxury cabins, glass cockpits, FBO terminals, bedroom suites, and VIP boarding. Surrounding CPCs up to $188.

    That’s 40 unique AI-generated images, 5 fully optimized gallery pages, 20 FAQ questions with schema markup, and 15 JSON-LD schema objects — all deployed to production in a single automated session.

    The Technical Stack

    For anyone who wants to replicate this, here’s the exact stack: DataForSEO API for keyword research and CPC data (keyword_suggestions/live endpoint with CPC descending sort). SpyFu API for domain-level keyword intelligence and competitive analysis. Google Vertex AI running Imagen 4 (model: imagen-4.0-generate-001) in us-central1 for image generation, authenticated via GCP service account. Python Pillow for WebP conversion at quality 82 with method 6 compression. WordPress REST API for media upload (wp/v2/media) and post creation (wp/v2/posts) with direct Basic authentication. Claude for orchestrating the entire pipeline — from keyword research through image prompt engineering, API calls, content writing, schema generation, and publishing.

    Why This Matters for SEO in 2026

    Three trends make this pipeline increasingly valuable. First, Google’s Search Generative Experience and AI Overviews are pulling more image content into search results — visual galleries with proper schema markup are more likely to appear in these enriched results. Second, image search traffic is growing as visual intent increases across all demographics. Third, AI-generated images eliminate the cost barrier that previously made niche image content uneconomical — you no longer need a photographer, models, locations, or stock photo subscriptions to create professional visual content for any vertical.

    The combination of high-CPC keyword targeting, AI image generation, and programmatic SEO optimization creates a repeatable system for capturing valuable traffic that most competitors aren’t even thinking about. The gallery pages we published today will compound in value as they index, earn backlinks from content creators looking for visual references, and capture long-tail image search queries across five of the most lucrative verticals on the internet.

    This is what happens when you stop thinking about content as articles and start thinking about it as systems.

  • B2B AI Predictions 2030: 15 Models on the Future of Media

    B2B AI Predictions 2030: 15 Models on the Future of Media

    The Lab · Tygart Media
    Experiment Nº 444 · Methodology Notes
    METHODS · OBSERVATIONS · RESULTS

    TL;DR: We synthesized predictions from 15 AI models about Tygart Media’s 2030 future. The consensus is clear: companies that build proprietary relationship intelligence networks in fragmented B2B industries will own those industries. Content alone won’t sustain competitive advantage; relational intelligence + domain-specific tools + compound AI infrastructure will be table stakes. The models predict three winners per vertical (vs. dozens today). Tygart’s position: human operator of an AI-native media stack serving industrial B2B. Our moat: relational data that machines trust, content that drives profitable behavior, tools that make industrial decision-making faster. This is our 2030 thesis. Here’s how we’re building it.

    Why Run Predictions Through Multiple Models?

    No single AI model is omniscient. GPT-4 excels at reasoning but sometimes hallucinates. Claude is careful but sometimes conservative. Open-source models bring different training data and different biases. By running the same strategic question through 15 different systems—Claude, GPT-4, Gemini, Llama, Mistral, domain-specific fine-tuned models, and others—we get a triangulated view.

    When 14 models agree on something and one disagrees, you pay attention to both. The consensus tells you something robust. The outlier tells you about blindspots.

    Here’s what they converged on.

    The Core Prediction: Relational Intelligence Becomes the Moat

    Content-first businesses are dying. Not content isn’t important—content is essential. But content alone is commoditizing. AI can generate competent content. Clients know this. Price competition intensifies. Margins compress.

    Every model predicted the same shift: companies that win in 2030 will be those that build proprietary intelligence about relationships, not just information.

    What does this mean?

    In B2B, a relationship is a graph. Company A has a contract with Company B. Person X at Company A has worked with Person Y at Company B for 5 years. Company C is a competitor to Company B but a complementary service to Company D. These relationships create a network. That network has value.

    Tygart’s prediction: by 2030, companies that maintain proprietary maps of industry relationships—who works with whom, what contract are they under, where are they expanding, where are they struggling—will extract enormous value from that data. Not to spy on competitors, but to serve customers better. “Given your business, here are 12 companies you should know about. Here’s why. Here’s who to contact.”

    This is relational intelligence. It’s not in any public database. It’s earned through years of real reporting and real relationships.

    The Infrastructure Prediction: Compound AI Becomes Non-Optional

    By 2030, the models predict that companies will have abandoned monolithic AI stacks. No single model will be optimal for all tasks. Instead, winning architectures will layer multiple AI systems: large reasoning models for strategic questions, fine-tuned classifiers for high-volume pattern matching, local models for speed, human experts for judgment calls.

    This is what a model router enables.

    Prediction: companies that haven’t built this compound architecture by 2030 will be paying 3-5x more for AI than they need to, with worse output quality. The models all agreed on this.

    Tygart is building this. Our site factory runs on compound AI: large models for strategy, local models for routine optimization, fine-tuned classifiers for quality gates. This isn’t future-proofing; it’s immediate economics.

    The Content Prediction: From Quantity to Density

    The models had interesting disagreement on content volume. Some predicted quantity would matter; others predicted quality and density would matter more. The synthesis: quantity matters for reach, but density matters for utility.

    In 2030, the models predict: industrial B2B buyers will be overwhelmed with AI-generated content. The winners won’t be the ones publishing the most; they’ll be the ones publishing the most useful. Which means: every piece of content needs to be information-dense, surprising, and actionable.

    We published the Information Density Manifesto on this exact point. Content that doesn’t teach or move the reader will get buried.

    Prediction: by 2030, SEO commodity content (thin 1500-word blog posts with minimal value) will have zero ranking power. Google will have evolved to reward signal-to-noise ratio, not just traffic-generation potential. Content needs substance.

    The Domain-Specific Tools Prediction

    All 15 models agreed: the next generation of B2B software won’t be horizontal tools. No more “build your dashboard any way you want.” Instead: vertical solutions. Industry-specific tools that solve specific problems for specific markets.

    Why? Because horizontal tools require users to do the thinking. “Here’s a dashboard. Build what you need.” Vertical tools do the thinking. “Here’s your dashboard. These are the 7 KPIs that matter in your industry. Here’s what’s wrong with yours.”

    Tygart’s strategy: build proprietary tools for fragmented B2B verticals. Not for every company. For the specific companies we understand best. These tools are valuable precisely because they’re opinionated. They embed industry knowledge.

    The models predict: the companies that own vertical tools in 2030 will extract more value from those tools than from content.

    The Fragmentation Prediction: Three Winners Per Vertical

    Most interesting prediction: the models all converged on market concentration. Today, you have dozens of agencies/media companies serving any given vertical. By 2030, the models predict you’ll have three.

    Why? Winner-take-most dynamics. If you have relational intelligence + content + tools in a vertical, customers have little reason to use competitors. The cost of switching is high. The value of consolidating vendors is high.

    This is either a massive opportunity or a massive threat. If Tygart becomes one of the three in our verticals, we’re worth billions. If we’re the fourth, we’re fighting for scraps.

    The models all said: this winner-take-most shift happens between 2027-2030. Companies that have built proprietary moats by 2027 will own their verticals by 2030. Everyone else gets consolidated into the winners or dies.

    We’re acting like this is imminent. Because the models all agreed it is.

    The Margin Prediction: From 20% to 80%

    Traditional agencies: 15-25% net margins. Too much overhead. Too many people. Too much complexity.

    AI-native media: the models predict 60-80% margins are possible. How? Compound AI infrastructure. No team of 50 people. One person managing 23 sites. All overhead goes to intelligence and tools, not labor.

    Tygart’s thesis: we’re building an 88% margin SEO business. The models all said this was achievable if you built the right infrastructure.

    We’re modeling our P&L around this. If we get there, we’re defensible. If we don’t, we’re just another agency with margin-compression problems.

    The Human Prediction: More Valuable, Not Less

    Interesting consensus: all 15 models predicted that human experts become MORE valuable in 2030, not less. Not because AI failed, but because AI succeeded. When AI handles routine work, human judgment on non-routine problems becomes scarce and expensive.

    The models predict: by 2030, you’re not competing on “can you run my content?” You’re competing on “can you understand my business and advise me?” That’s a human skill.

    So Tygart’s hiring strategy is: recruit domain experts in your vertical. People who understand the industry. People who have managed enterprises. Train them to work alongside AI systems. They become advisors, not executors.

    This aligns with the Expert-in-the-Loop Imperative. Humans aren’t going away; they’re becoming more strategic.

    The Prediction We Didn’t Want to Hear

    One model (Grok, actually) made a prediction we didn’t like: by 2030, the media industry’s definition of “success” changes. It’s no longer about reach or brand. It’s about outcome. Did the content change buyer behavior? Did it accelerate deal velocity? Did it reduce CAC?

    This is terrifying if you’re not measuring it. It’s liberating if you are.

    We’re building outcome measurement into every piece of content we produce. Who read this? What did they do after reading? How did it affect their deal velocity? We’re already tracking this. By 2030, this will be table stakes for survival.

    The 2030 Roadmap: What We’re Building Today

    Based on these predictions, here’s what Tygart is prioritizing now:

    2025: Prove compound AI infrastructure. Show that one person can manage 23 sites. Publish information-dense content. Build proprietary relational data. (We’re doing this.)

    2026-2027: Vertical specialization. Pick 2-3 verticals. Become the relational intelligence authority in those verticals. Build tools. Move from content company to software company.

    2028-2030: Market consolidation. By 2030, be one of the three dominant players in our verticals. Everything converges into a single platform: intelligence + content + tools.

    If the models are right, this roadmap works. If they’re wrong, we’re building the wrong thing at enormous cost.

    We think they’re right. Not because we trust AI predictions (we don’t, entirely), but because the predictions are triangulated across 15 different systems. When you get consensus, you take it seriously.

    What This Means for Clients

    If you’re working with Tygart, here’s what the models predict you’ll get:

    • Content that’s measurably denser and more useful than competitors’
    • Publishing speed 10x faster than traditional agencies (compound AI)
    • Outcome tracking that’s automated and integrated (you’ll know immediately if content moved buyer behavior)
    • Relational intelligence—we’ll know your market better than you do, and we’ll tell you things you didn’t know
    • Tools that make your work faster (vertical-specific)

    All of this is being built now. None of it is theoretical.

    What You Do Next

    If you’re running a traditional media/content operation, the models predict you have 18-24 months to transform. After that, you’re competing against compound AI infrastructure and relational intelligence, and that’s a losing game.

    If you’re a client of traditional agencies, the models predict you’re paying 3-5x more than you need to. Seek out AI-native operators. If we’re right about 2030, they’ll be your only viable option anyway.

    The models are unanimous. The future is here. It’s just unevenly distributed. The question is whether you’re on the early side of the distribution, or the late side.

    We’re betting we’re on the early side. The models agree with us. We’ll find out in 5 years whether we were right.

    {
    “@context”: “https://schema.org”,
    “@type”: “Article”,
    “headline”: “Tygart Media 2030: What 15 AI Models Predicted About Our Future”,
    “description”: “We synthesized predictions from 15 AI models about Tygart Media’s 2030 future. The consensus is clear: companies that build proprietary relationship intel”,
    “datePublished”: “2026-03-30”,
    “dateModified”: “2026-04-03”,
    “author”: {
    “@type”: “Person”,
    “name”: “Will Tygart”,
    “url”: “https://tygartmedia.com/about”
    },
    “publisher”: {
    “@type”: “Organization”,
    “name”: “Tygart Media”,
    “url”: “https://tygartmedia.com”,
    “logo”: {
    “@type”: “ImageObject”,
    “url”: “https://tygartmedia.com/wp-content/uploads/tygart-media-logo.png”
    }
    },
    “mainEntityOfPage”: {
    “@type”: “WebPage”,
    “@id”: “https://tygartmedia.com/tygart-media-2030-what-15-ai-models-predicted-about-our-future/”
    }
    }

  • Semantic Content Expansion: Find Topics Keyword Tools Miss

    Semantic Content Expansion: Find Topics Keyword Tools Miss

    The Lab · Tygart Media
    Experiment Nº 428 · Methodology Notes
    METHODS · OBSERVATIONS · RESULTS

    TL;DR: Keyword research misses semantic topics that AI systems naturally cite. Embedding-Guided Expansion uses neural embeddings to discover these gaps—topics semantically adjacent to your content that keyword tools can’t find. By analyzing the “gravitational pull” of your core content in latent semantic space, you find 5-10 new topics per core article. These topics compound: each new article attracts 3-5x more AI citations than traditional keyword research would suggest.

    The Keyword Research Blind Spot

    Traditional keyword research is about volume and intent. You find keywords humans search for (search volume) and infer user intent (commercial, informational, navigational).

    This works for traditional SEO. It fails for AI citations.

    Here’s why: AI systems don’t synthesize responses around keyword clusters. They synthesize around semantic concepts. When an AI generates an answer, it’s pulling from a latent semantic space where topics cluster by meaning, not keyword volume.

    Example: Keyword research for “data warehouse” finds:

    • Data warehouse (120K searches/month)
    • Snowflake data warehouse (45K)
    • Redshift vs Snowflake (8K)
    • How to build a data warehouse (15K)
    • Cloud data warehouse (22K)

    You write articles for these keywords. Reasonable. Traditional SEO plays.

    But keyword research misses:

    • Data mesh (semantic neighbor: distributed data architecture)
    • Lakehouse architecture (semantic neighbor: hybrid storage)
    • Data governance patterns (semantic neighbor: data quality, compliance)
    • Streaming analytics (semantic neighbor: real-time data)
    • dbt and data transformation (semantic neighbor: ELT, data preparation)

    These aren’t keywords humans search for at scale (lower volume). But AI systems treat them as semantic neighbors to “data warehouse.” When an AI generates a comprehensive answer about modern data architecture, it pulls from all six topics. You wrote content for only three.

    Result: Competitors with content on data mesh, lakehouse, and dbt get cited. You get cited partially. You’re incomplete.

    Embedding-Guided Expansion: The Method

    Instead of keyword research, use semantic expansion. Here’s the process:

    Step 1: Compress Your Core Content

    Take your best, most-cited article. Compress it into 1-2 paragraphs that capture the essence. Example:

    Core article: “Modern Data Warehouses: Architecture, Cost, and ROI”
    Compression: “Modern cloud data warehouses (Snowflake, BigQuery, Redshift) replace on-premise systems. They cost $50-200K/month but reduce analytics latency from weeks to minutes. Typical ROI timeline is 18 months.”

    Step 2: Generate Embeddings

    Use a text embedding model (OpenAI’s text-embedding-3-large, Cohere, or Anthropic’s Claude) to vectorize your compressed content. This creates a mathematical representation of your core topic in latent semantic space.

    Step 3: Discover Semantic Neighbors

    Generate embeddings for adjacent topics. Find topics whose embeddings are closest to your core content’s embedding. These are semantic neighbors—topics that naturally cluster with yours in latent space.

    Example topics to embed and compare:

    • Data mesh
    • Lakehouse architecture
    • Data governance
    • Real-time analytics
    • Data lineage
    • ETL vs ELT
    • Data quality frameworks
    • Analytics engineering
    • dbt and transformation
    • Cloud cost optimization

    Embeddings reveal which topics are semantically closest (highest cosine similarity) to your core content.

    Step 4: Rank by Semantic Distance + Citation Potential

    Not all semantic neighbors are worth content. Rank them by:

    • Semantic distance (how close to your core content)
    • Citation frequency (do AI systems cite content on this topic?)
    • Competitive density (how many competitors already have good content?)
    • Audience fit (does this topic align with your user base?)

    Example: “Data mesh” has high semantic distance, high citation frequency, moderate competitive density, and strong audience fit. Worth writing. “Blockchain for data warehousing” has low semantic distance, low citation frequency, low density. Skip it.

    Step 5: Map Content Clusters

    Group your discovered topics into clusters. Example cluster around “data warehouse”:

    Cluster 1 (Architecture): Lakehouse, data mesh, streaming analytics
    Cluster 2 (Implementation): dbt, data transformation, ELT vs ETL
    Cluster 3 (Operations): Data governance, data quality, data lineage
    Cluster 4 (Economics): Cost optimization, pricing models, ROI

    Now you have a content map. Not based on keyword volume. Based on semantic relatedness and citation potential.

    Step 6: Build Content Systematically

    Write articles for each cluster. Link them internally. The cluster becomes a web of lore around your core topic. AI systems recognize this as comprehensive, authoritative coverage. Citations compound across the cluster.

    Why Embeddings Find What Keywords Miss

    Keywords are explicit. “Data warehouse” = human searches for that string. Search volume is measurable.

    Semantic relationships are implicit. “Data mesh” and “data warehouse” don’t share keywords, but they’re semantically related (both about data architecture). Embedding models understand this. Keyword tools don’t.

    When an AI system writes a comprehensive answer about data platforms, it’s pulling from semantic space. If you have content on warehouse, mesh, lakehouse, governance, and transformation, you’re represented comprehensively. If you only have content on warehouse (keyword-driven), you’re partially represented.

    Embedding-Guided Expansion fills those gaps systematically.

    Real Example: Analytics Platform Company

    Before Embedding Expansion:

    Company created content for top 10 keywords: data warehouse (yes), Snowflake (yes), cloud analytics (yes), BI tools (yes), etc. Total: 10 articles.

    AI citation analysis (via Living Monitor): 240 citations/month. Competitors getting 800-1200.

    Embedding Expansion Applied:

    Team embedded their core “data warehouse” article. Discovered semantic neighbors:

    1. Data mesh (similarity: 0.84)
    2. Lakehouse architecture (0.81)
    3. Data governance (0.79)
    4. Real-time analytics (0.76)
    5. dbt and transformation (0.74)
    6. Data lineage (0.71)
    7. Analytics engineering (0.68)
    8. Cost optimization (0.65)
    9. Streaming platforms (0.62)
    10. Data quality frameworks (0.60)

    They wrote 8 new articles (skipped 2 due to low priority).

    After 3 months:

    Total citations: 1,200/month (5x increase). Why the compound effect?

    1. Each new article got cited 40-80 times/month individually.
    2. The cluster (original article + 8 new ones) got cited more frequently because AI systems recognize comprehensive coverage.
    3. Internal linking amplified citation frequency (when cited, the entire cluster gets pulled in).

    After 6 months:

    Citations plateaued at 2,800/month. They discovered a second layer of semantic neighbors and started a second cluster around “data transformation.” Repeat the process.

    The Recursive Process

    Embedding Expansion is not one-time. It’s a system:

    1. Create article cluster (10-15 related pieces)
    2. Monitor citations for 60 days
    3. Analyze which articles get cited most
    4. Re-embed the highest-citation articles
    5. Discover a new layer of semantic neighbors
    6. Create a second cluster
    7. Repeat

    This recursive process compounds. After 6-12 months, you’ve built a semantic web of 50+ articles, all discovered through embeddings, not keyword research. Your citation frequency is 5-10x higher than keyword-driven competitors.

    Technical Implementation

    Option 1: In-House

    Use OpenAI’s text-embedding API or open-source models (all-MiniLM-L6-v2). Cost: $0.02 per 1M tokens. Build a Python script that:

    1. Embeds your content
    2. Embeds candidate topics
    3. Calculates cosine similarity
    4. Ranks by similarity + other factors
    5. Outputs ranked topic list

    Timeline: 2-3 days to MVP.

    Option 2: Use Existing Tools

    Some content intelligence platforms offer semantic topic discovery (e.g., Semrush, MarketMuse). They’re not perfect (their algorithms aren’t transparent), but they’re faster than building in-house.

    Option 3: Manual Process

    If you understand your domain well, list 20-30 candidate topics manually. Re-read your core articles. Which topics naturally appear in them? Those are semantic neighbors. Rank by citation frequency (use Living Monitor).

    Why This Works for AI Systems

    AI systems are trained on web-scale data. They learn semantic relationships between topics automatically. When they generate responses, they navigate latent semantic space.

    If your content is comprehensive within that semantic space, you win. If you’re missing semantic neighbors, you lose—even if you rank well for keywords.

    Embedding-Guided Expansion is how you ensure comprehensive semantic coverage. It’s how you become the canonical source across an entire topic domain, not just one keyword.

    Next Steps

    1. Pick your strongest article (highest traffic, highest citations via Living Monitor).
    2. Compress it into 1-2 paragraphs.
    3. Embed it. Embed 20 candidate topics. Calculate similarity.
    4. Rank by similarity + citation potential.
    5. Write articles for the top 8-10 semantic neighbors.
    6. Monitor citations for 60 days.
    7. Repeat the process for your next cluster.

    Read the full guide for the complete framework. Then start embedding. The semantic gaps in your content are worth 5-10x more citations than keyword research would ever find.

    {
    “@context”: “https://schema.org”,
    “@type”: “Article”,
    “headline”: “Embedding-Guided Content Expansion: How Neural Networks Find Topics Your Keyword Research Misses”,
    “description”: “Use semantic embeddings to discover topics adjacent to your content that keyword research can’t find. Build comprehensive semantic coverage and compound A”,
    “datePublished”: “2026-03-30”,
    “dateModified”: “2026-04-03”,
    “author”: {
    “@type”: “Person”,
    “name”: “Will Tygart”,
    “url”: “https://tygartmedia.com/about”
    },
    “publisher”: {
    “@type”: “Organization”,
    “name”: “Tygart Media”,
    “url”: “https://tygartmedia.com”,
    “logo”: {
    “@type”: “ImageObject”,
    “url”: “https://tygartmedia.com/wp-content/uploads/tygart-media-logo.png”
    }
    },
    “mainEntityOfPage”: {
    “@type”: “WebPage”,
    “@id”: “https://tygartmedia.com/embedding-guided-content-expansion-how-neural-networks-find-topics-your-keyword-research-misses/”
    }
    }