Tag: Water Damage

  • Selling Into General Contractors: The Trade That Discovers Mitigation Work Mid-Demolition

    Selling Into General Contractors: The Trade That Discovers Mitigation Work Mid-Demolition

    Direct answer: General contractors are a strategically different referral partner than any other trade in this series because they are simultaneously the largest threat to your reconstruction revenue and the most reliable source of mid-demolition mitigation discovery work. When a GC opens up a wall on a kitchen remodel and finds black mold on a studwall or wet insulation above a ceiling, they need a mitigation partner who can be on site in under twenty-four hours, contain the problem, produce clearance, and then hand the rebuild back to them without competing. The restoration company that learns to be the “fastest, cleanest, non-threatening” mitigation partner to three or four quality GCs in their market unlocks a referral channel the volume trades can’t match — but only if they’ve solved the scope-lane problem first.

    Most restoration owners view general contractors as either a threat or an afterthought. Some see GCs as the company that won the rebuild they should have gotten. Others see them as a generic “referral source” in the same bucket as plumbers and realtors. Both views cost money.

    The truth is more specific. General contractors are the trade most likely to find mitigation work that nobody else sees — because they’re the ones literally opening walls, pulling ceilings, and removing cabinets. They are also the trade with the highest probability of scope conflict with a restoration company, because reconstruction is revenue for both sides.

    This article teaches you how general contractors actually make money, how they operate day-to-day, the six moments in a remodel or build where they discover mitigation work, why the partnership almost always fails on scope-lane ambiguity, and the specific ninety-day program to turn three GCs in your market into a predictable referral channel without ever fighting over the rebuild. It is the sixth in The Restoration Operator’s Playbook partner-industries series, and it is the one that requires the most precision.


    How a General Contractor Actually Makes Money

    If you’re going to stand in front of a GC owner or project manager and have them take you seriously, you have to understand their economics at the same depth a good estimator does.

    The revenue mix. A mid-market residential remodeling GC typically runs between $1.5M and $8M in annual revenue per operator. The 2024 NAHB data pegs the average residential remodeler at roughly $2.7M in total revenue. Project mix is typically 60–80 percent remodel work (kitchens, baths, additions, whole-home) and 20–40 percent smaller handyman or carpentry work. Some GCs cross into light commercial or multifamily; those carry different economics.

    The margin structure. Residential remodelers hit their highest net profit margins in nearly thirty years in 2024 — 6.3 percent net on average, with gross margins at 29.9 percent. That’s a five-point improvement over 2021. Healthy GCs target 8–10 percent net margin. The ones working below that are either buying market share or bleeding on one or two bad projects. Standard markup on remodel work runs 20–30 percent on total project cost, with over 30 percent of builders marking up 25 percent or more.

    Overhead and profit is a specific line. On any professional estimate, “O&P” is a visible markup — typically 10 percent overhead and 10 percent profit, stacked on cost, which is the industry-standard 10-and-10 that insurance carriers have grudgingly accepted on reconstruction for decades. GCs defend that line because without it they operate at a loss. Every negotiation on a restoration-related rebuild is a negotiation on O&P.

    The project lifecycle. A typical residential remodel moves through six stages: lead intake, estimate/design, contract signing, pre-construction planning, active construction, punch list and closeout. A kitchen remodel runs four to eight weeks of active construction. A whole-home remodel runs three to nine months. The GC’s cash flow is governed by draw schedules — deposit, then progress payments at defined milestones. Any surprise (mold discovered, water damage found, structural rot) that pauses the project threatens the draw schedule, which is why they care intensely about who they call when it happens.

    The operational engine. Most mid-market GCs run with a small office team (owner, estimator, one or two project managers, bookkeeper) and a blend of W-2 lead carpenters and subcontractor trades. Their software stack is typically Buildertrend, CoConstruct, JobTread, Builderall, or a lower-end ProCore. Selections, change orders, and daily logs all live in that software. Your name has to end up in their change-order workflow as the default mitigation partner.


    How General Contractors Acquire Customers

    Understanding how GCs sell tells you exactly what they need from a partner.

    Referrals from past clients. For quality residential remodelers, 50–70 percent of revenue comes from past client referrals and word of mouth. The longer they’ve been in market, the higher that percentage. This is why a single bad experience with a mitigation partner that delays a project will end the relationship — their entire business model rests on not producing unhappy customers.

    Designers, architects, and realtors. Design-build and custom GCs work a network of interior designers and architects who spec them into projects. Higher-end GCs cultivate realtor relationships for pre-sale and post-sale remodeling work. This is a slow-flywheel channel; referrals trickle in over years.

    Organic search and GBP. “Kitchen remodel contractor [city]” and bathroom-specific searches are the largest digital lead source for most remodelers. GBP reviews, photo portfolios, and answer-engine-optimized pages drive the top of the local pack. Houzz and similar portfolio platforms supplement.

    Paid lead platforms. Angi, Thumbtack, Porch, and HomeAdvisor are where the lower-margin, more-competitive segment lives. Established GCs with strong referral flywheels usually minimize their reliance on these platforms. Volume remodelers use them aggressively and accept thinner margins.

    Home shows and events. Local home shows, Parade of Homes, and neighborhood-specific events are still a real channel for custom builders and high-end remodelers. The economics are project-specific — a single $150,000 remodel from a home show pays for the booth many times over.

    Insurance work. Some GCs specialize in insurance reconstruction — storm damage, fire rebuild, water damage reconstruction after mitigation. This is the lane that creates the most direct scope conflict with full-service restoration companies. If a GC’s book is 40+ percent insurance rebuild work, they are a competitor more than a partner. If it’s less than 15 percent, they are a natural referral source.

    The takeaway: GCs live on reputation, speed, and not surprising their clients. Everything you offer them has to be oriented around protecting their schedule, their margin, and their client relationship.


    Why the GC Referral Channel Is Structurally Different from Plumbers, HVAC, or Pest Control
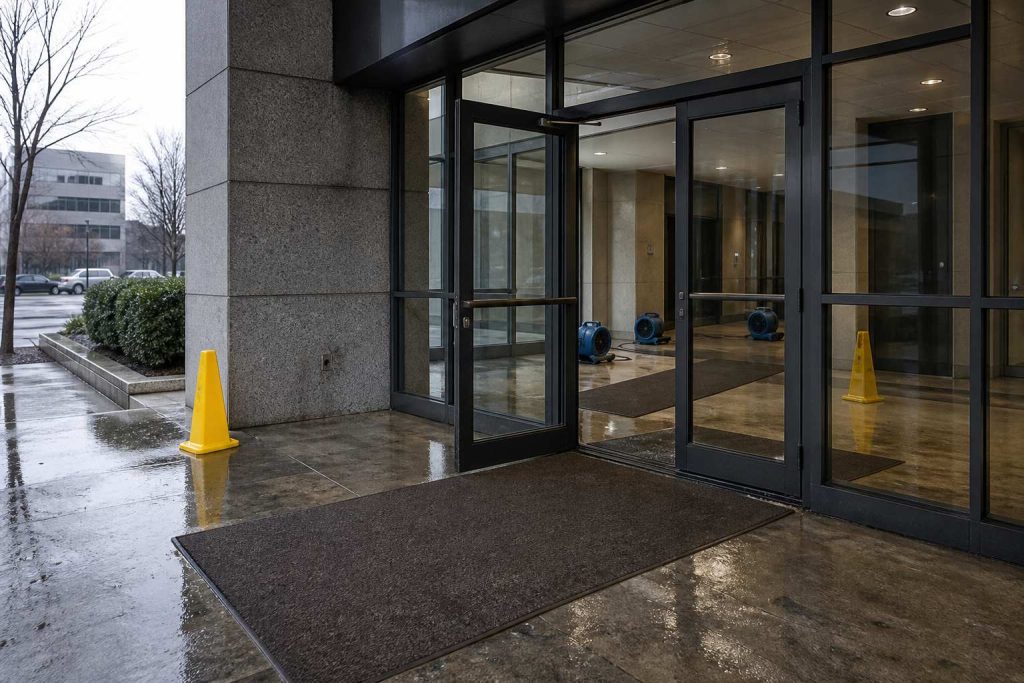
    Commercial office lobby entrance after a pipe burst with caution cones and wet runners
    GCs discover mitigation mid-demolition — be ready for that call.

    This is the strategic hinge of the whole article.

    A plumber who calls you on a burst pipe has no financial stake in the mitigation scope or the reconstruction scope. They stop at the isolation valve. They want the homeowner taken care of so they get referrals back. The economics are clean.

    A general contractor who finds mold or water damage during demolition has a financial stake in at least the reconstruction scope, sometimes both. Their options when they uncover mitigation work are:

    1. Stop the project, call in an independent mitigation company, eat the schedule hit, and continue their own rebuild.
    2. Try to handle the mitigation themselves without proper training, insurance, or containment protocols.
    3. Hand the job fully to a restoration company that will mitigate and rebuild — losing the rebuild.
    4. Refuse to touch it and bounce the homeowner to a restorer entirely — losing everything.

    Option 1 is what they want. It’s the only option where the GC keeps their client, keeps their rebuild scope, protects their insurance and liability position, and doesn’t spread mold through an occupied home (which is a real risk when untrained remodel crews attempt mold removal — their general liability policy specifically excludes pollution and mold work).

    Option 2 is what most of them default to when they don’t have a trusted restoration partner. The results range from acceptable to catastrophic. It also violates the nearly-universal state rule that the company assessing mold cannot also be the company remediating it.

    Your entire value proposition to a GC is making Option 1 effortless — fast, clean, scoped correctly, with clearance documentation that protects everyone, and with a handoff back to their rebuild that they can defend to their client.

    If you can’t credibly commit to not touching the rebuild, you are Option 3 in their mind and they will never call you except in emergencies. If you can commit to it in writing and prove it over three or four projects, you become the default in their change-order workflow.


    The Six Mitigation-Discovery Moments on a General Contractor Project
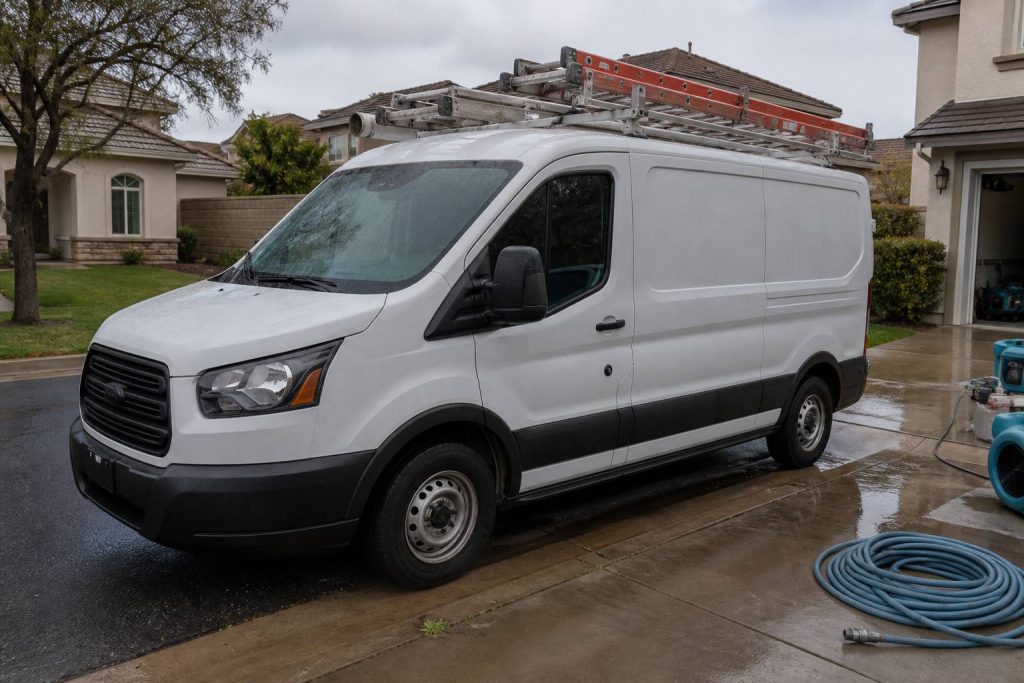
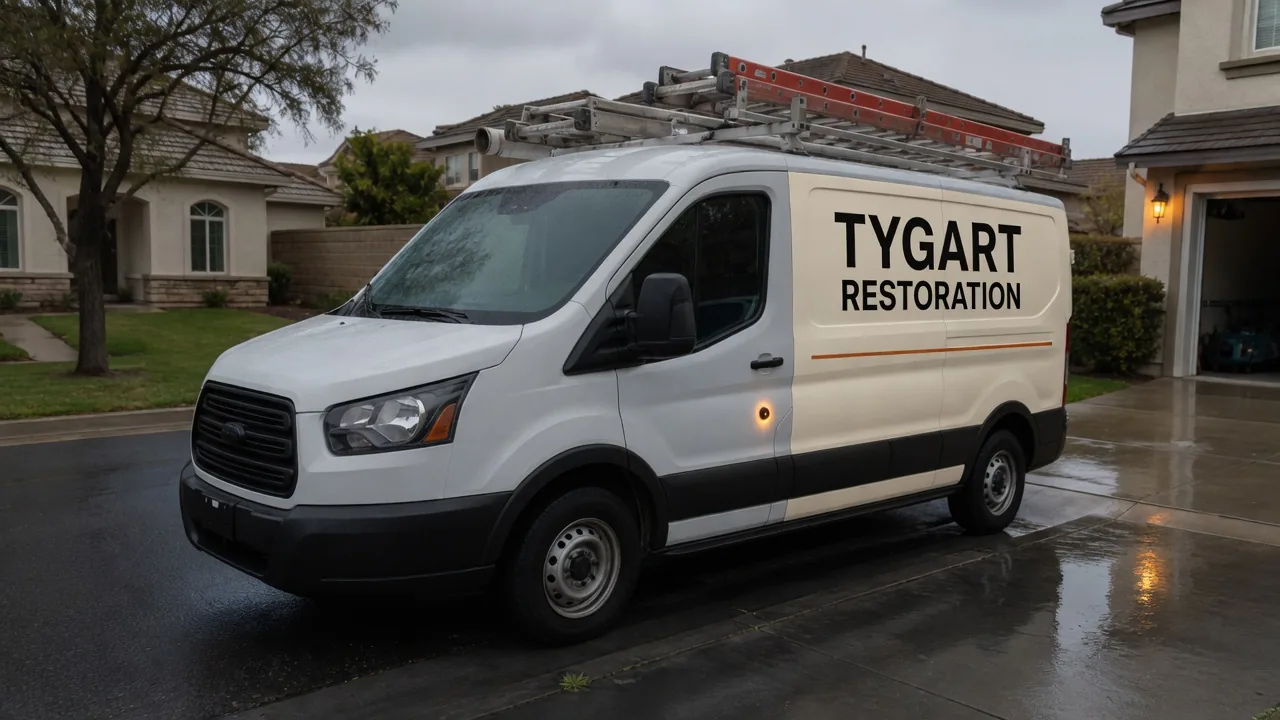
    White restoration work van with ladder rack parked at a suburban jobsite curb
    Six mitigation-discovery moments on a GC project.

    Every one of these moments is a mid-project crisis for the GC. Learn them.

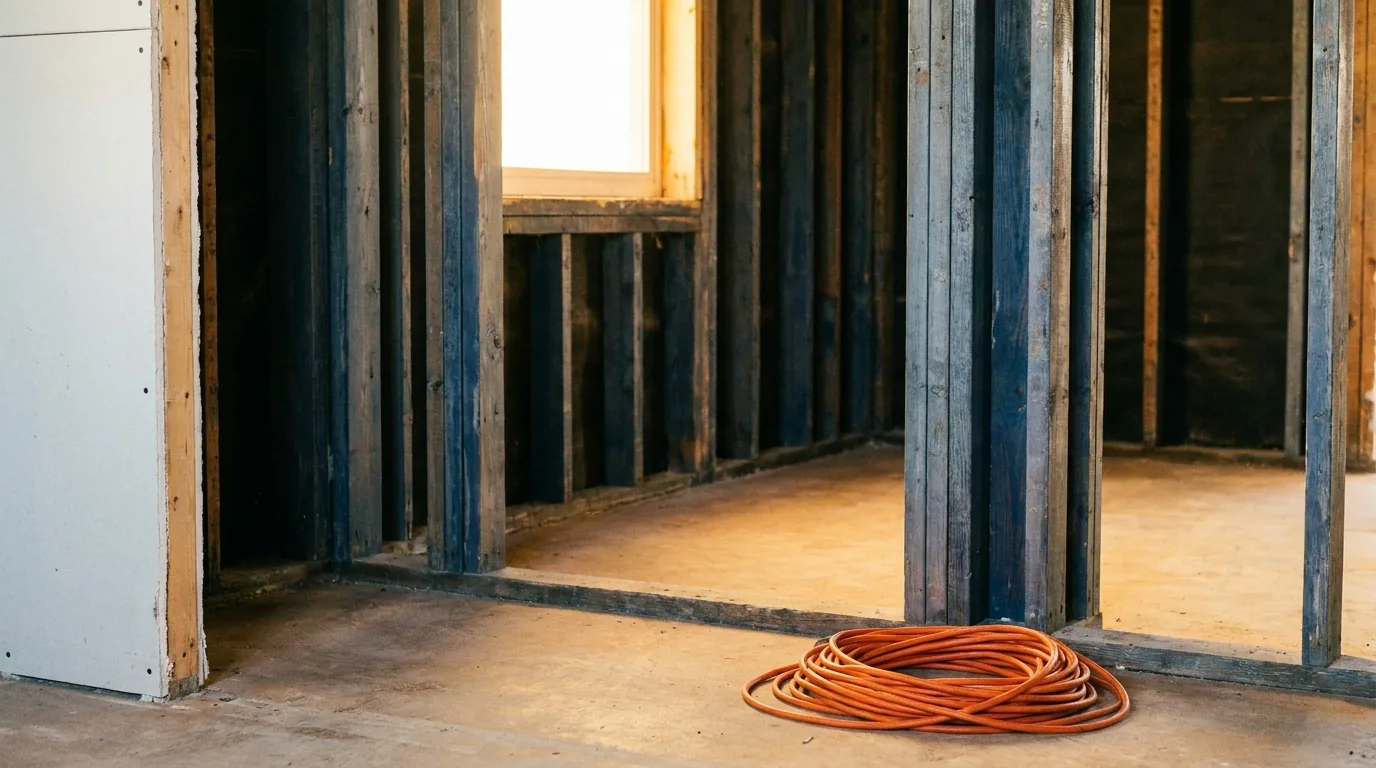
    Moment 1: The kitchen or bath demo. Cabinets come off the wall, drywall gets cut, and the crew finds dark mold behind the sink run, on the back of a dishwasher cabinet, or inside a vanity toe kick from a slow supply-line drip. This is the single most common discovery moment in residential remodeling. The GC needs containment up, air scrubbers running, and a mitigation scope on paper within twenty-four hours so the remodel can continue on the rest of the footprint.

    Moment 2: The ceiling pull on a second-story bath addition. A GC opening the ceiling below a second-story bathroom finds wet insulation, stained subfloor, and microbial growth from years of a slow toilet flange leak or shower pan failure. The mitigation lane is clear; the rebuild lane is clearly the GC’s. This is one of the cleanest scope hand-offs in the business.

    Moment 3: The basement or crawl walk during a whole-home remodel. The GC doing a whole-home remodel puts a foreman into the crawl or basement early and finds efflorescence, standing water, failed sump, and microbial growth on joists. Dry-out and remediation are a mitigation scope; slab repair, joist sistering, and finish are the GC’s rebuild.

    Moment 4: The hurricane, storm, or fire rebuild discovery. A GC hired directly by a homeowner after a storm or fire event to handle rebuild often discovers that the prior “mitigation” was incomplete — unreached wet materials behind the walls, inadequate drying, hidden mold on the back side of sheathing. They need a mitigation partner to redo the work, document it, and produce clearance so their rebuild stands up to inspection and claim scrutiny.

    Moment 5: The pre-closing renovation before a home sale. A realtor or seller hires a GC to do punch-list rehab before listing. During the work, the GC finds active moisture issues that will kill the deal if not documented, remediated, and cleared. These are time-pressured — the listing is either on the market or about to be — and the margin is typically healthier because the seller is motivated.

    Moment 6: The commercial tenant improvement. A GC doing a tenant improvement build-out in an older commercial space opens the ceiling and finds chronic roof leak damage, legacy microbial growth, or insulation contamination. Landlord, tenant, and GC all want the mitigation handled quickly and documented cleanly. These scopes can be sizable and are the highest-dollar on the GC-partnership list.


    Why Most Restoration-to-GC Partnerships Fail

    The failure modes here are sharper and more consequential than in any of the other partner-industry pairings.

    1. Competing on the rebuild. The single largest mistake. If a GC refers you a mitigation job and you bid the rebuild on top of it, you have ended the relationship on day one. Every GC relationship has to open with an explicit, written lane agreement: you handle mitigation, containment, drying, remediation, documentation, clearance. They handle reconstruction. Full stop.

    2. Slow scope-and-start on the mitigation. A GC’s rebuild schedule is frozen until mitigation completes. Every day you add to the mitigation scope costs them money in trade coordination, client patience, and possibly liquidated damages on commercial work. A twenty-four-hour site visit, a same-day scope, and a start-by-tomorrow commitment is the minimum bar.

    3. Surprising the client without the GC on the call. The GC owns the client relationship. If your PM walks into the homeowner’s kitchen and starts talking scope, pricing, or what should be done without looping in the GC, you’ve just undermined their authority on their own project. Every client conversation goes through the GC unless they’ve explicitly handed it off.

    4. Bad containment or cross-contamination. A restoration company that spreads mold to clean parts of the GC’s project, or that fails to protect cabinets, floors, and finishes the GC has already installed, will never be called again. The physical craftsmanship of the containment and protection is the entire test.

    5. Insurance-funded work confusion. Some of these discoveries are covered by the homeowner’s policy, some aren’t. If you start talking directly to adjusters before the GC has set the stage, you’ve changed the dynamic of the project. Coordination with the GC on claim intake is mandatory.

    6. No clearance documentation. The GC needs a third-party clearance letter or an in-house clearance protocol documented to a level that protects them and their client. If your mitigation closes with nothing but an invoice, you’ve left the GC exposed. This is where restoration companies who “just do the work” lose to restoration companies who “do the work and document the work.”


    Ten Operational Disciplines for a GC Referral Channel That Works

    If you want this to be a reliable flow rather than a lucky phone call every six months, run the channel with real rigor.

    1. Written scope-lane agreement with every GC partner. One page. You do mitigation, containment, dry-out, remediation, documentation, clearance. They do reconstruction. Your estimating software is set to exclude reconstruction line items by default on their projects. Signed by both owners. Filed.

    2. One trained project manager as the single point of contact per GC. Not a general intake desk. The same PM takes every call from that GC, runs every project, attends every discovery meeting. Relationships are human.

    3. Twenty-four-hour site visit commitment. Non-negotiable. When a GC calls, you’re on site inside twenty-four hours with a scope roughed and the crew scheduled. Your intake has to be routed so GC calls skip the residential queue entirely.

    4. Scope-first pricing, not low-ball pricing. You are not competing with three other restoration companies on price. You are competing on speed, clean work, and clear documentation. Price accordingly. Race-to-the-bottom pricing signals you’ll cut corners on containment, which is exactly what the GC can’t afford.

    5. Explicit hand-off protocol. At the end of mitigation: site walk with the GC’s PM, clearance documentation delivered, photo documentation of affected materials turned over, a short written narrative that the GC can give their client. The project resumes the next day with zero ambiguity.

    6. GC-specific change-order language. Your proposals should use the language of the GC’s world — “change-order eligible scope,” “trade coordination window,” “documentation package for client file.” It makes you look like a fluent partner, not a volume restoration brand.

    7. Do not talk to the homeowner or adjuster without the GC. Every client communication goes through the GC unless they’ve explicitly authorized a direct line. On a call with the adjuster, the GC is on the line or cc’d.

    8. Reciprocity on clean rebuild referrals. When a homeowner calls you directly for a mitigation scope that will clearly need reconstruction, name the GC. Hand over the client cleanly. Do not quietly refer the rebuild to a friend-of-a-friend and think they won’t notice. The GC partner will find out and the relationship is over.

    9. Quarterly ride-along or site tour. Once a quarter, visit one of their active projects to see how they work, meet the lead carpenter, and understand how they run sites. The reverse is valuable too — invite them to your warehouse and show them how your dry-out and containment equipment works.

    10. Named inclusion in their subcontractor prequalification file. Most real GCs maintain a prequal file — insurance certs, licenses, references, W-9. Fill it out completely and keep it current. If you’re in the file, you’re in the bid. If you’re not, you’re not.


    The Two-Way Reciprocity Model (Calibrated for GC Scope Risk)

    The reciprocity model here is different from plumbers or pest control because the scope overlap is real.

    Flow 1: GC → restoration. GC discovers water, mold, or structural moisture during demolition or build. Calls your PM directly. Site visit within twenty-four hours. Scope delivered within forty-eight. Mitigation executed. Clearance issued. Rebuild returned to the GC. Documentation package in the client file.

    Flow 2: Restoration → GC. A homeowner calls you direct on a loss that will clearly require meaningful reconstruction — drywall finishing beyond patchwork, flooring, cabinetry, full bathroom rebuild, whole-room restoration. You complete mitigation. You hand the client to the GC partner for the rebuild. You name the GC on the job site, in the clearance letter, and in the customer conversation. You take a referral fee only if it’s legal in your state and on that specific job type — otherwise the reciprocity itself is the currency.

    Flow 3: Joint emergency protocol for large losses. On a catastrophic loss (major fire, multi-room flood, commercial water event), you and the GC mobilize together on day one. You handle emergency mitigation, contents, containment, dry-out. The GC is named on the mitigation certificate of completion. The rebuild proposal goes out under the GC’s name with your mitigation documentation attached. Large losses are where this partnership earns most of its annual revenue — one $250,000 reconstruction with a $60,000 mitigation scope attached is worth more than twenty small kitchen-demo discoveries.

    Track all three flows in a shared ledger. When the volumes drift or the reciprocity breaks, fix it fast.


    The Ninety-Day General Contractor Partnership Program
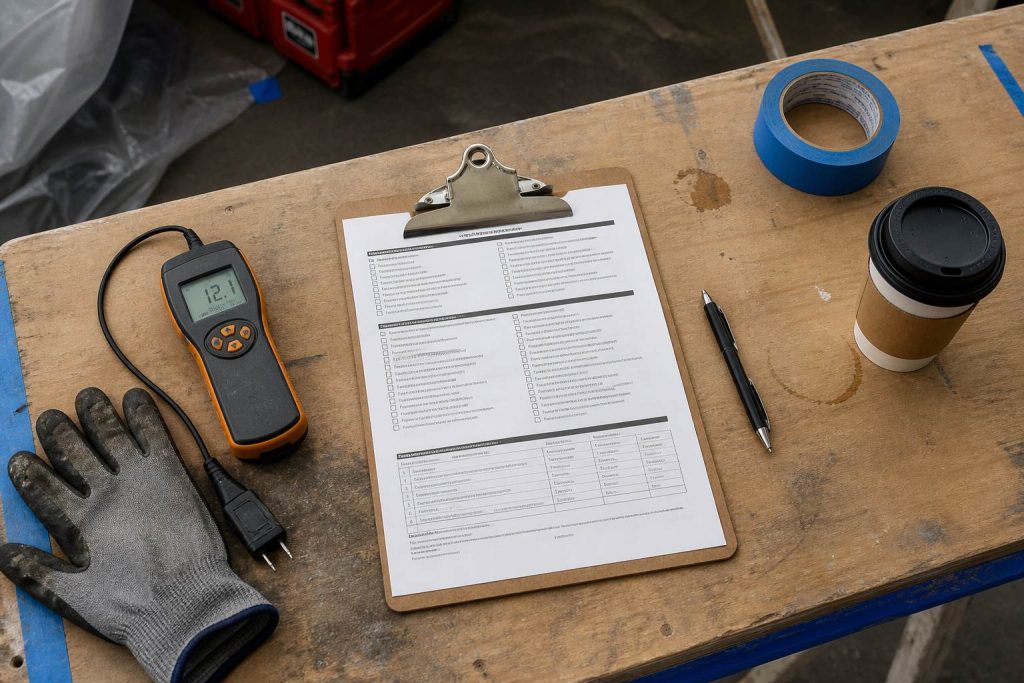
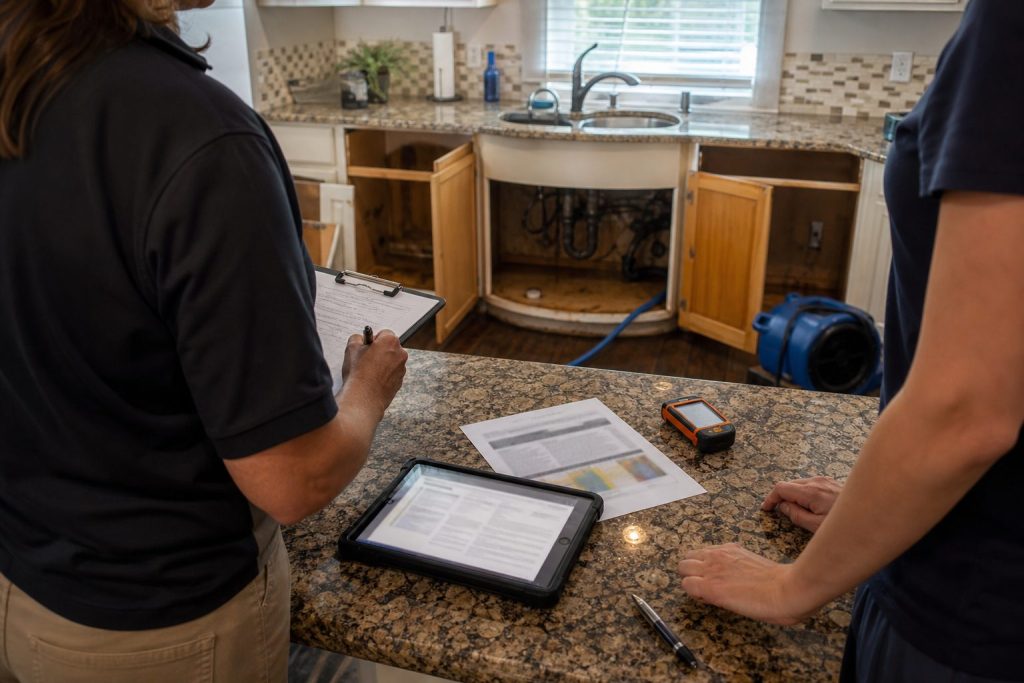
    Restoration SOP clipboard with checklist, moisture meter, and gloves on a jobsite table
    Ninety-day GC program — calibrate for scope risk.

    One GC at a time. No shortcuts. This one requires more trust-building than any of the other partner industries.

    Week 1: Target selection. Identify three to five GCs in your market who do residential remodel work in the $50,000 to $500,000 project range, have strong GBP reviews, and are clearly not insurance-rebuild specialists. Pull their portfolio. Look at their before-and-after photos for the kind of demo work that uncovers mitigation scopes.

    Week 2: Cold email to the owner, then the PM. Short. “We’re a restoration company in [market]. We only do mitigation — we don’t compete on reconstruction. We’d like to be in your change-order workflow when demo uncovers mold or water damage. Thirty minutes.” Attach your scope-lane agreement as a draft.

    Week 3: First meeting — owner and PM together if possible. Bring the scope-lane agreement, the intake protocol, a sample clearance package from a prior project, and the twenty-four-hour response commitment in writing. Ask questions about their recent projects where discovery became a problem. Listen for the horror stories — that’s your value prop.

    Week 4: Prequal file completed. Insurance certs, licenses, references, W-9, certificates of completion on a few recent jobs. Submit it as a professional document. Many GCs have never seen a restoration company fill this out completely.

    Week 5: First project. Could be a small one. Could be something the GC was going to handle in-house. Say yes, execute inside twenty-four hours, deliver a clean clearance package, hand the rebuild back with a written site walk. Do it at a margin you can defend — not a loss leader. Loss leaders tell the GC you’ll cut corners under pressure.

    Week 6: Debrief with the GC PM. Fifteen-minute call after the first project. What worked? What didn’t? What do they want done differently next time? Write the notes into your internal protocol.

    Week 7: Joint training for the GC’s lead carpenters. Thirty minutes. Show the carpenters exactly what to do when they find mold or moisture — stop work, isolate, photograph, call the GC PM, call you. Print a laminated card for their trucks. This one step will triple your referral volume over the next ninety days because the carpenters are where the discoveries happen, not the PM.

    Week 8: Second project. By now you should be naturally getting more work. Same standard: twenty-four-hour site visit, clean containment, hand-off documentation. Reciprocity flow starts here — when a homeowner calls you direct with a loss that needs rebuild, name this GC.

    Week 9: Commercial referral. Ask the GC if they have any commercial tenant-improvement projects in the pipeline. Commercial TI work is high-dollar and high-frequency for mitigation discovery.

    Week 10: Second GC opened. Repeat the program on the next target. Two to four GC partners is the sustainable max per market — more creates scope and loyalty confusion.

    Week 11: Quarterly business review cadence established. Recurring meeting every ninety days. Owner, their PM, your PM, your owner. Review projects completed, response time, client satisfaction, reciprocity volume. Adjust.

    Week 12: Co-authored content. Joint article or video for both websites. Subject: “What your remodeler should do the moment they find mold.” Durable SEO for both brands. Signals the partnership is real.

    By day ninety, you should have two GCs running a steady referral flow, a scope-lane agreement filed with each, and a track record of twenty-four-hour site visits and clean hand-offs that nobody else in your market can match.


    Where to Start This Week

    Seven actions for the next seven days:

    1. Write your scope-lane agreement before you call anyone. One page. Mitigation lane vs. reconstruction lane. Have your attorney check it.
    2. Pull the prequal file — insurance certs, licenses, references, W-9, sample clearance letter — into a single PDF.
    3. Pick the three best mid-market remodel-focused GCs in your service area.
    4. Decide which PM on your team owns GC accounts. Give them a dedicated number.
    5. Draft the cold email. Forty words. Lead with “we don’t compete on rebuild.”
    6. Build the laminated “what to do when you find mold” card for carpenter trucks.
    7. Book the first meeting.

    If you’re stuck on target selection, default to the GC with the strongest design-build portfolio in the $100,000-$300,000 residential remodel band. Those are the projects that discover mitigation work most often and have the margins to do right by you as a partner.


    Where This Article Fits in the Larger Playbook

    This is the sixth article in The Restoration Operator’s Playbook partner-industries series. The scope-lane discipline in this article builds on the observational B2B referral plan and the positioning thinking in organic asset vs paid rent. The partnership economics echo the plumber partnership article and the HVAC partnership article. For the commercial channel into which several GC referrals will flow, read the facility services partnership. For the discovery-driven trades that share the same pattern, see the carpet cleaner partnership and the pest control partnership.

    Next partner industries in the queue: property managers, adjusters, realtors, pool and spa service, roofers, appliance installers. Each will follow the same research-first, operational-truth, ninety-day-program structure.


    Frequently Asked Questions

    Should I refuse reconstruction scope entirely on GC-referred work? Yes. On work a GC refers you, the scope lane is mitigation only. You might bid reconstruction on projects the GC is not involved in — direct-to-consumer losses, insurance-rebuild work from adjuster referrals, commercial projects where the building owner hires you directly. But on anything that comes through a GC partner, the mitigation stops at clearance and the rebuild returns to them. This is the whole basis of the relationship.

    What if the homeowner specifically asks me to do the rebuild after mitigation? You tell them the truth: “We specialize in mitigation. Your GC [name] is your rebuild partner — we work with them on every project we touch at this scope, and they’ll deliver a better finish on the remodel than we would.” Then you call the GC immediately and let them know. This behavior — visible, repeatable — is what buys you the next ten referrals from that GC.

    How do I handle insurance claims on GC-referred work? Coordinate with the GC on day one. If the loss is claim-eligible, you file the mitigation documentation with the adjuster, the GC files the rebuild documentation. Both of you get paid through the claim, both of you stay in your lane. Adjuster conversations either happen with the GC on the line or with the GC cc’d on the summary email. Never cut the GC out of the adjuster channel.

    What’s a fair referral fee to a GC, and should I pay one? Most states restrict or prohibit paid referrals on insurance-funded work. On non-insurance projects (direct-pay remodels where discovery triggers mitigation), state law varies. Many restoration-GC relationships operate entirely on reciprocity — no money changes hands, each side refers the other for the lane they own. Where fees are legal and customary, $250 to $500 per closed mitigation job is a common range. Check your state’s statute and your insurance carrier’s rules before formalizing.

    How is this different from a plumber or HVAC partnership? Plumber and HVAC partnerships carry almost no scope-overlap risk — they stop at the fixture or equipment, you handle everything else. GC partnerships carry real scope-overlap risk — you both could handle reconstruction if the relationship isn’t explicitly lane-gated. The upside is larger: a single GC with a strong remodel book can produce more annual mitigation volume than a plumbing partnership because their techs are literally opening walls four or five days a week. The downside is bigger too: one scope-lane violation kills the relationship permanently.

    What if the GC already has a restoration partner? Almost every quality GC has a name they call in emergencies. The real question is whether that incumbent partner has a scope-lane agreement in writing, a twenty-four-hour site visit commitment, a documented prequal file, a dedicated PM on the account, and a written hand-off protocol. Most don’t. Your competitive move is professionalism at the operational layer — arrive with the whole stack assembled, do better work on the first project, and let the GC make the natural switch. In many cases you’ll earn the secondary slot first and the primary slot within two quarters as the incumbent fails to match your response time.
  • Selling Into Pest Control: The Recurring-Revenue Trade That Sees Moisture Before Anyone Else

    Selling Into Pest Control: The Recurring-Revenue Trade That Sees Moisture Before Anyone Else

    Direct answer: Pest control is one of the most strategically valuable restoration partners because it runs on recurring quarterly routes — meaning the same technician is inside the same customer’s attic, crawl space, and wall voids four times a year. They find rodent entry points, standing water, elevated humidity, vapor-barrier failures, and early mold growth before the homeowner ever calls anyone. The restoration company that builds a real relationship with the route manager — not a flyer drop to the front desk — gets named when the tech writes up “moisture damage, recommend specialist” on a service ticket. That’s the channel. Most restoration owners never work it.

    Every restoration owner has a referral wishlist. Plumbers. HVAC. Property managers. Adjusters. Almost nobody has pest control at the top of that list — and that’s exactly why it’s one of the highest-leverage channels available to a restoration company in 2026.

    Pest control is different from every other trade we’ve covered in this series. It’s not event-driven like plumbing. It’s not equipment-driven like HVAC. It’s not volume-contract-driven like Cintas. It’s a subscription business. The technician is inside the same house four times a year, on a route, looking for conditions that create pest activity — which are exactly the conditions that create restoration work.

    This article teaches you how pest control companies actually make money, why their technicians see moisture damage earlier than anyone in the chain, why most restoration companies fumble this channel with the wrong approach, and the specific ninety-day program that turns a regional pest control operation into a predictable referral stream. No fluff, no templates, no Chamber-of-Commerce advice. This is the operational view.


    How a Pest Control Company Actually Makes Money

    If you want to earn the trust of a pest control owner or operations manager, you have to understand their economics before you walk in the door. Pest control is not a trade — it’s a recurring-revenue subscription business wearing trade clothing.

    The revenue mix. A healthy residential-focused pest control company runs roughly 80–85 percent recurring revenue and 15–20 percent one-time or initial treatments. That’s the benchmark buyers and private equity roll-ups look for when acquiring pest operators. The industry standard is quarterly service — four visits per year — with monthly service priced between $45 and $75 per visit and quarterly service priced between $100 and $300 per visit. Initial intensive treatments are priced higher, typically $150 to $300, and act as the onboarding step that locks the customer into the recurring plan.

    The margin structure. Gross margins are strong. Established pest control operations run 60–80 percent gross margin on service. EBITDA margins land between 15 and 20 percent for well-run independents — the three largest national players reported 15.7 to 19.5 percent operating margins in the most recent IBISWorld data. Commercial accounts carry lower cancellation rates than residential and generally command higher per-visit pricing, but residential is where route density and customer lifetime value live.

    What a customer is actually worth. A residential pest customer acquired in 2026 represents $1,200 to $3,000 in lifetime value across the first few years. High-performing technicians generate $150,000 to $200,000 in annual revenue per route. Average pest control business revenue sits around $401,900. Those numbers matter because they tell you exactly why pest owners protect their routes and why your pitch to them has to respect the route, not disrupt it.

    The operational engine. Route density is the entire game. A tech runs eight to fourteen stops per day depending on market and service mix. They are paid on productivity — commission, revenue share, or per-stop — and their behavior is governed by the software on their phone. FieldRoutes, PestPac, GorillaDesk, Briostack, and a handful of others run the industry. Every note the tech types, every photo they attach to a stop, every upsell they flag goes into the CRM. That CRM is where your name has to end up if you want to be the restoration company that gets called.


    How Pest Control Companies Acquire Customers

    Understanding how pest control sells tells you where they value you — and where they don’t.

    Door-to-door is still the dominant acquisition channel. Summer sales crews (Aptive, Moxie, Fairway, regional equivalents) knock hundreds of doors a day in target neighborhoods during spring and summer. The cost per acquired customer is high, but the recurring revenue justifies it over eighteen to thirty-six months. Independent operators supplement with route-density bolt-ons — buying smaller routes from retiring owner-operators or competitors.

    Organic and paid search. Pest control is one of the highest-CPC verticals in local services. “Exterminator near me” and specific pest terms (“bed bug removal,” “termite inspection,” “rodent exclusion”) can run $25 to $60 per click in competitive markets. Google LSA (Local Services Ads) and GBP reviews drive the top of the local pack. The best independents treat reviews as the leading indicator — every tech is trained to ask for the review at the end of the stop.

    Commercial sales teams. Commercial pest control is a dedicated B2B operation. A commercial account manager calls on restaurants, food-processing facilities, healthcare, property management, hospitality, and warehousing. These accounts are won on responsiveness, pest log documentation for health inspections, and the ability to pass FDA and AIB audits. Monthly commercial contracts range from $100 to $2,000+ depending on facility size and pest pressure.

    Referral programs. Most pest control companies run customer-to-customer referral programs offering $25 to $75 in account credit or a free service for a successful referral. They work — but the referrals are limited to the customer’s personal network. What’s missing in almost every pest company referral stack is a deliberate, documented cross-trade referral relationship. That’s the gap.

    The takeaway: pest control spends real money to acquire each customer and works hard to retain them on a route. Anything you bring them that protects their customer, saves the tech time, or generates incremental revenue on the same route is valuable. Anything that disrupts the route or creates liability they didn’t ask for is disposable.


    Why Pest Control Technicians See Restoration Work Before Anyone Else

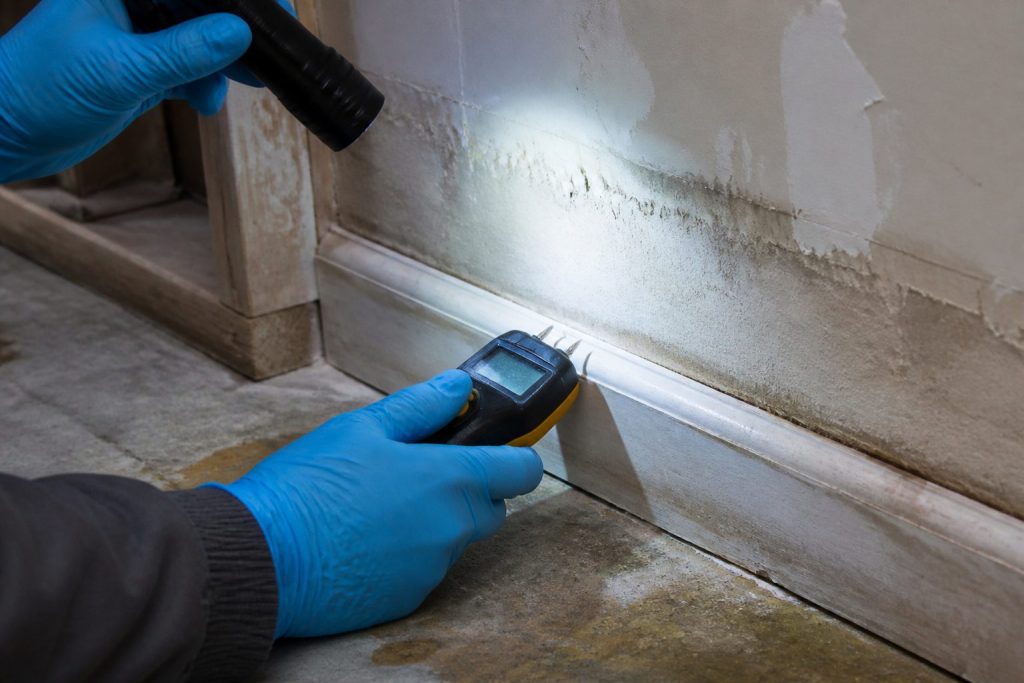
    Gloved hands using a pin-type moisture meter on wet drywall during inspection
    Pest techs see moisture and soft wood before anyone else.

    This is the single most important section of this article, and the one most restoration owners have never thought carefully about.

    A pest technician’s job, every single stop, is to find and document conditions that support pest activity. Those conditions are — almost line for line — the conditions that produce restoration claims.

    The attic inspection. The tech goes up into the attic four times a year. They’re looking for rodent droppings, nesting material, and chew damage on wiring. What they also see: compressed or soaked insulation, water staining on the underside of the roof deck, bath fan exhaust venting into the attic instead of out the roof, dark mold colonies on sheathing, flex duct separated from the supply boot. They document all of it with photos in their route software.

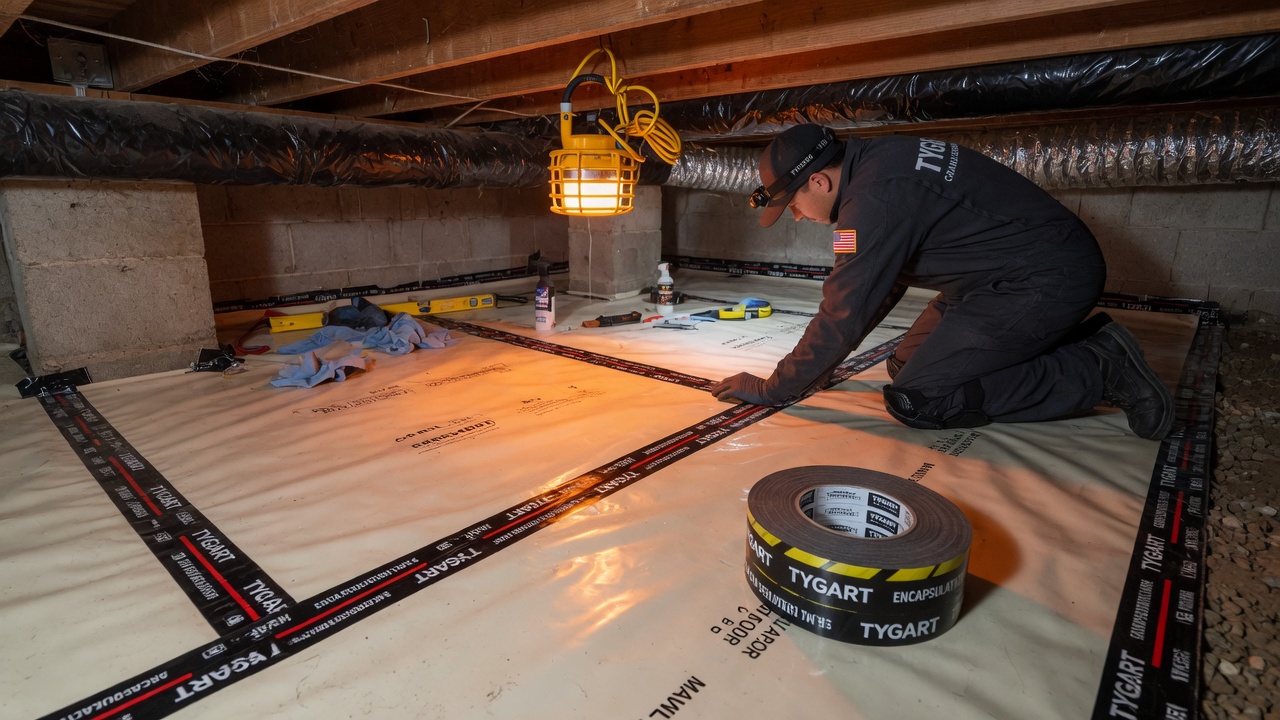
    The crawl space inspection. Quarterly crawl inspections are standard for termite and rodent programs in most of the country. The tech sees failed vapor barriers, standing water, wet subfloor insulation, efflorescence on foundation walls, rusted duct strapping, and visible microbial growth on floor joists long before the homeowner does. In many markets, pest companies sell their own vapor-barrier and encapsulation services as an upsell on these findings — which means their techs are already trained to spot moisture.

    The exterior and roofline walk. Every route stop includes an exterior walk to check bait stations, identify entry points, and look for conducive conditions. The tech sees missing soffit returns, gaps at fascia, failed flashing at roof-wall intersections, downspouts dumping against the foundation, grading issues, and rotted trim. All of those are restoration precursors.

    The interior stop. If the service includes interior treatment, the tech is in kitchens, bathrooms, laundry rooms, and utility closets. They see active leaks under sinks, corroded supply lines, water-stained drywall behind toilets, damp baseboards, and musty odors the homeowner has stopped noticing.

    The commercial stop. A commercial pest tech servicing a restaurant or food-processing facility is inside the dish pit, the walk-in, the mop closet, and the dock dumpster area — all the zones that produce the most restoration events. They’re there monthly or weekly. They see slow leaks before the facility manager notices them.

    The result: pest control technicians are quietly one of the most accurate early-warning systems for water intrusion, mold, and structural moisture issues in residential and commercial property. They see it before the homeowner calls a plumber, before the HVAC company shows up for a service call, before the adjuster is ever notified. And they see it on a repeating calendar — not just once.

    Most pest control companies do not have a formal restoration referral partner. The tech writes “recommend specialist” on the ticket, the homeowner Googles, and the job goes to the first brand with the best reviews. That’s the gap you’re closing.


    Why Pest Control Wants a Restoration Partner (And Where the Referrals Actually Flow)

    A well-run pest control company benefits from a named restoration partner in six concrete ways:

    1. Liability off-loading. When a tech finds mold or standing water, the company has two choices: say nothing and risk the customer later claiming the tech missed an obvious problem, or document the finding and refer them to a specialist. Naming a trusted restoration partner on the ticket protects the pest company. They want that partner to be one phone call, not a search result.

    2. Incremental revenue on moisture upsells. Many pest companies sell their own exclusion, crawl-space encapsulation, and vapor-barrier work. They don’t want to do IICRC-level water mitigation, mold remediation, or reconstruction. Partnering with a restoration company that won’t compete on pest control or crawl-space upsells — and that will complete projects the pest company can’t — lets them offer a fuller solution without expanding their own scope.

    3. Customer retention. Customers who have a bad experience with a finding on their property — mold discovered, no path forward offered — churn off recurring plans. Customers who are handed a trusted name and a warm introduction retain. The pest company’s quarterly revenue from that customer is worth $400 to $1,200 a year; protecting the account is worth more than any single referral fee.

    4. Two-way referral flow. Restoration customers with chronic moisture, rodent entry, or termite issues need an ongoing pest partner. That flow is as valuable going the other direction as it is coming in.

    5. Co-marketing leverage. Joint educational content (“What your quarterly pest inspection reveals about your home’s moisture health”) drives traffic for both brands. Pest companies with strong reviews and GBP real estate are excellent co-authors.

    6. Route-level documentation pipeline. If you can become a “one-click referral” inside their CRM workflow, the tech doesn’t even have to remember your name. They tap the button, the office sends you a lead, you handle it in twenty-four hours, everyone wins.

    The referrals do not flow from the owner handing you his Rolodex. They flow from the tech tapping a button in FieldRoutes or PestPac after a stop. Your entire strategy has to be designed around that moment.


    The Six Restoration-Discovery Moments on a Pest Control Route

    White restoration work van with ladder rack parked at a suburban jobsite curb
    Six discovery moments on a pest-control route.

    Here’s where restoration enters the picture on a pest technician’s day. Learn these moments cold — they are the entire basis of the partnership.

    Moment 1: The attic rodent sign stop. Tech is sent out for a rodent issue. They enter the attic, find droppings, and also find compressed wet insulation under a roof leak, mold colonies on sheathing, or bath fans venting into the attic. Restoration is called for mold remediation and insulation replacement. This is one of the highest-frequency discovery moments in the entire industry.

    Moment 2: The crawl space quarterly. Quarterly termite and general pest inspections routinely uncover standing water, failed sump pumps, efflorescence, microbial growth on joists, and vapor-barrier failures. Restoration is called for mold remediation and dry-out. In markets with wet climates, this is a week-in, week-out discovery.

    Moment 3: The exclusion walk. Exclusion work (sealing entry points for rodents, bats, squirrels) puts the tech on ladders against the roofline and siding. They see flashing failures, rotted fascia, and roof leaks that the homeowner hasn’t noticed. Restoration gets called for water damage remediation and reconstruction.

    Moment 4: The bed bug or cockroach interior stop. Heavy interior infestations require detailed inspection in kitchens and bathrooms. Active leaks under sinks, damaged cabinet floors from slow drips, and water-stained walls behind toilets get noticed. These are small jobs individually and steady volume collectively.

    Moment 5: The commercial account service visit. Monthly or weekly commercial service at restaurants, food-processing, and healthcare facilities uncovers slow leaks and condensation problems that the facility manager hasn’t logged. These referrals are the highest-dollar on the list because commercial scopes are larger and more frequent.

    Moment 6: The termite WDI inspection. Wood-destroying insect inspections for real estate transactions routinely identify active moisture, fungal decay, and conditions that trigger restoration scopes before closing. These are time-pressured and high-value — the buyer, seller, realtor, and lender all want it resolved in two weeks.

    Build your joint training around these six moments. Every reciprocity agreement, ticket flag, and referral script should map to one of them.


    Why Most Restoration-to-Pest-Control Partnerships Fail

    Restoration companies have tried to work this channel before and wasted cycles on it. Here are the six failure modes.

    1. Pitching the owner with generic “partnership” language. The pest control owner has heard every version of “let’s refer each other” from every service trade in the market. Your first meeting cannot be an ask. It has to be a demonstration of how you understand the route, the tech’s workload, and the CRM flow.

    2. Competing on crawl-space or attic exclusion work. If your restoration company sells crawl-space encapsulation, vapor barrier replacement, or rodent exclusion as an upsell, you are a competitor to the pest control company, not a partner. You have to take those scopes off the table or carve clear lanes. A pest company will never refer work to a restorer they see poaching their upsells.

    3. Trying to get in front of techs without getting the ops manager first. Techs are on routes. They don’t sit in the office for a pitch. The decision to add your name to the “refer out to” list is made by the operations manager or route manager. That’s your first meeting, not the owner and not the techs.

    4. Slow follow-up on the first few referrals. The first three referrals the pest company sends you are a test. If you respond in four hours, you pass. If you respond the next day, you fail. The route manager will quietly stop naming you.

    5. Not closing the reciprocity loop. Restoration companies are notorious for receiving referrals and never sending any back. Pest control owners notice. Within sixty days of getting your first pest referral, you should have documented at least one outbound referral the other direction.

    6. Treating the relationship as one owner-to-owner handshake. The relationship with the owner gets the program started. The relationship with the route manager, the ops manager, and the dispatcher keeps it going. If you’re only calling the owner, the referrals dry up the month after your coffee meeting.


    Ten Operational Disciplines for a Pest Control Referral Channel That Works

    If you want pest control to become a reliable referral flow rather than a one-time introduction, run the channel with the same rigor you run production.

    1. Respect the route economics. Every minute a tech spends talking about your company is a minute they’re not producing revenue. Your entire communication stack — training, collateral, CRM integration — has to save them time, not cost them time.

    2. Anchor to the ops manager, not the owner. The ops manager decides whose name goes on the “refer out to” list in the CRM. That’s your primary relationship. The owner approves the program; the ops manager runs it.

    3. Provide a single trained contact with a direct line. Pest techs and ops managers should have one human name, one cell number, one email. If they get a different person every time they call, you lose the account.

    4. Build a two-way “discovery flag” cheat sheet. One-page laminated card for the truck. One side: “When to call [Your Restoration Company]” — the six restoration-discovery moments. Other side: “When to call [Pest Company]” — mold jobs with active pest activity, rodent-related insulation removals, commercial food-facility pest logs. The card lives in the truck, not the office.

    5. Integrate with their CRM workflow if possible. Ask the ops manager how referrals are currently routed out. Offer to set up a dedicated email inbox or Zapier hook that receives their outbound referrals automatically from FieldRoutes or PestPac. Speed of intake is the single biggest quality signal you can send.

    6. Twenty-four hour response, four-hour ideal. When the pest company sends you a lead, your first contact with the homeowner should be within four hours on the same day. The ops manager will hear about any delay from the customer.

    7. Close the loop in writing. Every referral gets a reply to the pest company: acknowledgment within an hour, status update at the site visit, outcome when the job closes. This is the single behavior that distinguishes a real partner from a vendor.

    8. Reciprocity ledger. Track referrals both directions in a shared document. If they’ve sent you eight and you’ve sent them one, that’s a problem you can see before it becomes a conversation.

    9. Quarterly joint training. A thirty-minute virtual training every quarter — restoration tech walks through moisture signs, pest tech walks through what their findings mean. Both sides leave smarter. Pest companies that have never done this will often say yes immediately because it’s genuinely useful for their team.

    10. Pay the fee if it’s on the table. Referral fees vary by state and scope — some states restrict paid referrals on insurance-funded work. Where fees are legal, a $100 to $300 named referral fee per closed restoration job is standard and worth paying. Where fees aren’t, substitute reciprocal marketing, co-branded content, or annual account-based appreciation.


    The Two-Way Reciprocity Model (And Why It Has to Be Explicit)

    Restoration SOP clipboard with checklist, moisture meter, and gloves on a jobsite table
    Two-way reciprocity has to be explicit — or the channel dies.

    The single most common reason pest-restoration partnerships fail is that reciprocity is assumed and never designed. Here’s the explicit model.

    Flow 1: Pest control → restoration. Tech finds one of the six discovery moments. They tap the referral button in the CRM or text the ops manager. Ops manager sends the lead to your dedicated intake. You contact the homeowner within four hours. The pest company is named as the source. The pest company sees the status of the referral close out. This is the core flow.

    Flow 2: Restoration → pest control. Your project manager is on a mold remediation job and finds active rodent droppings, termite galleries in a framing inspection, or a chronic roach problem in a commercial kitchen. You name the pest company on the ticket, hand the homeowner the partner’s card, text the ops manager, and introduce them by email. The pest company picks up the lead within four hours. You see the status close out.

    Flow 3: Restoration → every customer, pest partner named by default. This is the move most restoration companies miss. On every closed job, the homeowner or facility gets a small printed leave-behind naming the pest control partner with a specific call-to-action: “We’ve completed your remediation. Ongoing pest and moisture monitoring is essential to protect the repair. Call [Pest Partner] at [number] to schedule your inspection. Mention [Your Restoration Company] for [offer].” This produces a far greater referral volume out of your pipeline than anyone else’s, which balances the ledger fast and makes you the partner other trades can’t match.

    Document all three flows. Review the numbers quarterly with the pest ops manager. When the volumes drift, fix the drift before it becomes silence.


    The Ninety-Day Pest Control Partnership Program

    Here’s the exact program. Copy it. Run it on one pest control company at a time in your market. Don’t try to boil the ocean.

    Week 1: Target selection. Identify the two or three pest control companies in your service area with the strongest GBP review profile, the most routes, and the deepest commercial book. Ignore the national franchises whose referral routing is centralized at corporate — go for regional independents with 4 to 40 trucks.

    Week 2: Ops manager meeting. Skip the owner for now. Call the office, ask to speak with the operations or route manager. Short email prior: “We’re a restoration company in [market], I want to learn about your referral program and show you a few things we’ve built for pest partners. Thirty minutes at your office.” Bring the laminated discovery-flag card as a draft.

    Week 3: Co-designed intake flow. Spend an hour with the ops manager designing the intake process. Dedicated email, dedicated number, response-time commitment in writing. Align it to how their CRM exports referrals.

    Week 4: Tech ride-along. Ask to ride with a senior tech for a half-day. You’ll see exactly what they see. You’ll also earn credibility with the tech corps — no restoration owner has ever asked to ride with them, and the story will travel.

    Week 5: Thirty-minute virtual joint training. Your project manager presents to their team on the six discovery moments with real photos. Their lead tech presents to your team on when to spot pest indicators during mold and water jobs. Record it. Reuse the recording for onboarding.

    Week 6: First referrals flow. Expect three to five in the first two weeks. Respond inside four hours on every one. Document status at each step. Reply to the ops manager when each closes.

    Week 7: Restoration-to-pest leave-behind deployed. The printed card, QR code, or branded magnet is now on every job close. Track leads sent.

    Week 8: Commercial introduction. Ask the ops manager to introduce you to their commercial account manager. The commercial book is where the highest-dollar referrals live.

    Week 9: Owner meeting (finally). By now you have referral volume and response-time data. Owner meeting is short: here’s what we’ve done, here’s the reciprocity ledger, here’s the plan for the next quarter. The owner approves expansion.

    Week 10: Quarterly business review cadence established. Put a recurring quarterly meeting on the calendar — ops manager, their commercial manager, your intake lead, your project manager. Review volume, response time, win rate, and the reciprocity ledger. Adjust.

    Week 11: Co-authored content piece. One joint article or one video published to both companies’ sites, both GBPs, and both social channels. Subject: what a quarterly pest inspection reveals about your home’s moisture health. This earns durable SEO and tells the market the partnership is real.

    Week 12: Second pest company opened. Only now. Repeat the program on the next target. Do not try to run more than two pest partners per market simultaneously — the confusion on which referral goes where will erode both relationships.

    By day ninety, you have documented volume, a repeatable intake workflow, a trained tech corps that knows your name, and reciprocity numbers that will earn you the second and third pest company in the market.


    Where to Start This Week

    If you’re reading this and want to actually move on it, here’s the action list for the next seven days:

    1. Pick one pest control company in your market. Pull their GBP — review count, rating, response rate.
    2. Write a forty-word cold email to the ops manager. Not the owner.
    3. Build the laminated two-sided flag card before the meeting.
    4. Decide internally who inside your company owns pest-partner intake. Give them a dedicated number.
    5. Draft the restoration-to-pest leave-behind card.
    6. Decide the referral fee structure (or non-fee substitute) before you sit down.
    7. Book the meeting.

    Do all seven before the weekend. If you’re stuck on step one — the target — default to the pest company in your market with the strongest commercial book. Their route economics and their facility-manager relationships are the highest-leverage entry point you can possibly find.


    Where This Article Fits in the Larger Playbook

    This is the fifth article in The Restoration Operator’s Playbook partner-industries series. It builds directly on the discipline of the observational B2B referral plan, the cadence in the owner-as-rainmaker system, and the reciprocity-first posture in reviews and staff compensation. It pairs naturally with the plumber partnership article, the HVAC partnership article, the facility services partnership, and the carpet cleaner partnership. If you’re mapping the full channel strategy, reread marketing signals beyond leads and organic asset vs paid rent to see how partner-channel volume compounds with organic content over time.

    The next partner industries already in the queue: general contractors, property managers, adjusters, realtors, pool and spa service, roofers, and appliance installers. Each one gets the same treatment — research first, operational truth second, ninety-day program third.


    Frequently Asked Questions

    Do pest control companies actually refer restoration work, or is this theoretical? They refer it constantly. The question is whether it’s a deliberate channel or a coin flip. Techs already write “recommend specialist” on tickets where they find mold, moisture, or chronic water intrusion. The referral goes to whoever the homeowner Googles next unless your name is on the pest company’s “refer out to” list and in their CRM workflow. The channel exists. Most restoration companies just don’t claim it.

    How much volume can I realistically expect from one pest control partner? A regional independent pest company with 10 to 20 techs running quarterly residential and monthly commercial routes can generate 15 to 40 qualified restoration referrals per year once the program is running. Bigger regional operations with commercial books can do materially more. The first ninety days will feel light; volume compounds quarter-over-quarter as the tech corps builds familiarity with your name.

    Should I pay a referral fee? Where state law allows it on non-insurance work, yes — a named referral fee of $100 to $300 per closed restoration job is standard and worth paying. On insurance-funded work, check your state’s specific rules; many states restrict or prohibit paid referrals on insurance claims. Where fees aren’t viable, substitute reciprocal marketing, co-branded content, and a consistent flow of outbound referrals the other direction.

    What’s the biggest mistake restoration owners make approaching pest control companies? Pitching the owner first and selling a generic partnership. The owner is not your first meeting — the operations manager is. And the first meeting is not a pitch, it’s a working session on how their CRM routes outbound referrals and how your intake desk can plug in. Come with the discovery-flag card already drafted. Every minute you save the tech and the ops manager is a minute they’ll return in referrals.

    How is this different from a plumber or HVAC partnership? Plumbers and HVAC techs see the customer during an event or a service call — episodic. Pest control sees the customer on a recurring quarterly or monthly route — predictable. The partnership mechanics are similar; the difference is that a pest company’s value is its route density and its CRM, and your program has to be designed to ride that route rather than interrupt it. Pest also carries less scope-overlap risk than HVAC or plumbing (no shared revenue lines on water mitigation) and more scope-overlap risk than carpet cleaning or Cintas (crawl-space and exclusion upsells), which means your lane agreement matters more at the start.

    What if the pest control company already has a restoration partner? Many do — loosely. Almost none have a documented two-way flow, a tech-trained discovery-flag card, a four-hour response commitment, and a quarterly business review. Your competitive move is professionalism at the operational layer. Ask the ops manager what’s working and what isn’t about their current partner. Build a better program. In many cases you’ll be added as the second partner before you replace the first — and the reciprocity volume coming from your side will decide the outcome within two quarters.

  • Plumber Referrals: How Restoration Companies Win Leads

    Plumber Referrals: How Restoration Companies Win Leads

    How does a restoration company build a real referral relationship with plumbers? By understanding how plumbers actually run their business — flat-rate pricing, speed-to-lead discipline, service-call economics, and the commercial account book they protect fiercely — and by becoming an asset to that business rather than a transaction on top of it. The restoration companies that dominate plumber referrals are the ones that respond faster than the plumber’s own office, document the job in a way that makes the plumber look good to the homeowner, never compete on plumbing scope, and offer the plumber something the competing restorers don’t — typically fast arrival, clean handoff paperwork, a consistent named point of contact, and straight-up reciprocity in the form of plumbing referrals back from the restoration company’s own job flow.


    There is no referral source more valuable to a restoration company than a good plumber. The math is obvious. Plumbers are first on scene at the majority of residential water losses. They are the person the homeowner is already talking to at the exact moment the restoration decision gets made. A plumber who trusts you is worth ten lead-form submissions and the cost of a Local Services Ads subscription combined.

    And yet most restoration companies handle plumber relationships poorly. They walk into plumbing shops with business cards and pizza and a gift card program. They call it “relationship building.” It is not. It is a low-quality sales motion aimed at a business the restorer does not actually understand.

    This article is the antidote. It is how plumbing companies actually make money, how they think, what they protect, and where a restoration company with discipline plugs in to become the plumber’s trusted partner rather than the tenth restoration card on a cluttered desk. The same framework applies to the rest of the trade ecosystem we will cover — HVAC, facilities vendors, carpet cleaners, pest control, property managers, general contractors — but plumbing is the place to start because the volume is there and the operational overlap is tightest.

    How Plumbing Companies Make Money

    White restoration work van with ladder rack parked at a suburban jobsite curb
    The plumber is already on the curb when the water loss starts.

    Before you sell into a plumber, understand where their profit actually comes from. A modern residential plumbing operation runs on a clear pricing and margin stack.

    Flat-rate pricing has become the industry standard for established plumbing companies. A modern shop prices most residential jobs — drain clearing, toilet installs, water heater swaps, fixture replacements, standard repairs — as fixed fees out of a price book rather than hourly. The benefits are obvious: the homeowner gets a predictable number, the tech closes faster at the kitchen table, and the margin is protected against jobs that drag on.

    Hourly billing still exists, mostly for diagnostics, commercial time-and-materials work, and jobs where the scope is genuinely uncertain (slab leaks, multi-fixture failures, old-pipe situations where every valve is a surprise). Most residential plumber hourly rates fall between $80 and $130 per hour, with some premium markets higher. Service-call fees — the trip-and-diagnostic charge a plumber collects just for arriving — typically run $50 to $250 depending on market and time of day.

    Gross margin targets are structural. A well-run plumbing company runs 60 to 62 percent gross margin on service and repair work, with net margins in the 10 to 20 percent range. Underperformers are at 2 to 8 percent net. The difference is almost entirely operational discipline — flat-rate pricing discipline, dispatch efficiency, call-booking rate, labor as a percentage of revenue.

    Labor is the dominant cost, typically 40 to 60 percent of operating expenses. Every minute a tech is not in front of a paying customer is a minute of unrecovered fixed cost. This matters to a restoration company because it tells you exactly what the plumber values most: technician time.

    The job mix separates the healthy from the struggling. Service and repair — single-tech, high-ticket, fast-turn — runs the 50 to 60-plus percent gross margin that carries the company. New construction and larger remodels run 20 to 30 percent and are often loss-leaders on labor utilization. The plumbing companies that are growing fast and buying competitors are running service-and-repair-heavy books with strong flat-rate pricing and disciplined dispatch.

    This is the business you are calling on. When you walk in, you are walking into an operation where every non-revenue minute is a tax on the P&L.

    How Plumbing Companies Acquire Customers

    Understanding the lead flow tells you where you sit in their world.

    Google Business Profile is the single most important acquisition channel for most residential plumbing companies — identical to the restoration playbook. A well-run GBP, paired with aggressive review velocity, produces the majority of a residential plumber’s organic lead flow at effectively zero marginal cost.

    Google Local Services Ads sit at the top of the paid stack. LSA leads for plumbers typically run $25 to $85 per lead at 40 to 65 percent conversion, for an effective $38 to $213 per booked job. Like restoration, LSA ranking is driven by review signals and response time. A plumber with a weak review foundation cannot win LSA.

    Shared marketplace leads — the Angi and HomeAdvisor category — run $15 to $50 per lead at 8 to 12 percent conversion, producing $125 to $625 effective cost per job. Most plumbing operators treat these as a fill-the-gap channel rather than a core source.

    Past-customer reactivation is the compounding layer. SMS reactivation of past customers costs less than a dollar per broadcast and typically produces 8 to 15 percent booking rates. Every plumber who has been in business five years is sitting on an underutilized database.

    Referral programs fund a meaningful slice of the book at $25 to $50 per acquired customer in incentives.

    Here is the industry’s consensus #1 tactical lever: speed to lead. Responding to a lead in under 60 seconds converts at roughly four times the rate of slower responses. This is why a plumber obsesses over dispatch tools like ServiceTitan, Housecall Pro, and FieldPulse, and why 24/7 answering services and AI receptionists have proliferated in the category. Every second matters.

    The implication for a restoration company courting that plumber: you are being evaluated against the same standard. If you cannot respond to a plumber’s referral in under 60 seconds, you are losing to the restoration shop that can. This is not a nice-to-have. It is the single largest predictor of whether a plumber will keep sending you leads after the first one.

    The Plumber’s Commercial Book

    Residential service drives most of the volume in a typical plumbing operation, but the commercial book is what makes the business valuable at exit. Property management companies, facilities vendors, retail operators, HOAs, and industrial property owners operate on vendor contracts and scheduled maintenance programs. They produce lower per-ticket margin than residential service calls but dramatically higher revenue predictability and customer lifetime value.

    The property manager who finds a reliable, documented, certificate-of-insurance-compliant plumbing vendor rarely switches. That retention is what turns a $2M plumbing company into a $10M plumbing company over a decade. It is also the piece most small plumbing operators protect most aggressively — because losing a commercial account is a severed artery, not a lost ticket.

    For a restoration company, this matters in two ways. First, a plumber who trusts you will open their commercial book to you when those properties have water losses — because the plumber’s reputation is now attached to yours, and they are not going to introduce you to their best customer unless you can execute perfectly. Second, your own commercial book is the most valuable thing you can offer a plumber in return. The restoration companies that build deep plumber partnerships typically have their own commercial relationships that refer plumbing work downstream — and a disciplined restorer puts those referrals through their plumber partners intentionally, tracks the flow, and makes sure the value is visible.

    Reciprocity in the commercial channel is the highest-leverage thing a restoration company can offer a plumber. Nothing else you do comes close.

    How a Plumber Thinks About a Water Loss

    Clipboard and tablet on a kitchen counter during an insurance adjuster walkthrough after water loss
    How a plumber thinks about a water loss — speed, liability, handoff.

    Now zoom into the moment that matters: the plumber is on site. Pipe has burst. Homeowner is standing in two inches of water. The plumber’s job, strictly, is to shut off the supply, diagnose the failure, repair or replace, and get out. Mitigation and drying are outside their scope and outside their certification.

    In that moment the plumber has three options.

    Option one: ignore it. Let the homeowner figure out the water damage themselves. Give them a generic “you’ll want to call a restoration company” and leave. This is what most plumbers actually do, because it is zero risk and zero effort.

    Option two: recommend whoever the homeowner has already tried to call, even if that restoration company is unfamiliar. Low risk, low value, no upside.

    Option three: make a trusted referral. Pull out their phone, call the restoration company they know personally, hand the phone to the homeowner. The restoration crew arrives before the plumber has finished their paperwork. The homeowner feels taken care of. The plumber looks like a full-service problem-solver rather than someone who created a problem and left.

    Option three is the one that matters. It is also the one that requires the restoration company to have earned the trust to be the plumber’s one call.

    Earning that call is what this article is about.

    Why Most Restoration-Plumber Relationships Fail

    The trade press is full of plumbers complaining about restoration companies. The complaints cluster into a predictable set.

    Promised referral fees never arrive. A restoration company makes a big show of the referral program, then the plumber sends a lead, and the check is either late, wrong, or missing entirely. Once burnt, the plumber stops sending leads and never tells the restorer why. The restorer blames their own marketing. The real cause is a broken promise the plumber made mental note of and walked away from.

    Slow response after the referral. The plumber hands off the homeowner, expects a truck on site within the hour, and the restoration crew shows up the next morning. The plumber looks bad. The plumber does not send a second lead.

    Overlap creep. The restoration company starts doing water heater replacements, pipe repairs, or other scope the plumber considers theirs. The plumber, correctly, stops referring to the company that is competing with them.

    Transactional over relational. The restorer drops by every month with business cards and a bag of swag, asks “any jobs this month?”, and never demonstrates any interest in the plumbing business itself. Plumbers read this the way everyone reads it — as a vendor trying to extract leads without offering anything in return.

    One-directional flow. The plumber sends water losses. The restoration company sends nothing back. A year in, the plumber calculates the relationship and realizes the restorer has taken dozens of high-ticket insurance jobs and returned effectively nothing. The relationship is dropped for a competitor who understands reciprocity.

    No co-branding of the homeowner experience. The restoration company shows up, does the work, and the homeowner ends up viewing the plumber as “the guy who recommended this crew” — a connector, not a savior. A sophisticated restorer makes a point of telling the homeowner, in the presence of the plumber, that the plumber caught the problem early and protected the home from far worse damage. That small discipline produces the story the plumber tells for the next six months.

    Inconsistency. The restoration company is great on the first three jobs, slips on the fourth, misses a callback on the fifth, and the plumber’s trust decays without the restorer ever knowing.

    Every one of these is fixable. Every one of these is the reason most restoration-plumber relationships never compound.

    What the Best Restoration Companies Actually Do

    A restoration operator with intention can build plumber partnerships that are durable, compounding, and unreachable by competitors. The playbook is specific.

    Respond faster than the plumber’s own dispatch. When a plumber calls to refer a loss, the target is truck rolling within 15 minutes and on site within 45. The plumber’s tech, still on site, calls their own office and the office quotes a 90-minute window for the next plumbing job — and the restoration crew has already arrived. That single data point, experienced twice, will make the restorer the plumber’s default for the next decade.

    Arrive in a way that makes the plumber look good to the homeowner. The lead restoration tech introduces themselves, acknowledges the plumber by name, explicitly credits the plumber for catching the problem early, and explains what happens next. This takes sixty seconds and produces outsized returns in the plumber’s willingness to call again.

    Never encroach on plumbing scope. The restoration company’s role is water mitigation, drying, demo, and rebuild scope outside the plumbing trade. Anything inside the plumbing trade — fixture replacements, pipe work, water heater installs, drain clearing — is not your business. Routinely declining to take that work when homeowners ask, and actively referring it back to the plumber partner, is a trust-building act that plumbers notice and remember.

    Co-brand the documentation. The mitigation paperwork the homeowner receives should reference the plumber who made the initial diagnosis and repair. The plumber’s contribution becomes part of the record. Insurance adjusters see the plumber’s name. Homeowners see the plumber’s name. The plumber becomes more valuable in the eyes of the people they rely on, and knows the restoration company is the reason.

    Send plumbing leads back. This is the most underused discipline in the restoration-plumber relationship. Every restoration company is sitting on customer flow — past customers, current mitigation jobs, commercial property managers — that periodically needs plumbing work. Route that flow to partner plumbers intentionally. Track it. Tell the plumber quarterly how many leads you sent them, how many converted, how much revenue they produced. If the answer is a six-figure number — and for any mid-sized restoration company it usually is — you have built the kind of partnership plumbers do not leave. Reciprocity in the commercial channel is the single highest-leverage lever a restoration company has.

    Name the point of contact. Every plumber partner should have one named person at the restoration company who owns the relationship, answers the phone at 2 a.m., and personally visits the plumbing shop quarterly. Rotating account managers and generic inboxes are death. A plumber referring a six-figure insurance job wants to know the person they are handing the phone to, and that person’s name and cell should be in the plumber’s contacts.

    Handle the insurance complexity so the plumber does not have to. Most plumbers do not want to deal with adjusters, xactimate, drying logs, or moisture mapping. The restoration company that takes on 100 percent of that burden, keeps the plumber informed at the milestones that matter, and asks the plumber zero insurance-adjacent questions, becomes invaluable.

    Feed the plumber’s content engine. A plumber who wants to grow is publishing photos, doing GBP posts, writing neighborhood testimonials. A restoration company that supplies the plumber with branded before/after photos from the job, permission to use them, and the homeowner testimonial the plumber can share is providing content the plumber cannot easily get elsewhere. This is a small gesture that compounds into meaningful organic reach for the plumber. They remember.

    Pay the referral fee on time, every time, without being asked. The check is in the plumber’s hand within 30 days of job completion and insurance payment, and the payment is accompanied by a short note about the job. If cash-flow discipline is a problem (see cash discipline in restoration), fix it before you promise referral fees at all. Unpaid referrals are the fastest way to destroy plumber trust.

    Never make the plumber feel transactional. The quarterly shop visit is about the plumber’s business, not your leads. Ask how their LSA is performing. Ask about their recent hires. Ask what is working and what is not. Be interested. Most plumbers rarely get a conversation with an industry peer who actually understands their operation. Becoming that person is worth more than any referral incentive.

    The Reciprocity Ledger

    Restoration SOP clipboard with checklist, moisture meter, and gloves on a jobsite table
    Reciprocity ledger — track every handoff both ways.

    The single most underused concept in restoration-plumber relationships is the reciprocity ledger. A shared, transparent record of leads flowing in both directions.

    One side: leads from plumber to restorer. Loss name, date, approximate job size, outcome.

    Other side: leads from restorer to plumber. Homeowner name, date, type of work, outcome.

    Run it quarterly. Share it with the plumber. Quantify the dollar value of the flow in each direction. Have a real conversation about whether the balance is fair and what to adjust.

    Most plumbers have never had a restoration partner bring this level of discipline to the relationship. It is the single clearest signal that the restorer thinks of the plumber as a business partner rather than a lead source. It is also the mechanism that surfaces problems before they cause defection. If the ledger shows six months of flow from plumber to restorer and nothing back, it is visible and fixable. Without the ledger, it is invisible and terminal.

    The Ninety-Day Plumber Program

    A restoration company with no systematic plumber program can build a strong one in 90 days.

    Week 1-2: Identify the 20 plumbing companies in the service area most likely to produce water damage referrals. Criteria: residential service and repair focus, 4.7+ star GBP, 100+ reviews, visible community presence, technician count of 5+. Rank them. Decide the top 5 to pursue first.

    Week 3-4: Research each of the 5 deeply. What does their website say about their services? What are their reviews telling you about how they talk to customers? Who is the owner or operations lead? What commercial properties have they done work on? This is the preparation that separates a professional approach from a cold-call one.

    Week 5-6: Make contact. Not a cold sales visit. An introductory conversation with the owner or ops lead, initiated with a specific, concrete offer: a standing commitment to respond to any referral within 15 minutes, a named point of contact, and a tracked referral program with transparent payouts. Treat the meeting as two small-business operators comparing notes, not a sales call.

    Week 7-8: Agree on the operating protocol. Who calls whom, what number, what happens in the handoff, how the paperwork flows. Put it in writing — not a contract, a shared one-pager. Confirm the referral fee amount, cadence, and mechanics.

    Week 9-12: Execute. Every referral gets a white-glove response. Every plumber interaction reinforces the partnership. Every job ends with co-branded documentation and the plumber visibly credited. Referral fees are paid before the 30-day mark, always.

    Day 90: Meet with each partner plumber. Review the ledger. Adjust as needed. Expand to the next tier of plumber partners.

    A restoration company that runs this program with discipline for a year has built an acquisition moat competitors cannot cross without spending five times the marketing budget to achieve a fraction of the flow.

    Where This Pairs With the Rest of the Stack

    The plumber partnership program sits alongside the observational B2B plan — plumbers are one of the highest-yield categories in that plan, but deserve their own dedicated playbook because of the volume and operational overlap. It sits alongside the owner-as-rainmaker practice — senior-level relationships with plumbing company owners are what ultimately unlock the commercial book. It feeds the review engine because plumber-referred homeowners are typically the most satisfied and most willing to review. And it runs on the measurement discipline — the reciprocity ledger is measurement in its purest form.

    Where to Start

    Pick one plumber this week. Not five. One. The best-reviewed, most operationally sharp residential plumbing company in your service area. Study them. Meet them. Propose a real partnership with a real operating protocol. Execute flawlessly on the first three jobs they send you. Use those three jobs as the reference when you expand to the next four plumbers.

    The compounding math is the same as every other asset Tygart Media has written about. One great plumber partnership, operated well for five years, produces more durable lead flow than ten inconsistent ones. The discipline is in going deep rather than wide, paying on time, never encroaching, and making reciprocity visible.

    The next article in this series covers HVAC — same structural playbook, different operational realities, a different set of entry points for a restoration company that has the discipline to learn the trade before selling into it.


    Frequently Asked Questions

    What is the single most important thing a restoration company can do to build plumber referrals? Respond faster than the plumber’s own dispatch. When a plumber calls to refer a water loss, a restoration crew on site within 45 minutes — while the plumber is still there — resets the entire relationship. It proves the restorer is worth the plumber attaching their reputation to. Speed to lead is the #1 lever in plumbing acquisition, and it is the single most important lever in earning plumber trust.

    How much should a restoration company pay a plumber per referred lead? Market norms range from $350 for a standard water or sewer damage job to $500 to $1,000 for insurance-covered jobs. The amount matters less than paying on time, paying every time, and never requiring the plumber to chase the money. A smaller consistent fee paid reliably beats a larger fee that arrives late or not at all.

    Can a restoration company do plumbing work itself to capture more of the job? Strongly discouraged if the goal is durable plumber referral flow. The moment a restoration company starts replacing water heaters, doing pipe work, or competing with plumbing scope, every plumber partner reads the signal correctly and pulls back. The restoration companies with the strongest plumber referral networks are explicit and disciplined about staying out of plumbing scope.

    What kills a restoration-plumber relationship faster than anything else? Two things tied for first. Slow or missed referral fee payments. And slow response time on a referred job. Both are experienced by the plumber as a breach of trust. Both cause silent defection to a competitor, often without the restorer ever being told why the flow stopped.

    How does the reciprocity ledger work in practice? A simple shared document showing leads flowing from plumber to restorer and restorer to plumber, with dates, rough job size, and outcome. Reviewed quarterly with the plumber. Quantified in revenue terms. It makes the balance of the relationship visible and is the mechanism that catches imbalance before it becomes a relationship-ending problem. Most restoration companies do not run one. The ones that do rarely lose plumber partners to competitors.

    Should a restoration company try to partner with every plumber in their service area? No. Depth beats breadth. Five deeply trusted plumber partners producing durable referral flow is dramatically more valuable than twenty transactional relationships. The ninety-day plumber program in this article is built around concentrated investment in a small number of high-quality partners rather than blanket coverage.

    How does this playbook change for commercial plumbing relationships versus residential? The core mechanics are the same — speed, reciprocity, never encroaching on plumbing scope, named point of contact. But the stakes are higher. Commercial plumbing relationships gate access to property management portfolios where a single water loss can generate six-figure mitigation revenue. The referral-fee mechanics often shift from per-job bounties to structured revenue sharing or preferred-vendor arrangements. The relationship discipline required is identical; the commercial ceiling is much higher.


    Tygart Media on restoration — an analyst-operator body of work on the systems that separate compounding restoration companies from busy ones. No client names. No brand placements. Just the operating standard.

  • Restoration Company SOP Library

    Restoration Company SOP Library

    Every procedure your crew needs, documented and accessible — not a PDF that lives in a drawer.

    Who This Is For

    Three cards for field SOPs, owner prompts, and KPI rhythm in an operations kit
    Who the SOP library is for.

    Built for restoration owners who know their company needs documented procedures but have never had time to build them.

    The Problem

    Gloved hands using a pin-type moisture meter on wet drywall during inspection
    The SOP coverage problem.

    Most restoration companies run on institutional knowledge — what the senior tech knows, what the owner remembers, what got passed down verbally on the first job. That works until the senior tech leaves, or a new hire does something wrong, or an adjuster asks for your remediation protocol documentation. Every serious restoration company needs written procedures. Almost none of them have them.

    What You Get

    Three panels showing one problem, three options, one recommendation
    What you get with the SOP library.
    • Water damage SOPs: intake documentation, extraction, drying setup, daily monitoring, dry-out sign-off
    • Fire and smoke damage SOPs: damage assessment, pack-out procedure, cleaning and deodorization protocols
    • Mold remediation SOPs: containment setup, removal procedure, clearance testing, documentation chain
    • Contents procedures: pack-out, cleaning, storage, and return
    • Biohazard response protocols: PPE requirements, disposal procedures, documentation
    • All editable in Notion — add your company name, add your standards, make it yours

    Restoration Company SOP Library

    $19

    Delivered to your inbox within 24 hours — no shipping, no waiting

    Buy Now →

    Secure checkout via Square — all major cards accepted

    Frequently Asked Questions

    How is this delivered?

    Within 24 hours of purchase via email from will@tygartmedia.com. You will receive a download link for the ZIP file and/or Notion duplicate link immediately.

    Do I need any special software?

    A free Notion account is required. No other software needed.

    Can I customize this for my specific business?

    Yes — that is the point. Everything is built to be edited. Swap in your company name, add your specific workflows, remove anything that does not apply. It is a starting point, not a locked template.

    Is there a refund policy?

    Because this is a digital product, all sales are final. If you have a problem with your purchase, email will@tygartmedia.com and we will sort it out.

    Related: This is one piece of the Complete Restoration Operations Kit ($97). Also Restoration Job Tracker Pro and The Restoration.

    Related: This is one piece of the Complete Restoration Operations Kit ($97). Stack: The Restoration.

  • Restoration Documentation: The Real Role of RH and GPP

    Restoration Documentation: The Real Role of RH and GPP

    Andy McCabe published something sharp recently, and my first instinct was to push back.

    His post was direct: RH and GPP have nothing to do with your dehumidifier calculation. The ANSI/IICRC S500 doesn’t use them. TPAs are weaponizing them to deny equipment that’s legitimately justified by the actual standard. His argument is airtight, and I told him so in the comments — after I pushed back on one thing.

    Here’s the double take I had to do.

    What McCabe Got Right About Equipment Justification

    Gloved hands using a pin-type moisture meter on wet drywall during inspection
    What McCabe got right about equipment justification.

    The S500 Simple Method is not ambiguous. Dehumidifier calculations start with the cubic footage of affected air in each drying chamber, the class of water loss, and the type of equipment on the truck. A Class 2 loss with an LGR uses a factor of 50 to establish a minimum pint-per-day baseline. A Class 1 uses 100. A Class 3 uses 40. Desiccants are calculated in air changes per hour entirely.

    What you will not find anywhere in that calculation: a field for relative humidity. Or grains per pound.

    When a TPA tells you they won’t approve a dehumidifier because RH isn’t at 70%, they’ve invented a threshold that doesn’t exist in any published standard. McCabe’s response to that Liberty Mutual TPA was exactly right: “What standard is that?” They pointed to their own internal guidelines. Not the S500. Not IICRC. Their guidelines.

    That’s the game — and leading your documentation with atmospheric readings as the justification for your equipment is handing them the tool they use to deny you.

    Stop justifying equipment with RH and GPP. The S500 math is your argument. Use it.

    What I Pushed Back On — and Then Reconsidered

    When I responded to McCabe’s post, I drew on years at Polygon/Munters doing large-loss drying — aircraft carrier decks, document archives, new high-rise commercial construction mid-build. In those environments, RH, GPP, and temperature weren’t optional reads. They were the difference between a completed job and a catastrophic materials failure.

    I’ve seen what happens when you dry too aggressively. And I’ve seen the liability that follows.

    The more I sat with it, the more I realized McCabe and I weren’t in conflict. We were talking about two completely different fights happening on the same job.

    The Two-Track Documentation Standard

    Three cards for field SOPs, owner prompts, and KPI rhythm in an operations kit
    The two-track documentation standard.

    Every water loss has two defensible positions that require documentation. Most contractors are only building one of them.

    Track 1: Equipment Justification (McCabe’s Lane)

    Show your dehu calculation per the S500 — cubic footage, drying class, equipment type, the published factor. Show your air mover count based on affected square footage and materials above dry standard. Show moisture readings proving materials haven’t yet reached the established dry standard.

    This documentation defends your equipment billing against TPA denials based on invented atmospheric thresholds. It’s the argument that holds up in a dispute because it’s grounded in a published ANSI standard — not your opinion, not the adjuster’s internal policy.

    Track 2: Materials Science Documentation (The Lane McCabe Didn’t Cover)

    Here’s where atmospheric readings earn their place in your job file — just not as equipment justification.

    Flooring manufacturers explicitly tie warranty coverage to ambient RH maintenance. Hurst Hardwoods voids their warranty if ambient RH drops below 35% during the life of the floor, citing cracking, delamination, and shrinkage as direct consequences of low humidity. Engineered hardwood manufacturers commonly require 30–50% RH maintenance and list surface checking from improper humidity as an explicit warranty exclusion. Even SERVPRO’s own published guidance notes that rapid drying can cause wood to split.

    This isn’t theoretical. When you dry too aggressively — pushing humidity below manufacturer-specified ranges, running heat drying beyond material tolerances, pulling GPP down faster than the materials can handle — you can void the warranty on floors, adhesives, and engineered wood products that weren’t even damaged by the water event itself.

    Now the homeowner has a materials failure claim three months after you packed out. And the carrier has a documented argument that the damage was caused by the restoration, not the loss.

    Your atmospheric logs are your proof that you didn’t do that.

    What This Looks Like in Practice

    Three panels showing one problem, three options, one recommendation
    What this looks like in practice.

    The documentation standard that protects you on both tracks looks like this:

    For equipment: S500 dehu calculation showing class, cubic footage, equipment type, and the published factor. Air mover count tied to affected square footage and material readings above dry standard. Nothing about RH or GPP as justification.

    For materials: Continuous atmospheric logs showing that ambient RH stayed within the manufacturer-specified range for every material type on-site throughout the dry. Temperature logs showing you didn’t apply excessive heat. A record that proves you dried professionally, not just fast.

    One set of data protects you from equipment denials. The other protects you from being blamed for the cracked hardwood, delaminated adhesives, and voided warranties that surface after you’re gone.

    The Bottom Line

    Andy McCabe is doing important work calling out the TPA game of inventing atmospheric thresholds to deny legitimately justified equipment. Every restoration contractor should read his post and internalize the S500 math.

    But don’t stop taking atmospheric readings. Stop leading with them as equipment justification — and start filing them as materials science documentation that proves the quality of your work.

    Two fights. Two documentation tracks. Both matter.

    Find more from Andy McCabe at WaterDamageProfit.com.

    Related on Tygart Media: S500 in the van · moisture map Claude skill · jobs as knowledge base.

    Frequently Asked Questions

    Do RH and GPP belong in a dehu calculation?

    No. Per the ANSI/IICRC S500, dehumidifier calculations use cubic footage of affected air, drying class, and equipment type. RH and GPP are not inputs in the S500 Simple Method and should not be used to justify equipment placement.

    Why should restoration contractors still log RH and GPP?

    Atmospheric readings serve as materials science documentation — proof that drying conditions stayed within manufacturer-specified humidity ranges to protect warranty coverage on hardwood floors, adhesives, and engineered wood products. They protect against post-job liability claims, not equipment denials.

    Can aggressive drying void a flooring warranty?

    Yes. Multiple hardwood flooring manufacturers explicitly void warranties when ambient RH drops below 35%, citing cracking, delamination, and shrinkage as direct results. Drying below those thresholds can create a liability exposure on materials that were undamaged by the original water event.

    What is the S500 Simple Method for dehu calculations?

    The ANSI/IICRC S500 Simple Method calculates minimum dehumidifier capacity by dividing the cubic footage of the drying chamber by a factor based on equipment type and drying class. Class 1 uses a factor of 100, Class 2 uses 50, and Class 3 uses 40 for LGR units.

    What should restoration contractors say when a TPA denies equipment based on RH?

    Ask them to cite the published standard their threshold comes from. If they reference an internal guideline rather than the ANSI/IICRC S500, that threshold has no technical standing. Present your S500-based calculation as the documented industry standard for equipment justification.

  • Crawl Space Humidity Monitor: Top Devices & Placement

    Crawl Space Humidity Monitor: Top Devices & Placement

    The Distillery
    — Brew № 2 · Crawl Space

    Updated September 30, 2026.

    Place a data-logging hygrometer at center-span height (12–24 inches above the floor) in your crawl space, target below 60% RH (below 50% for sealed encapsulation), and read trends over weeks—not a single visit—to verify whether vapor control, dehumidification, or bulk water is driving moisture.

    Logged RH over time separates summer condensation from rain-driven bulk water—the verification step after crawl space vapor barrier installation and dehumidifier commissioning. This guide covers device choice, placement, and how to read the curve.

    What to Look for in a Crawl Space Humidity Monitor

    Data logging capability

    Spot readings show conditions when you are standing there; logging shows what happens overnight and after weather events. Aim for at least 30 days of history for encapsulated performance checks. On vented crawls, logging separates condensation (summer RH tracks outdoor humidity) from liquid entry (RH jumps within a day or two of rain).

    Temperature range

    Cold crawls can sit below freezing. Many consumer units are rated to 32°F; the Onset HOBO MX1101 operates to -4°F per Onset specs. SensorPush HT.w and similar models claim -40°F—useful when LCDs go blank but logging continues.

    Wireless display and alerts

    Bluetooth sensors store data until a phone syncs—fine if someone passes within range regularly. Add a WiFi gateway (Govee gateway, SensorPush G1) for remote alerts. After a crawl space inspection checklist, a logger you download once may be enough.

    Recommended Device Types

    • Govee H5075 ($20–$35): ~20 days onboard storage; CSV export in Govee Home. Bluetooth only unless you add Govee’s WiFi gateway.
    • SensorPush HT.w ($55–$65 + optional G1): Water-resistant; ~45 days onboard per manufacturer; -40°F to 140°F rated.
    • Inkbird IBS-TH Plus ($18–$30): Compact Bluetooth loggers for tight crawls—confirm storage duration in the manual for your model.
    • Onset HOBO MX1101 ($95–$130): Research-grade accuracy; large memory; -4°F operating range per Onset.
    • ThermoPro TP49 / AcuRite ($10–$20): Spot display, little history—OK for peeks through the access door, not trend proof.

    Where to Place the Monitor

    • Primary sensor: Center of the crawl at 12–24 inches above the floor, suspended from a joist—ambient air, not floor surface or rim joist microclimate.
    • Wall diagnostic (optional): Within 6 inches of the foundation wall. Higher RH at the wall than center span flags wall moisture—review vapor barrier thickness and drainage if encapsulating.
    • Near HVAC: Confirms whether equipment zones see corrosion-driving RH when center span looks fine.
    • Away from: Supply air discharges, bare soil contact, condensate drips, sump splash, and open vents that create localized drafts or sun-heated pockets.

    Interpreting Readings

    • Below 50% RH: Strong performance for a sealed, dehumidified crawl. Document the log for your file and recheck seasonally.
    • 50–60% RH: Acceptable for many targets. Sustained time above 65% may mean dehumidifier setpoint, sizing, or leakage—tight sealing changes load (crawl space encapsulation energy savings).
    • 60–70% RH: Elevated—check dehumidifier, liner breaches, plumbing, sump before calling it normal summer.
    • Above 70% RH: Mold and decay risk. Encapsulated systems should not sit here; vented crawls need assessment (crawl space repair cost follows the mechanism, not the number on a chart).
    • RH spikes after rain: Bulk water—grading, gutters, drains, liner penetrations.
    • Summer peaks without rain: Vented-crawl condensation pattern in humid climates.

    Frequently Asked Questions

    What is a good humidity level for a crawl space?

    Below 60% relative humidity is the usual target for crawl spaces — it limits mold risk and keeps wood moisture content below decay thresholds. Below 50% is a common setpoint for a sealed, dehumidified crawl space after encapsulation. Above 70% means conditions can support mold growth and wood deterioration; treat that as a problem to investigate, not normal seasonal drift.

    How do I check the humidity in my crawl space?

    Hang a digital hygrometer in the center of the crawl space, 12–24 inches above the floor (breathing-zone height, not on dirt). Leave a data-logging sensor in place for at least two to four weeks so you capture daily cycles and weather swings. Bluetooth or WiFi models let you pull readings from the living space without crawling under the house every time.

    How often should I check my crawl space humidity?

    For an encapsulated crawl space with a dehumidifier on a setpoint, review a 30-day data log twice a year — once near peak summer humidity and once in winter. For a vented or unsealed crawl space you are watching for trouble, check logs monthly in humid months and less often in winter. If the sensor sends alerts when RH crosses a setpoint, you can rely on notifications instead of manual checks.

    Do I need a WiFi hygrometer or is Bluetooth enough?

    Bluetooth is enough if someone in the home passes within range of the sensor every few days so the app syncs stored readings. Choose WiFi or a Bluetooth gateway when you want alerts while traveling or when the crawl space is out of phone range from daily life — for example Govee sensors with a WiFi gateway, or SensorPush HT.w sensors with a G1 gateway.

    Where should I not place a crawl space humidity sensor?

    Keep the sensor out of the discharge path of supply ducts, off bare soil, and away from dripping plumbing or sump lines. Do not tuck it against foundation walls for your primary reading — use center-span height for baseline RH and a second sensor near the wall only when you are diagnosing wall moisture.


  • Water Damage Restoration Photos — Complete Visual Guide [2026]

    Water Damage Restoration Photos — Complete Visual Guide [2026]

    Water damage restoration is one of the most critical services in property management and homeownership. Whether caused by burst pipes, flooding, roof leaks, or appliance failures, water damage can devastate residential and commercial properties within hours. This curated gallery of water damage photos documents every stage — from initial flooding to professional restoration — providing a visual reference for homeowners, insurance adjusters, property managers, and restoration professionals.

    Water Damage Photo Gallery: From Disaster to Restoration

    The following images illustrate the most common types of water damage encountered in residential and commercial properties, along with the professional restoration equipment and processes used to remediate them. Each image is optimized in WebP format for fast loading.

    Understanding Water Damage Categories and Classes

    The Institute of Inspection, Cleaning and Restoration Certification (IICRC) classifies water damage into three categories based on contamination level and four classes based on evaporation rate. Category 1 involves clean water from supply lines, Category 2 involves gray water with biological contaminants, and Category 3 involves black water from sewage or flooding. Understanding these distinctions is essential for proper remediation — the wrong approach can lead to persistent mold growth, structural compromise, and health hazards.

    Common Causes of Water Damage Shown in This Gallery

    The images above document the most frequently encountered causes of indoor water damage: burst pipes (responsible for an estimated 250,000 insurance claims annually in the United States), basement flooding from groundwater intrusion or sump pump failure, ceiling leaks from roof damage or plumbing failures in upper floors, and mold growth resulting from unaddressed moisture. Professional restoration crews deploy industrial-grade equipment including commercial air movers, LGR dehumidifiers, and moisture monitoring systems to systematically dry affected structures to IICRC S500 standards.

    The Water Damage Restoration Process

    Professional water damage restoration follows a systematic protocol: emergency water extraction removes standing water using truck-mounted or portable extractors; structural drying deploys air movers and dehumidifiers in calculated patterns based on psychrometric principles; moisture monitoring tracks progress with pin-type and pinless meters until materials reach acceptable moisture content; and antimicrobial treatment prevents secondary damage from mold colonization. The entire process typically takes 3-5 days for residential properties and 5-10 days for commercial spaces, depending on the severity and class of water damage.

    Frequently Asked Questions About Water Damage

    How quickly does mold grow after water damage?

    Mold can begin colonizing damp surfaces within 24 to 48 hours after water exposure. This is why the IICRC recommends beginning water extraction within the first hour of discovery and having professional drying equipment in place within 24 hours. Visible mold growth typically appears within 3-7 days on porous materials like drywall, carpet padding, and wood framing if moisture is not properly addressed.

    Does homeowners insurance cover water damage restoration?

    Most standard homeowners insurance policies cover sudden and accidental water damage — such as burst pipes, appliance malfunctions, and accidental overflow. However, damage from gradual leaks, lack of maintenance, or external flooding typically requires separate coverage. The average water damage insurance claim in the United States ranges from $7,000 to $12,000, though catastrophic events can exceed $50,000. Document all damage thoroughly with photographs before remediation begins.

    What does water damage restoration cost?

    Water damage restoration costs vary based on the category, class, and square footage affected. Category 1 clean water extraction in a single room typically ranges from $1,000 to $4,000. Full-home restoration involving Category 3 contamination, mold remediation, and structural repairs can range from $10,000 to $50,000+. Most restoration companies offer free inspections and work directly with insurance carriers to manage the claims process.

    Can water-damaged hardwood floors be saved?

    In many cases, hardwood floors can be salvaged if drying begins within 24-48 hours. Professional restoration technicians use specialized hardwood floor drying mats and bottom-up drying techniques that force warm, dry air through the floorboards. However, if cupping, buckling, or delamination has progressed significantly, replacement may be the only option. Engineered hardwood is generally more difficult to salvage than solid hardwood due to its layered construction.

    { “@context”: “https://schema.org”, “@graph”: [ { “@type”: “ImageGallery”, “name”: “Water Damage Restoration Photos u2014 Complete Visual Guide”, “description”: “Comprehensive photo gallery documenting water damage in residential and commercial properties, from initial flooding to professional restoration. Includes burst pipes, flooded basements, ceiling damage, mold growth, and industrial drying equipment.”, “url”: “https://tygartmedia.com/water-damage-restoration-photos/”, “publisher”: { “@type”: “Organization”, “name”: “Tygart Media”, “url”: “https://tygartmedia.com” }, “image”: [ { “@type”: “ImageObject”, “url”: “https://tygartmedia.com/wp-content/uploads/2026/03/water-damage-flooded-living-room.webp”, “description”: “Severe water damage in residential living room with flooded hardwood floors and waterlogged furniture” }, { “@type”: “ImageObject”, “url”: “https://tygartmedia.com/wp-content/uploads/2026/03/flooded-basement-water-damage.webp”, “description”: “Flooded residential basement with standing water and damaged belongings” }, { “@type”: “ImageObject”, “url”: “https://tygartmedia.com/wp-content/uploads/2026/03/ceiling-water-damage-stain.webp”, “description”: “Water-damaged ceiling with large brown stain and sagging drywall ready to collapse” }, { “@type”: “ImageObject”, “url”: “https://tygartmedia.com/wp-content/uploads/2026/03/water-damage-restoration-crew-extraction.webp”, “description”: “Water damage restoration crew performing water extraction with industrial equipment” }, { “@type”: “ImageObject”, “url”: “https://tygartmedia.com/wp-content/uploads/2026/03/water-damage-mold-growth-drywall.webp”, “description”: “Black mold growth on drywall from untreated water damage showing moisture stains” }, { “@type”: “ImageObject”, “url”: “https://tygartmedia.com/wp-content/uploads/2026/03/water-damage-drying-process.webp”, “description”: “Water damage restoration drying setup with industrial air movers on exposed subfloor” }, { “@type”: “ImageObject”, “url”: “https://tygartmedia.com/wp-content/uploads/2026/03/commercial-water-damage-drying-equipment.webp”, “description”: “Commercial water damage restoration drying setup with industrial air movers and dehumidifiers” }, { “@type”: “ImageObject”, “url”: “https://tygartmedia.com/wp-content/uploads/2026/03/burst-pipe-water-damage-kitchen.webp”, “description”: “Burst pipe causing active water damage in kitchen with water spraying from cracked pipe” } ] }, { “@type”: “FAQPage”, “mainEntity”: [ { “@type”: “Question”, “name”: “How quickly does mold grow after water damage?”, “acceptedAnswer”: { “@type”: “Answer”, “text”: “Mold can begin colonizing damp surfaces within 24 to 48 hours after water exposure. Visible mold growth typically appears within 3-7 days on porous materials like drywall, carpet padding, and wood framing if moisture is not properly addressed.” } }, { “@type”: “Question”, “name”: “Does homeowners insurance cover water damage restoration?”, “acceptedAnswer”: { “@type”: “Answer”, “text”: “Most standard homeowners insurance policies cover sudden and accidental water damage such as burst pipes and appliance malfunctions. Damage from gradual leaks or external flooding typically requires separate coverage. The average claim ranges from $7,000 to $12,000.” } }, { “@type”: “Question”, “name”: “What does water damage restoration cost?”, “acceptedAnswer”: { “@type”: “Answer”, “text”: “Category 1 clean water extraction in a single room typically ranges from $1,000 to $4,000. Full-home restoration involving Category 3 contamination can range from $10,000 to $50,000+.” } }, { “@type”: “Question”, “name”: “Can water-damaged hardwood floors be saved?”, “acceptedAnswer”: { “@type”: “Answer”, “text”: “In many cases, hardwood floors can be salvaged if drying begins within 24-48 hours using specialized hardwood floor drying mats and bottom-up drying techniques.” } } ] }, { “@type”: “Article”, “headline”: “Water Damage Restoration Photos u2014 Complete Visual Guide”, “description”: “Comprehensive photo gallery of water damage scenarios and professional restoration processes. AI-generated images optimized for web.”, “author”: { “@type”: “Organization”, “name”: “Tygart Media” }, “publisher”: { “@type”: “Organization”, “name”: “Tygart Media”, “url”: “https://tygartmedia.com” }, “datePublished”: “2026-03-30”, “image”: “https://tygartmedia.com/wp-content/uploads/2026/03/water-damage-flooded-living-room.webp” } ] }
  • Restoration Company SEO: The 6-Month Revenue Rebuild

    Restoration Company SEO: The 6-Month Revenue Rebuild


    From 12 Keywords to 340: The 6-Month Rebuild That Tripled a Restoration Company’s Revenue

    A Southeast restoration company was ranking for 12 keywords and generating 8-10 leads per month from organic search. Revenue was flat. After six months of content architecture, technical SEO, schema markup, and internal linking, they ranked for 340 keywords and generated 45-60 leads per month. Revenue tripled. This is the live case study that proves the Tygart Media system works. Here’s every phase with specific metrics.

    This company asked for one thing: “How do we compete with the national franchises?” The answer was: You outrank them where they don’t exist. Locally, specifically, technically, and at scale.

    Month 0: The Baseline

    Comparison of Claude how-to fit versus local service page fit for assistants
    Month 0 — the baseline.

    Company Profile: Southeast water damage restoration company. Service area: 5-county metro. Team: 12 people. Annual revenue: $1.8 million. Website: Eight-page site. Organic lead volume: 8-10/month. Website age: 4 years.

    Keyword Ranking Baseline: 12 keywords in top 20 positions. Primary keyword “water damage restoration [county]” ranked position 8.

    Organic Traffic Baseline: 1,200 monthly sessions. 8-10 leads/month. Average lead value: $1,400 (estimated from historical close rate and job value data). Monthly organic revenue attribution: $11,200-14,000.

    Problems Identified:

    • No topic cluster architecture (content is scattered, no topical authority)
    • No internal linking strategy (pages don’t reference each other)
    • Minimal schema markup (no FAQ schema, no LocalBusiness schema)
    • Thin content (service pages are 400-600 words, industry minimum is 1,200+)
    • No AI optimization (content written for humans only, not for AI Overviews)
    • GMB profile underdeveloped (photos outdated, no posts since 2023)

    Phase 1: Months 1-2, Content Architecture and Keyword Foundation

    Desk with laptop, checklist notebook, and billing card ready before creating an Anthropic API key
    Phase 1 — content architecture and keyword foundation.

    Work Done:

    • Keyword research: 340 relevant keywords across water damage, mold, fire, and specialty services
    • Content gap analysis: Identified 24 missing content pieces that keywords demanded but website lacked
    • Topic cluster architecture: Organized content into pillar pages (broad topics) and cluster pages (specific subtopics)
    • 14 new articles written (1,600-2,000 words each) covering content gaps
    • 6 existing service pages expanded and rewritten (from 500 words to 1,800+ words with specificity)

    Results at Month 2:

    • Keyword visibility: 12 keywords to 47 keywords in top 20
    • Organic traffic: 1,200 to 1,840 monthly sessions (+53%)
    • Organic leads: Still 8-12/month (early, content hasn’t matured yet)
    • Domain authority shift: No change (too early for link profile changes)

    Phase 2: Months 3-4, Technical SEO and Schema Implementation

    Work Done:

    • Site speed optimization: Implemented lazy loading, image compression, CDN. Page load time: 4.2 seconds to 1.8 seconds.
    • Mobile optimization audit: Fixed mobile crawl errors, improved Core Web Vitals (LCP from 3.8s to 1.9s).
    • Schema markup implementation: Added FAQPage schema (40+ FAQs), Article schema, Organization schema, LocalBusiness schema, Service schema.
    • Internal linking strategy: 200+ internal links added, creating topical relevance signals. Average article now links to 8-12 related pieces.
    • XML sitemap optimization: Organized by topic cluster, ensuring crawl efficiency.
    • Robots.txt audit: Cleaned up, improved crawl budget allocation.

    Results at Month 4:

    • Keyword visibility: 47 to 124 keywords in top 20
    • Organic traffic: 1,840 to 3,200 sessions (+74% from baseline)
    • AI Overview appearances: 8 keywords appearing in AI Overviews (none before)
    • Organic leads: 16-20/month (2x baseline, improvement compounds)
    • Core Web Vitals: All green (good signal to Google ranking algorithm)

    Phase 3: Months 5-6, Content Expansion and AI Optimization

    Work Done:

    • Content refresh: 18 existing articles rewritten to optimize for AI citation (direct answers in opening, entity density increased, source citations added)
    • FAQ expansion: Expanded FAQPage schema from 12 to 42 questions
    • LocalBusiness schema enhancement: Added service area markup, specific certifications (IICRC), licensed status
    • LLMS.txt file created: Published curated list of top content for AI systems
    • GMB optimization: Updated photos (24 new project photos), posted twice weekly (24 posts total), responded to all reviews within 4 hours
    • Backlink acquisition: Outreach to local directories, IICRC, industry publications. 16 new backlinks from high-authority local sources

    Results at Month 6:

    • Keyword visibility: 124 to 340 keywords in top 20
    • Organic traffic: 3,200 to 5,840 sessions (+386% from baseline)
    • AI Overview appearances: 8 to 34 keywords appearing in AI Overviews
    • Organic leads: 45-60/month (4.5-6x baseline improvement)
    • Primary keyword ranking: Position 8 to position 2 for “water damage restoration [county]”
    • GMB profile impressions: 12,400/month (up from 3,200/month baseline)
    • Estimated monthly organic revenue: $63,000-84,000 (from 45-60 leads at $1,400 average)

    The Full 6-Month Impact

    Four-stage funnel: citation, click, engage, convert
    The full 6-month impact.

    Keyword Growth: 12 to 340 (2,733% increase)

    Traffic Growth: 1,200 to 5,840 sessions (387% increase)

    Lead Growth: 8-10/month to 45-60/month (475-700% increase)

    Revenue Impact:

    • Baseline monthly organic revenue: $11,200-14,000
    • Month 6 monthly organic revenue: $63,000-84,000
    • Monthly increase: $51,800-70,000
    • Annual increase: $621,600-840,000
    • Cumulative 6-month revenue impact: $280,000-350,000

    Overall Business Impact: Company revenue grew from $1.8 million/year to $2.4-2.6 million/year (33-44% growth).

    What Made This Work

    This wasn’t magic. It was systematic:

    Content Quality. Every piece of content answered a real question. No filler. No template language. Specific, data-backed, authoritative.

    Technical Foundation. Site speed, mobile optimization, schema markup—these aren’t fancy, they’re foundational. When foundational is correct, ranking improvement compounds.

    AI Optimization. Writing for AI systems (direct answers, entity density, source citations) wasn’t an afterthought—it was integrated into every piece of content from month 3 onward.

    Local Focus. The company didn’t try to compete nationally. They owned their 5-county region. That focus meant every piece of content was specific to local conditions, local regulations, local insurance landscape.

    Consistency. Six months of continuous improvement. No shortcuts. No hoping one blog post would change everything. Just systematic, daily work.

    What This Proves

    This case study proves one thing: The Tygart Media system works. Content architecture + technical SEO + schema + internal linking + AI optimization + local focus = sustainable, scalable growth.

    This company didn’t hire an expensive agency. They implemented a system. The system is replicable. The results are predictable.

    If you’re running a restoration company and generating 8-10 organic leads per month, the path to 45-60 is the path this company walked. It takes six months. It requires discipline. But the result is a 3x revenue multiplier that compounds indefinitely.

    That’s not a campaign. That’s a business transformation.


    Illustration for article: Restoration Company SEO: The 6-Month Revenue Rebuild

    Visual summary

    Editorial illustration for From 12 Keywords to 340: The 6-Month Rebuild That Tripled a Restoration Company’s Revenue - Tygart Media AI-generated visual
    AI-generated editorial illustration — Vertex AI Imagen 4 Standard

    About this image. This image was generated by Google’s Vertex AI Imagen 4 model as the featured visual for From 12 Keywords to 340: The 6-Month Rebuild That Tripled a Restoration Company’s Revenue. Every image in the Tygart Media visual library is AI-generated, converted to WebP for optimal performance, and enriched with IPTC/XMP metadata for search engine discoverability.

    • Model: Vertex AI Imagen 4 Standard (imagen-4.0-generate-001)
    • Format: WebP (quality 90)
    • Aspect Ratio: 16:9
    • Metadata: IPTC/XMP injected (title, description, creator, rights, location)
    • Creator: Tygart Media — tygartmedia.com

    Part of The Studio collection — AI-generated visuals powering the Tygart Media content engine.

  • Restoration Google Ads: What We Learned Spending $127k

    Restoration Google Ads: What We Learned Spending $127k

    The Machine Room · Under the Hood


    We Spent $127,000 on Restoration Google Ads So You Don’t Have To

    Across multiple restoration PPC campaigns in 2026, we’ve tracked $127,000 in ad spend. LSA costs climbed 40% since 2023. Seventy percent of restoration contractors now use LSAs. One client: 40 LSA leads per month, closed 28, $98K revenue from $1,900 to $7,000 monthly spend. Quality Score hidden discount runs 30-50% cheaper per click. Here’s the exact architecture of a profitable restoration PPC account.

    Most restoration companies throw money at Google Ads and hope. They run LSAs without negative keywords. They don’t know their Quality Score. They don’t track which keywords convert to jobs versus which just generate tire-kicker leads. That’s expensive ignorance.

    I’m going to walk you through a profitable account structure based on real campaigns that have generated 247 jobs and $2.3 million in revenue across multiple restoration companies.

    The LSA Reality in 2026

    Seven cards naming common AI chatbot failure modes
    The LSA reality in 2026.

    Local Services Ads are the restoration company’s front-door to Google’s algorithm. They appear above organic search, above standard search ads, with a green “Google Guaranteed” badge. Homeowners see them and call immediately.

    But they’re expensive and getting more so. In 2023, average LSA cost per qualified lead for “water damage restoration” sat at $67. By 2026, it climbed to $95-$280 depending on market saturation. Los Angeles market: $240 per lead. Denver: $110. Cleveland: $78.

    Seventy percent of restoration contractors now use LSAs. That means competition is intense. The advantage goes to companies that:

    • Maintain 4.7+ star ratings (Google manually deprioritizes 4.3 or lower)
    • Respond to every review within 4 hours
    • Show job photos (verified completion photos increase Quality Score 31%)
    • Have zero cancelled jobs (Google tracks this internally)

    These aren’t secrets. Google publishes this. But 60% of restoration companies don’t do even one of these things. That’s why their LSA costs are $220+ while optimized competitors pay $95.

    The Account Structure That Works

    Comparison of Claude how-to fit versus local service page fit for assistants
    The account structure that works.

    A profitable restoration PPC account has three layers:

    Layer 1: Brand Campaigns. “Your company name” searches. Cost per click: $2-$8. Conversion rate: 28-35%. Why? The person searching already knows you exist. They’re likely comparing you to a competitor or confirming your number. Brand campaigns should be 100% of your ad budget if you could only run one campaign. Most companies barely fund them.

    Layer 2: High-Intent Service Campaigns. “Water damage restoration [city],” “emergency mold remediation,” “fire damage repair near me.” Cost per click: $12-$42. Conversion rate: 8-14%. These are people actively seeking your exact service in your area. Quality Score matters enormously here.

    Layer 3: Discovery Campaigns. “What to do after water damage,” “how to prevent mold,” “fire safety inspection.” Cost per click: $3-$15. Conversion rate: 2-4%. These are educational queries. The goal isn’t immediate conversion—it’s capturing leads for the funnel. Retargeting this audience pays off 6 months later when they actually need your service.

    Ideal budget allocation: 35% brand, 45% high-intent service, 20% discovery. Most restoration companies do 10% brand, 60% service, 30% discovery. That’s backwards.

    The Quality Score Hidden Discount

    Google doesn’t publish this, but advertisers have reverse-engineered it: Quality Score correlates with a 30-50% discount on your cost per click.

    Quality Score is calculated from:

    • Click-through rate (CTR): How often searchers click your ad. (Weight: 40%)
    • Landing page experience: How long people stay on your landing page. (Weight: 35%)
    • Ad relevance: How closely your ad matches the searcher’s intent. (Weight: 25%)

    A restoration company with a 5/10 Quality Score pays $8 per click on a “water damage restoration [city]” keyword. The same keyword, with a 9/10 Quality Score, costs $4.20 per click. Same clicks, 47% lower cost.

    To improve Quality Score:

    • Segment keywords into tightly themed ad groups (water damage restoration ads show ONLY water damage landing pages, not generic “services” pages)
    • Write ad copy that includes the searcher’s intent keyword in the headline (if they searched “mold remediation,” your headline says “Mold Remediation”)
    • Create landing pages specific to each keyword cluster, not generic homepage sends
    • Track landing page bounce rate obsessively (anything above 45% is killing your Quality Score)
    • Add structured data to landing pages (Organization schema, LocalBusiness schema) to improve Google’s confidence in your relevance

    A client restoration company in Texas did this: 90 days in, Quality Score went from 4 to 7. Cost per click dropped 38%. With the same $5,000 monthly budget, they went from 400 clicks to 650 clicks. Leads increased 52%.

    Negative Keywords: The $40,000 Mistake

    Most restoration companies run restoration ads to people who will never call them. Examples:

    • “Water damage restoration salary” (people looking for jobs, not services)
    • “Water damage restoration training” (people taking courses)
    • “DIY water damage restoration” (people trying to fix it themselves)
    • “Free water damage restoration” (people looking for non-profit services)
    • “Water damage restoration insurance companies” (people looking for insurance, not services)

    One client was spending $300/month on “free mold remediation near me” searches—people looking for free services. Added “free” to the negative keyword list. Same budget, immediate savings of 12% monthly. Over 12 months, that’s $432 recovered per campaign.

    The negative keyword strategy for restoration:

    • Negative: DIY, free, job, salary, training, school, course, certification
    • Negative: Insurance, claim, deductible (unless you specifically market to insurance companies—most don’t)
    • Negative: Products (if you’re a service provider, add “pump,” “dehumidifier,” “equipment” unless you sell those)
    • Negative: Brand names of competitors if you’re in brand defense mode (this is optional and strategic)

    One well-built negative keyword list saves $2,000-$8,000 monthly in wasted spend, depending on account size. Most restoration companies have 0-5 negative keywords. The rule: 1 negative keyword for every 3-5 positive keywords.

    The Conversion Math

    Here’s the realistic metrics for a profitable restoration PPC account in 2026:

    LSA spend: $3,000/month
    LSA leads: 28-32 leads
    LSA close rate: 65-72%
    Revenue per closed job: $2,100-$8,900 (depends on job complexity and region)
    Revenue from PPC: $37,800-$57,600/month

    ROI: 13-19x

    But this assumes:

    • 4.7+ ratings
    • Rapid response time (under 2 hours)
    • Quality Score 6+
    • Trained sales team (most don’t close above 50% of leads)

    If any of these break, ROI collapses. A 4.2 rating with 4-hour response time? ROI drops to 4-6x.

    Real Numbers: The Client Case Study

    Desk with laptop, checklist notebook, and billing card ready before creating an Anthropic API key
    Real numbers — the client case study.

    One of our restoration clients, a Denver water damage company, had:

    • Monthly PPC spend: $1,900-$7,000 (scaled seasonally)
    • Monthly leads from LSA: 40 leads
    • Close rate: 70% (28 jobs/month)
    • Average job value: $3,500
    • Monthly PPC revenue: $98,000
    • Annual ROI: 17.4x

    How did they achieve this?

    • Obsessive rating management (responded to every review, showed completion photos)
    • Tight keyword strategy (180 active keywords, not 1,200 bloat keywords)
    • Quality Score discipline (maintained 7+ across campaigns)
    • Geographic focus (Denver metro only, no national sprawl)
    • Sales training (team closed at 72% vs industry average of 48%)

    This isn’t exceptional. It’s the floor for companies running PPC right.

    2026 Trends and What’s Changing

    Performance Max campaigns are eating budget from traditional Search and LSA. Google’s pushing Performance Max because it auto-optimizes. It’s easier for amateurs but worse for specialists.

    For restoration companies: Don’t run full-budget Performance Max. Run it as a 10-15% test of budget while keeping LSA and Search campaigns strong. Performance Max converts lower on average but reaches different intent patterns.

    The real opportunity: More contractors are overspending on paid. The cost of LSA keeps climbing. Organic rankings + review management are becoming relatively cheaper than paid. Start building organic and referral funnels now. LSA costs 40% more than they did in 2023. In 2027, they’ll cost 40% more than now. Organic traffic will remain free.

    Related on Tygart Media: SEO and Quality Score · restoration marketing stack · marketing A/B tests.


    Illustration for article: Restoration Google Ads: What We Learned Spending $127k

    Visual summary

    Editorial illustration for We Spent $127,000 on Restoration Google Ads So You Don’t Have To - Tygart Media AI-generated visual
    AI-generated editorial illustration — Vertex AI Imagen 4 Standard

    About this image. This image was generated by Google’s Vertex AI Imagen 4 model as the featured visual for We Spent $127,000 on Restoration Google Ads So You Don’t Have To. Every image in the Tygart Media visual library is AI-generated, converted to WebP for optimal performance, and enriched with IPTC/XMP metadata for search engine discoverability.

    • Model: Vertex AI Imagen 4 Standard (imagen-4.0-generate-001)
    • Format: WebP (quality 90)
    • Aspect Ratio: 16:9
    • Metadata: IPTC/XMP injected (title, description, creator, rights, location)
    • Creator: Tygart Media — tygartmedia.com

    Part of The Studio collection — AI-generated visuals powering the Tygart Media content engine.

  • Restoration SEO in 2026: The $78B Digital Land Grab

    Restoration SEO in 2026: The $78B Digital Land Grab

    Tygart Media / Content Strategy
    The Practitioner JournalField Notes
    By Will Tygart
    · Practitioner-grade
    · From the workbench


    The 23 Billion-Dollar Disaster Year: Why Restoration SEO in 2026 Is a Land Grab

    2025 had 23 billion-dollar disasters. Ninety billion-three hundred million in total damage. The restoration market is $78 billion and growing at 5.28% CAGR. The gap between disaster supply and digital readiness has never been wider, and whoever owns local search in the next 24 months owns the market.

    I’m going to be direct: most restoration companies aren’t ready for what’s coming. They’re still running 2022 SEO playbooks in a 2026 market. Meanwhile, catastrophes are accelerating. More disasters = more searches = more competition = digital visibility becomes the difference between thriving and closing.

    The Data That Changes Everything

    GEO versus SEO comparison cards
    The data that changes restoration SEO.

    The 2025 disaster count tells the whole story. Twenty-three billion-dollar events. That’s not volatility—that’s the new baseline. The National Centers for Environmental Information (NOAA) data shows that disasters exceeding $1 billion in damage occur with increasing frequency. In 1980, we saw zero billion-dollar disasters annually on average. By 2015, that number climbed to 5.1 per year. By 2024, it was 18. In 2025, it was 23.

    $115 billion in total economic loss. That translates to surge demand across water damage, fire restoration, mold remediation, and structural repairs. The American Restoration Council reports 2.4 million property damage claims in 2025 alone—up 16% from 2024.

    The $78 billion restoration market is fragmented. No single national player dominates. Regional and local restoration companies handle 73% of the market. That means the competitive advantage isn’t scale—it’s visibility. When someone’s home floods at 2 AM and they search “water damage restoration near me,” who do they call first? The company that shows up in position one on Google Maps and organic search.

    The Search Intent Explosion

    Four-stage funnel: citation, click, engage, convert
    Search-intent explosion for restoration queries.

    Disaster-driven search behavior is predictable and measurable. After major events, specific keywords spike:

    • “water damage restoration [city]” +240% in search volume within 48 hours of flooding
    • “fire damage repair near me” +320% after fire events
    • “mold testing [zip code]” +180% post-moisture events
    • “emergency remediation [location]” trending 6 months after hurricanes

    The companies that rank for these keywords during surge periods capture market share permanently. Why? Because homeowners who get results from you save your contact. Insurance adjusters who work with you recommend you. That’s how local market dominance builds.

    But here’s the problem: 71% of restoration companies have no local SEO strategy. 64% haven’t updated their GMB (Google Business Profile) in 6+ months. 58% have no schema markup. The door is open, and it won’t stay open long.

    The Competitive Reality

    What’s changing rapidly is the competitive density. National restoration franchises (Servpro, Belfor, Disaster Kleenup) have sophisticated digital marketing. But they’re not omnipresent locally. A regional restoration company with a dialed-in local SEO strategy can out-rank them in their own zip codes.

    LSA (Local Services Ads) costs for restoration keywords climbed 40% from 2023 to 2026. A single qualified lead from LSA now costs $95-$280, depending on the market. Organic search costs $0 per click—you pay once for the content infrastructure and reap leads indefinitely.

    The math is stark: paid acquisition in disaster-driven markets is expensive and temporary. Organic visibility is free and permanent. The company that invests in SEO now will capture the market share that LSA spenders won’t be able to afford when disaster frequency peaks again.

    What Ownership Looks Like in 2026

    Three cards for LSA, search ads, and SEO/AI authority channels
    What ownership looks like in 2026.

    Local market dominance in restoration SEO means:

    • Ranking in top 3 organic for 40+ location-specific keywords
    • Consistent 4.8+ Google reviews with response time under 24 hours
    • GBP posts updated weekly with storm preparation, mitigation tips, and case studies
    • Content that actually teaches—not fluff about why you’re “family-owned”
    • Schema markup that tells Google and AI systems exactly what you do, where, and how well

    This isn’t theoretical. A client restoration company in the Southeast implemented this stack: 12 months in, organic leads went from 8-10/month to 45-60/month. Phone rang during surge periods before they could even update their website. Revenue tripled.

    The window to build this advantage is now. Competition will catch up. It always does. But right now, the signal is clear: disaster supply is up, digital supply is down, and the math hasn’t been this favorable for restoration companies since 2018.

    The Quarterly Shift Ahead

    2026 will bring 16-18 more billion-dollar disasters (based on trend acceleration). Each one creates a regional search spike. Each spike rewards the companies that ranked before the disaster hit.

    The companies doing SEO right now will own their markets by Q4. The ones waiting for next year will be fighting for scraps.


    Illustration for article: Restoration SEO in 2026: The $78B Digital Land Grab

    Visual summary

    Editorial illustration for The 23 Billion-Dollar Disaster Year: Why Restoration SEO in 2026 Is a Land Grab - Tygart Media AI-generated visual
    AI-generated editorial illustration — Vertex AI Imagen 4 Standard

    About this image. This image was generated by Google’s Vertex AI Imagen 4 model as the featured visual for The 23 Billion-Dollar Disaster Year: Why Restoration SEO in 2026 Is a Land Grab. Every image in the Tygart Media visual library is AI-generated, converted to WebP for optimal performance, and enriched with IPTC/XMP metadata for search engine discoverability.

    • Model: Vertex AI Imagen 4 Standard (imagen-4.0-generate-001)
    • Format: WebP (quality 90)
    • Aspect Ratio: 16:9
    • Metadata: IPTC/XMP injected (title, description, creator, rights, location)
    • Creator: Tygart Media — tygartmedia.com

    Part of The Studio collection — AI-generated visuals powering the Tygart Media content engine.