Tag: Water Damage

  • Content Architecture for Restoration Companies: The System That Turns Blog Posts Into Lead Machines

    Content Architecture for Restoration Companies: The System That Turns Blog Posts Into Lead Machines

    Tygart Media / Content Strategy
    The Practitioner JournalField Notes
    By Will Tygart
    · Practitioner-grade
    · From the workbench

    Your competitor is ranking for 340 keywords in your city. You’re ranking for 12. The difference isn’t budget. It’s architecture.

    I’ve audited over 200 restoration company websites in the last two years. The pattern is always the same: a homepage, an “About” page, four service pages that each say basically the same thing, and a blog with 15 posts nobody reads. Then they wonder why the company across town—smaller crew, older trucks, half the reviews—outranks them on every search that matters.

    The answer is always topical architecture. The companies dominating local search in restoration have built their sites like machines—every page serving a purpose, every internal link carrying authority, every piece of content mapped to a specific keyword cluster. The rest are publishing into a void.

    The Hub-and-Spoke Model That Restoration Companies Keep Getting Wrong
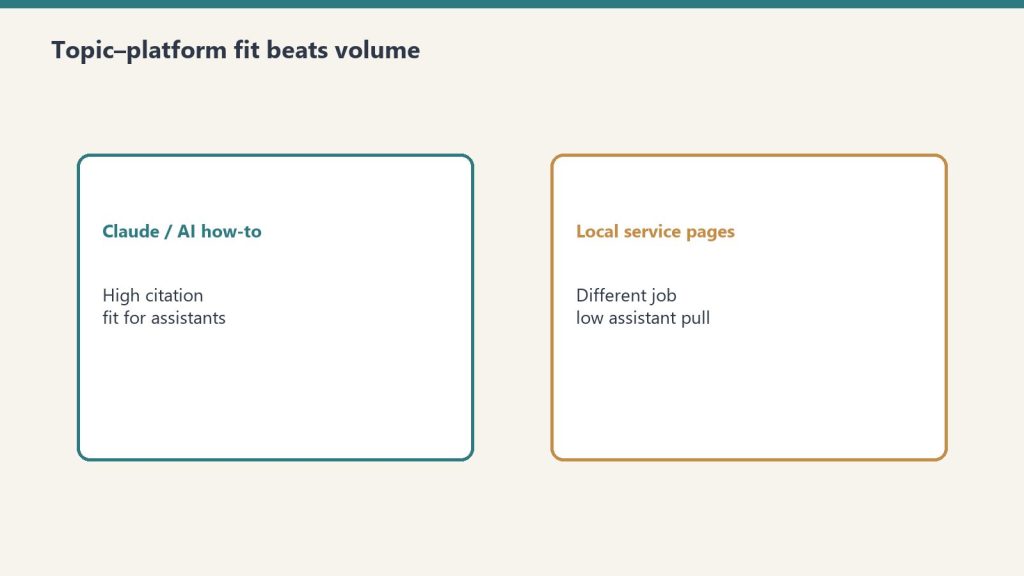
    Comparison of Claude how-to fit versus local service page fit for assistants
    The hub-and-spoke model restoration companies keep getting wrong.

    Everyone talks about hub-and-spoke content. Almost nobody executes it correctly in restoration.

    Here’s what it actually means: you build one comprehensive hub page targeting your broadest keyword (“water damage restoration [city]”), then surround it with 8-12 spoke pages targeting long-tail variations and subtopics (“basement water damage restoration [city],” “burst pipe cleanup [city],” “water damage insurance claims [city]”). Every spoke links back to the hub. The hub links out to every spoke. Google reads this structure and understands that your site has comprehensive coverage of the topic.

    Where restoration companies fail: they build the hub page and call it done. Or they build spokes that don’t link back to the hub. Or they build spokes that compete with each other for the same keywords—cannibalizing their own rankings. A spoke page about “emergency water extraction” and another about “emergency water removal” aren’t two pages. They’re one page fighting itself.

    The fix is a keyword map built before a single word gets written. Every page gets one primary keyword, one URL, and a defined relationship to its hub. No overlaps. No orphans. No cannibalization.

    Content Velocity: Why Publishing Speed Matters More Than You Think

    Desk with laptop, checklist notebook, and billing card ready before creating an Anthropic API key
    Content velocity — why publishing speed matters.

    Google’s algorithm rewards sites that demonstrate consistent publishing velocity. Not volume for volume’s sake—but a steady cadence of new, quality content that signals an active, authoritative presence on a topic.

    The restoration companies that moved from “one blog post when we feel like it” to “two quality posts per week, every week” saw measurable domain authority increases within 90 days. One company went from 47 indexed pages to 142 in four months and watched their organic traffic increase 284%. Not because every post generated traffic on its own—but because the cumulative topical coverage told Google “this site knows water damage restoration in Houston better than anyone else.”

    Content velocity in 2026 doesn’t mean churning out AI slop. It means having a production system—editorial calendar, keyword assignments, writer guidelines, quality gates—that produces at a pace your competitors can’t sustain. Two excellent posts per week beats ten mediocre posts per week, every time. But two excellent posts per week also beats one excellent post per month.

    The Pillar Page Strategy That Generates $40,000 Months

    A pillar page is a hub page on steroids. It covers a topic comprehensively—3,000 to 5,000 words—with jump links to sections, embedded FAQ schema, and internal links to every related piece of content on your site. It’s designed to be the definitive resource on a topic within your market.

    One restoration company built a single pillar page: “The Complete Guide to Water Damage Restoration in [Metro Area].” It covered the entire process—from discovery to insurance claim to reconstruction. It included local permit requirements, average cost data from their own projects, a timeline by damage category, and a section addressing every question from the top 20 “People Also Ask” results for their target keywords.

    That single page now ranks #1 for 23 keyword variations and generates 40-60 leads per month. At their close rate and average job value, it’s a $40,000/month page. One page.

    The secret isn’t the word count. It’s the information density, the local specificity, and the structural internal linking that passes authority from every spoke page back to this hub. The page ranks because the entire site architecture supports it.

    Editorial Planning: The Calendar That Prints Money

    The highest-performing restoration content strategies I’ve seen run on 90-day editorial calendars mapped to three inputs: keyword opportunity data, seasonal demand patterns, and competitive gaps.

    Keyword opportunity data tells you which topics have search volume with achievable competition. In restoration, this often reveals surprising opportunities—”dehumidifier rental [city]” might have 500 searches/month with almost no competition, while “water damage restoration [city]” has 2,000 searches/month with 40 competitors fighting over it.

    Seasonal demand patterns tell you when to publish. Fire damage content should hit peak indexation before wildfire season. Hurricane preparedness content should publish in May, not August when it’s already too late to rank. Frozen pipe content should go live in September—three months before the first freeze—so Google has time to crawl, index, and rank it before demand peaks.

    Competitive gaps tell you where to aim. If every competitor in your market has water damage content but nobody has published on commercial smoke damage restoration, that’s your lane. If competitors cover residential mold but ignore post-construction mold testing, that’s your lane. The editorial calendar should systematically fill every gap your competitors leave open.

    Internal Linking: The Free Ranking Boost 90% of Restoration Sites Ignore

    Internal linking is the most underutilized ranking factor in restoration SEO. It costs nothing, takes minimal time, and produces measurable ranking improvements—yet nine out of ten restoration sites have broken or nonexistent internal link structures.

    The rules: every new post should link to at least 3-5 existing relevant pages on your site. Every existing page that relates to a new post should be updated with a link to that new post. Hub pages should link to all their spokes. Spokes should link to their hub and to 2-3 sibling spokes. Anchor text should be descriptive and keyword-relevant—”water damage restoration in Houston” not “click here.”

    One company added 150 internal links across 45 existing pages in a single afternoon. Within 30 days, 12 pages that had been stuck on page 2 moved to page 1. The only change was internal linking. No new content. No backlinks. Just connecting the pages that already existed.

    The 12-Month Content Architecture Roadmap
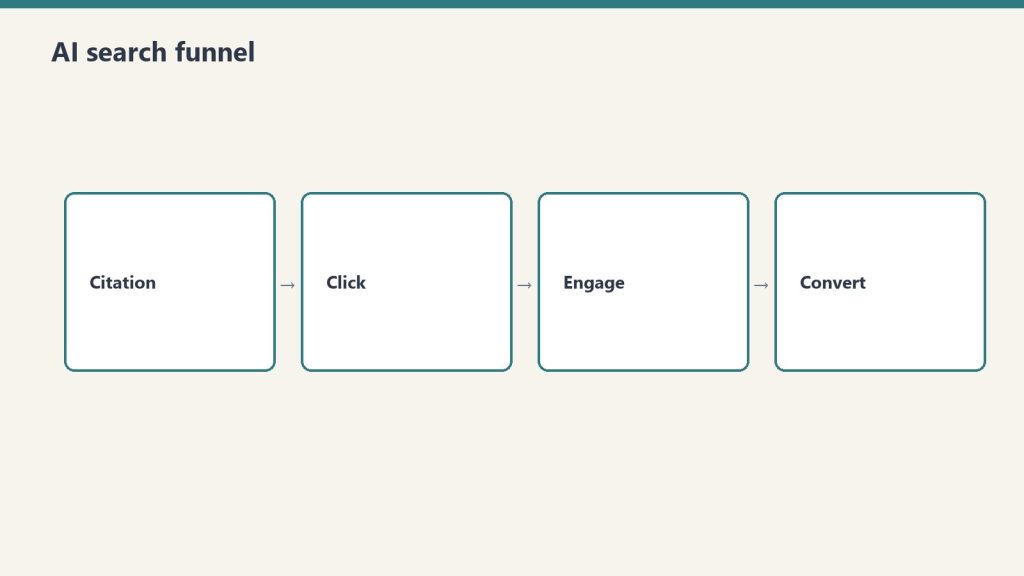
    Four-stage funnel: citation, click, engage, convert
    The 12-month content architecture roadmap.
    Illustration for article: Content Architecture for Restoration Companies: The System That Turns Blog Posts Into Lead Machines

    Months 1-3: Build foundational hub pages for your top 3-4 service categories. Water damage, fire damage, mold remediation, storm damage. Each hub gets a full keyword map and 4-6 initial spoke pages. Implement site-wide internal linking protocol.

    Months 4-6: Build pillar pages for your highest-revenue services. Expand spoke coverage to 10-12 per hub. Begin publishing to your editorial calendar at 2 posts/week minimum. Add FAQ schema to every existing page.

    Months 7-9: Attack competitive gaps identified in your editorial calendar. Build spoke pages for long-tail keywords your competitors don’t cover. Update and expand existing content with new data, seasonal information, and additional internal links.

    Months 10-12: Measure, optimize, consolidate. Identify underperforming content and either improve it or redirect it. Double down on the topics driving the most leads. Build your year-two calendar based on 12 months of performance data.

    This isn’t a content strategy. It’s a content architecture. The difference is that architecture is permanent. Strategy changes with the wind. Architecture compounds.

    Visual summary

    Editorial illustration for Content Architecture for Restoration Companies: The System That Turns Blog Posts Into Lead Machines - Tygart Media AI-generated visual
    AI-generated editorial illustration — Vertex AI Imagen 4 Standard

    About this image. This image was generated by Google’s Vertex AI Imagen 4 model as the featured visual for Content Architecture for Restoration Companies: The System That Turns Blog Posts Into Lead Machines . Every image in the Tygart Media visual library is AI-generated, converted to WebP for optimal performance, and enriched with IPTC/XMP metadata for search engine discoverability.

    • Model: Vertex AI Imagen 4 Standard (imagen-4.0-generate-001)
    • Format: WebP (quality 90)
    • Aspect Ratio: 16:9
    • Metadata: IPTC/XMP injected (title, description, creator, rights, location)
    • Creator: Tygart Media — tygartmedia.com

    Part of The Studio collection — AI-generated visuals powering the Tygart Media content engine.

  • The $250-Per-Click Reality: How Restoration Companies Win (and Lose) at Google Ads

    The $250-Per-Click Reality: How Restoration Companies Win (and Lose) at Google Ads

    Updated October 2026.

    Illustration for article: The $250-Per-Click Reality: How Restoration Companies Win (and Lose) at Google Ads

    The Machine Room · Under the Hood

    Water damage restoration keywords hit $250 per click in 2026. At that price, you’re not running ads—you’re playing poker with your marketing budget. And most restoration companies are losing.

    I come from a world where $50 CPCs were considered extreme. Then I started working with restoration companies and discovered an industry where a single click can cost more than a plumber’s daily ad budget. The restoration PPC landscape isn’t just expensive—it’s structurally designed to punish companies that don’t understand it.

    Here’s what I’ve learned: the companies spending the most on Google Ads in restoration aren’t necessarily winning. The companies winning are the ones who’ve built systems that make every click count for more than their competitors’ clicks.

    The Real Cost of Restoration PPC in 2026

    Chart of restoration Google Ads cost per click by market in 2026
    The real cost of restoration PPC in 2026.

    Let’s put actual numbers on the table. “Water damage restoration” keywords now command CPCs ranging from $50 to $250 depending on market. Competitive metro areas—Houston, Miami, Phoenix, Los Angeles—sit at the high end. Mid-market cities like Sacramento, Nashville, and Tampa run $80-$150.

    At these prices, a typical water damage job takes 3-5 clicks to convert. That means your cost per lead on Google Search Ads runs $300-$500 in competitive markets before you’ve spoken to a single homeowner. Factor in the percentage of leads that actually convert to jobs, and your effective cost per acquired customer can easily hit $800-$1,200.

    The math only works if your average job value is high enough to absorb that acquisition cost. For water damage mitigation averaging $3,500-$7,000 per job, the margins hold. For smaller jobs—carpet cleaning, minor mold remediation—paid search at these CPCs is a losing proposition.

    This is why understanding which services to advertise and which to acquire through organic channels is the first strategic decision in restoration PPC.

    What is Google Ads really costing you?

    Put in your numbers. We’ll do the uncomfortable math.

    Industry medians for context: restoration CPCs run $90–$250+ in competitive metros; the median Google Ads cost per lead is $645 (top performers: $353). Local Services Ads average ~$156 per water-damage lead. Sources: 99calls 2026 benchmarks, DUO Digital 2026, WebTonic 2026.

    2026 Google Ads benchmarks by restoration job type (source: 99calls, September 2026)
    Job typeAvg. CPCClick-to-leadCost per lead
    Water damage restoration$80.4413.2%$610
    Water mitigation / extraction$83.1314.8%$560
    Fire & smoke damage$80.2911.4%$705
    Flood / flooded basement$70.6612.0%$585
    Emergency / 24-hour$80.4116.0%$500
    Sewage cleanup$61.2311.7%$525
    Mold remediation$21.0112.6%$165

    Google Local Services Ads: The Channel Most Restoration Companies Underuse

    Google Local Services Ads versus traditional search ads for restoration leads
    Google Local Services Ads — the channel most underuse.

    Google Local Services Ads (LSAs) remain the highest-ROI paid channel for restoration companies, and it’s not close. LSA leads cost $35-$100 each—a fraction of standard search ads. They appear above traditional paid results. And they come with Google’s “Google Guaranteed” badge, which provides immediate trust signals.

    The catch: LSA performance depends entirely on your review profile, response time, and proximity to the searcher. Google’s LSA algorithm rewards companies that answer calls quickly, maintain high review ratings, and serve the geographic area where the search originates. You can’t buy your way to the top of LSAs the way you can with search ads. You earn it through operational excellence.

    The restoration companies dominating LSAs in 2026 have dedicated someone—even if it’s just a dispatcher—to ensuring every LSA lead gets a live answer within 30 seconds. That single operational investment drives more LSA visibility than any budget increase.

    Quality Score: The Hidden Discount Most Restoration Companies Don’t Know Exists

    Google charges different companies different prices for the same keyword. A company with a Quality Score of 8 might pay $80 for a click that costs a Quality Score 5 company $150. Same keyword, same market, same time of day. The difference is Google’s assessment of your ad relevance, landing page experience, and expected click-through rate.

    Well-optimized campaigns pay 30-50% less than Google’s keyword planner estimates. That discount compounds across every click, every day, every month. Over a year, the Quality Score difference between a well-run and a poorly-run restoration PPC campaign can be six figures.

    Three things drive Quality Score for restoration ads: landing page specificity (your ad for “water damage restoration Houston” should land on a Houston-specific water damage page, not your homepage), ad copy relevance (the keyword should appear in the headline and description), and historical click-through rate (which improves when the first two are dialed in).

    The Landing Page Problem Nobody Talks About

    Most restoration companies send PPC traffic to their homepage or a generic services page. This is the most expensive mistake in restoration digital marketing.

    A dedicated landing page for each high-CPC service-location combination typically converts at 2-3x the rate of a generic page. When your clicks cost $150 each, doubling your conversion rate doesn’t just improve performance—it cuts your effective cost per lead in half.

    Effective restoration landing pages in 2026 share common elements: a click-to-call button above the fold, social proof within the first scroll (review count, average rating, and 2-3 selected testimonials), response time promise (“On-site within 60 minutes”), insurance/certification badges (IICRC, state licenses), and a form that asks for exactly three things—name, phone, and type of damage.

    Every additional form field reduces conversion rate by roughly 10-15%. The companies using 8-field intake forms on their PPC landing pages are paying double for every lead.

    Microsoft Ads: The Restoration Industry’s Overlooked Channel

    Microsoft Ads (Bing) captures roughly 8-12% of search volume depending on the market. The CPCs are typically 30-40% lower than Google for the same keywords. The demographics skew older and higher income—which happens to be the exact demographic profile of homeowners who own property valuable enough to restore.

    Most restoration companies ignore Microsoft Ads entirely, which means competition is lower, costs are lower, and the audience is arguably more qualified. Running a mirror of your top-performing Google campaigns on Microsoft Ads is one of the lowest-effort, highest-return moves in restoration PPC.

    Retargeting: Converting the 95% Who Didn’t Call

    Landing page checklist for restoration PPC campaigns
    Retargeting — converting the 95% who didn’t call.

    The average restoration PPC landing page converts 5-8% of visitors. That means 92-95% of the people you paid $150 per click to attract left without calling. Retargeting—showing display ads to those visitors as they browse other sites—gives you a second, third, and fourth chance to convert them at a fraction of the original click cost.

    Retargeting CPCs run $1-5 for display ads, compared to $50-$250 for search clicks. Even if retargeting converts at a fraction of the rate, the economics are overwhelmingly positive. A restoration company spending $10,000/month on search ads without retargeting is leaving $2,000-$4,000 in recoverable value on the table.

    Spending five figures a month to rent your leads? We build the organic engine that compounds — Google Business Profile, local pages, and AI-search visibility that keeps working after the ad budget stops. Get your $97 visibility scan →

    The $10.50 Rule and When to Walk Away

    Industry data shows successful restoration PPC campaigns return roughly $10.50 for every $1 invested. That’s the benchmark. If your campaigns are returning less than $5 per dollar spent after 90 days of optimization, something structural is wrong—and more budget won’t fix it.

    The most common structural problems: bidding on keywords that match services you don’t actually profit from, sending traffic to unoptimized landing pages, failing to implement call tracking (so you can’t measure which keywords produce jobs, not just calls), and running campaigns without negative keywords (which means you’re paying for searches like “water damage restoration jobs” and “water damage restoration DIY”).

    Fix the structure before you scale the spend. Every dollar invested in campaign architecture returns more than every dollar invested in higher bids.

    Frequently asked questions

    How much does Google Ads cost for restoration companies?

    Water damage keywords run $50-$250 per click depending on market — Houston, Miami, Phoenix, and Los Angeles sit at the high end; Sacramento, Nashville, and Tampa run $80-$150. Expect $300-$500 per lead in competitive markets before you’ve spoken to a single homeowner.

    What is a good return on ad spend for restoration PPC?

    Successful campaigns return roughly $10.50 for every $1 invested. If you’re under $5 per dollar after 90 days of real optimization, something structural is wrong — usually Quality Score, landing pages, or match types, not budget.

    Are Microsoft Ads worth it for restoration companies?

    Yes, as a second channel. Microsoft Ads hold roughly 8-12% of search volume with CPCs typically 30-40% lower than Google for the same keywords, and the audience skews older and higher-income — good traits for emergency home services.

    How do I lower my restoration cost per click?

    Quality Score is the lever most companies ignore. Service-location landing pages, keyword-matched ad copy, and strong click-through rates routinely cut what you pay 30-50% versus Google’s keyword planner estimates. Over a year, that gap can be six figures.


    THE RESIDENTIAL-TO-COMMERCIAL BRIDGE · PART 3 OF 3

    Marketing: move budget from residential clicks to commercial relationships

    At $250 a click, residential Google Ads is a treadmill. Commercial work comes from relationships, reputation, and the credentials and compliance that back them up. Start the bridge from the beginning:

    ← Part 1: Training — the certification roadmap

    ← Part 2: Compliance — the TPA Readiness Checklist

    Visual summary

    Visual metaphor comparing paid search spending versus organic content growth for restoration companies
    AI-generated editorial illustration — Vertex AI Imagen 4 Standard
    Editorial illustration for The $250-Per-Click Reality: How Restoration Companies Win (and Lose) at Google Ads - Tygart Media AI-generated visual
    AI-generated editorial illustration — Vertex AI Imagen 4 Standard

    About this image. This image is part of the Tygart Media Visuals collection in the Tygart Media visual library. Every image produced by Tygart Media is AI-generated using Google Vertex AI (Imagen), converted to WebP format, and injected with full IPTC/XMP metadata before publication. This image was generated by Google’s Vertex AI Imagen 4 model as the featured visual for The $250-Per-Click Reality: How Restoration Companies Win (and Lose) at Google Ads. Every image in the Tygart Media visual library is AI-generated, converted to WebP for optimal performance, and enriched with IPTC/XMP metadata for search engine discoverability.

    • Format: WEBP
    • Collection: Tygart Media Visuals
    • Pipeline: Vertex AI Imagen → WebP → IPTC/XMP → WordPress
    • Model: Vertex AI Imagen 4 Standard (imagen-4.0-generate-001)
    • Format: WebP (quality 90)
    • Aspect Ratio: 16:9
    • Metadata: IPTC/XMP injected (title, description, creator, rights, location)
    • Creator: Tygart Media — tygartmedia.com

    Part of The Studio collection — AI-generated visuals powering the Tygart Media content engine.