AI in Restoration - Tygart Media

Category: AI in Restoration

AI is already in estimating, content, and storm planning. This shelf separates what works in a restoration company from the noise.

  • Restoration CRM Strategy: Build a Zero-Cost Referral Engine

    Restoration CRM Strategy: Build a Zero-Cost Referral Engine

    The Restoration Industry Spends $400 a Lead and Then Never Talks to Those People Again
    Seven cards naming common AI chatbot failure modes
    Spending on leads and never talking to those people again.

    PPC campaigns. Direct mail. Google Local Services Ads. Storm chasers working neighborhoods after a weather event. The average restoration company spends somewhere between $150 and $500 to acquire a single qualified lead — and in some markets, especially water and fire, that number climbs higher. The industry has an entire ecosystem built around lead generation: lead brokers, referral networks, preferred vendor programs, adjuster relationships cultivated over years of lunches and golf rounds.

    And then a homeowner files a claim, you do the work, you get paid, and you never talk to them again.

    Not because you don’t want to. Because nobody told you what to say.

    That is the problem this article is going to solve — not just for homeowner re-engagement, but for your entire database. Adjusters, agents, vendors, subs, referral partners, past employees, community contacts. Every person who has ever touched your business in any way is sitting in a CRM that you treat like a ledger instead of a community. This article is about changing that, and it starts with the most counterintuitive entry point in restoration marketing: your next job posting.


    What Is a CRM Community and Why Restoration Companies Don’t Have One

    A community is a group of people who feel connected to something beyond a single transaction. Your past homeowner clients paid you, possibly during the worst week of their year. They watched your crew work. They saw how you handled their insurance company. They know your company name. If you did good work, they have a positive association with your brand that most businesses spend years trying to build.

    That is not a lead. That is a community member who doesn’t know they’re in a community.

    The reason restoration companies don’t leverage this is structural. The industry is built around reactive demand — you don’t have time to do relationship marketing when the phone is ringing after a storm. Your sales process is built around the claim cycle, not around the customer lifetime. And when it’s quiet, the instinct is to spend on advertising to generate the next job, not to re-engage the people you already served.

    But there’s a second reason, and it’s more fundamental: most restoration companies don’t believe they have a valid, non-salesy reason to contact past clients.

    They do. They just don’t know it yet.


    The Hiring Email: The Best Marketing Touch You’re Not Sending

    Here is the scenario. You need to hire a crew lead. You post on Indeed. You get 40 applications, most of which don’t match what you need, and you spend three hours screening.

    Now here is the alternative. You open your CRM. You pull every contact in your service area — homeowners, adjusters, agents, vendors, subs, anyone local. You send a single email. The subject line is something like: “We’re growing — know anyone looking for a great job in the trades?”

    The email is short. It says you’re hiring for a specific position. It says you value the relationship you have with them. It says if they know anyone — a family member, a friend, someone in the trades looking for a stable company with a good culture — you’d love a direct introduction. No application portal. Just an email back to you.

    That email does four things simultaneously that no advertising spend can replicate:

    1. It reminds your past clients you exist — without selling them anything
    2. It makes them feel respected — you’re asking their opinion, not their money
    3. It positions your company as growing and healthy — companies that are struggling don’t hire
    4. It creates a genuine two-way relationship moment — they can actually help you

    For your insurance contacts — adjusters and agents — it signals something even more powerful. It says you’re a company that is serious about quality people, that you care about your workforce, and that you think of them as partners in your business rather than just referral sources to be harvested.

    The cost of this email campaign: the time it takes to write one email and hit send. The leads you generate from the replies and referrals: free. The brand impression you leave on every person who opens that email: priceless in an industry where word-of-mouth still drives a significant percentage of residential work.


    The Vendor and Supplier Ask: Operational Needs as Community Touchpoints

    The hiring email is the entry point. But once you internalize the underlying principle — that your database wants to help you when asked the right way — you realize how many legitimate reasons you have to contact them.

    You’re looking for a reliable drywall sub in your market. You need a specialty cleaning supplier for a specific job type. You’re trying to source a vendor for an event you’re hosting. You’re looking for a trusted electrician or HVAC contractor to refer to clients after the remediation is done.

    Every one of these is a real business need. And every one of them is a valid reason to reach out to your database.

    “Hey, we’ve got a large commercial project coming up and we’re looking for a reliable drywall sub who does quality work. Do you know anyone in the area?”

    That message, sent to 500 people in your CRM, will generate responses. Some of them will be recommendations. Some of them will lead to subcontractor relationships that serve you for years. But every single one of them will reinforce that your company is active, growing, and doing interesting work — and that you value the people in your network enough to ask them first.

    Your adjusters and agents will forward that message to people they know. Your past homeowners will think of you as a company that is embedded in their community. Your vendors and subs will feel like partners rather than line items.


    Why Past Homeowner Clients Are Your Most Underutilized Asset
    Three cards for field SOPs, owner prompts, and KPI rhythm in an operations kit
    Why past homeowner clients are your most underutilized asset.

    This is the one that most restoration companies are leaving the most money on the table with, and it deserves its own focus.

    A homeowner who used your services has a profile that no amount of advertising can manufacture. They experienced a property damage event. They navigated a claim. They worked with a restoration company — yours — and if it went well, they came out the other side with a specific, emotional memory of your brand. They are also, statistically, likely to experience another property damage event in their lifetime. Water damage recurs. Roofs age. Mold finds new moisture sources.

    And they have neighbors, family members, and friends who will experience property damage events and who will ask them: “Do you know a good restoration company?”

    That referral question is the single most valuable marketing moment in residential restoration. And the answer depends entirely on whether your company is still alive in that homeowner’s memory when the question gets asked.

    The hiring email keeps you alive. The vendor ask keeps you alive. The event invitation keeps you alive. Any legitimate, non-salesy touchpoint that reminds them you exist — without asking them for anything except their opinion or their help — keeps you alive in that mental file where they store “companies I trust.”

    Most restoration companies let that file go cold within six months of project completion. The ones who don’t are the ones with referral pipelines that their competitors can’t explain.


    The Full Taxonomy of Legitimate Outreach Triggers
    Three panels showing one problem, three options, one recommendation
    The full taxonomy of legitimate outreach triggers.

    Once you start thinking this way, the opportunities multiply. Here is a working list of reasons you can legitimately contact your entire database — not a fake reason, not a manufactured excuse, but a genuine business moment that also happens to be a marketing touch:

    People Needs

    • Hiring for any position (crew, admin, estimator, project manager)
    • Looking for a skilled subcontractor in a specialty trade
    • Seeking someone who speaks a specific language for a growing market segment
    • Looking for a part-time administrative or customer service person

    Vendor and Supplier Needs

    • Sourcing a new supplier for a product line you’re adding
    • Looking for a caterer or venue for a company event
    • Seeking a vendor for branded merchandise or uniforms
    • Looking for a commercial cleaning partner for office maintenance

    Community and Knowledge Needs

    • Asking for feedback on a new service you’re considering
    • Sharing an educational resource (storm prep checklist, winter maintenance guide) with no CTA other than “thought you’d find this useful”
    • Inviting them to a community event, open house, or educational workshop
    • Asking them to be a case study or share their experience (with their permission)

    Recognition and Relationship

    • Congratulating them on something (new business, local award, personal milestone you’re aware of)
    • Checking in after a major weather event in your area to make sure they’re okay
    • Sharing a company milestone (anniversary, certification, new service area) that reflects positively on your brand

    None of these require a sales pitch. None of them should have a sales pitch. The moment you attach a CTA to a relationship email, you’ve converted it from a community touch into a marketing email, and people feel the difference immediately.


    The Math That Makes This a Strategy, Not a Tactic

    Let’s run a simple scenario. A restoration company has been operating for five years. They’ve completed 600 jobs. Their CRM has 600 homeowner contacts plus 200 industry contacts (adjusters, agents, vendors, subs) — 800 total, all local, all warm.

    They send a hiring email. Open rate for a warm, local database is typically 30–45%. That’s 240–360 people who see your company name, read that you’re growing, and think about you for 30 seconds. Some reply. A handful refer someone. Maybe you hire one person from a referral.

    But here’s what actually happened: 300 people just got a brand impression from your company for free. Some percentage of those people will have a neighbor ask them about restoration services in the next 12 months. Some of them are adjusters who are looking at your brand name right as they’re assigning a claim. Some of them are agents who are going to recommend a restoration company to a client next week.

    Now do this four times a year. Hiring email in Q1. Vendor ask in Q2. Educational resource in Q3. Company milestone or community event in Q4. You’ve touched your entire warm database four times in twelve months for the cost of an email platform and a few hours of writing time.

    Your $400-per-lead PPC campaign cannot buy what that touch cadence builds.


    The System: Building a CRM Touch Calendar for Restoration

    The reason most companies don’t do this is not lack of intention. It’s lack of system. When you’re running jobs, managing crews, handling supplements, and fighting with adjusters, a quarterly email to your database is not going to happen unless it is on a calendar with an owner and a template.

    Here is the minimum viable system:

    Step 1: Segment your CRM. You need at minimum three segments: past homeowner clients (local), industry contacts (adjusters, agents, PAs), and trade contacts (vendors, subs, partners). Each segment gets slightly different framing on the same message. The homeowner version of the hiring email is warmer and more personal. The adjuster version is more professional. The sub version is peer-to-peer.

    Step 2: Build a 12-month touch calendar. Map out the four to six touches you’ll make this year before the year starts. Assign each one a trigger type from the taxonomy above. Some will be tied to real business events (when you actually hire); others can be evergreen (the educational resource can go out every January before storm season).

    Step 3: Write the templates. The hiring email template takes 30 minutes to write and can be reused every time you hire. The vendor ask template takes 20 minutes. Once these exist, the execution cost per touch is near zero.

    Step 4: Track the signal. Every reply is signal. Every referral is data. Every response from an adjuster who says “hey, I was just thinking about you” is a relationship that needed warming. Build a simple log of who responded and what they said. Over time, this becomes the most valuable intelligence you have about which contacts are actually in your community.


    What This Builds Over Time

    The companies in the restoration industry that win long-term referral pipelines are not necessarily the ones with the best Google rankings or the highest review counts. They are the ones whose name comes to mind first when someone needs to make a recommendation.

    Top-of-mind awareness in a local market is not built by advertising. It is built by presence. Consistent, relevant, human presence in the lives of people who already know you.

    Your CRM is not a list of people who used you once. It is a network of people who have direct, personal experience with your company — and who, with the right cultivation, will become the distributed sales force that no lead broker can compete with.

    The next time you post a job opening, send the email. See what happens. Then do it again with the vendor ask. Then again with the educational resource. By the time you’ve done it four times, you will have a community. And your competitors will still be paying $400 a lead to meet people who have never heard of them.


    Frequently Asked Questions

    Is it appropriate to email past homeowner clients for non-service reasons?

    Yes, provided the contact is warm (they’ve done business with you), the reason is genuine (you actually are hiring), and there’s no sales pitch attached. A hiring email or a vendor referral ask is a human, peer-level communication — not marketing spam. Most recipients appreciate being asked for their opinion or their help.

    How often should a restoration company contact their CRM?

    A minimum of four times per year is enough to maintain top-of-mind awareness without overwhelming contacts. Six times per year is sustainable if each touch has a genuine trigger. More than monthly for a non-service communication risks feeling like a marketing list rather than a community relationship.

    What email platform should I use for CRM outreach?

    Any standard email marketing platform (Mailchimp, Constant Contact, HubSpot, or even your CRM’s built-in email) works for this. The key is segmentation capability (homeowners vs. industry contacts vs. trade contacts) and basic analytics (open rate, click rate) so you can see who’s engaging.

    What if we don’t have a formal CRM?

    Start with what you have. Even an exported list of completed jobs from your job management software, sorted by zip code and filtered to local contacts, is a CRM. The strategy works with a spreadsheet and a Mailchimp free account. Build the system around the behavior, not the tool.

    Should the hiring email come from the owner or from HR?

    From the owner, always, for homeowner and industry contacts. The personal relationship was built on the owner’s credibility. A generic HR communication breaks the human connection that makes this work. For trade contacts, a project manager or ops lead can send it credibly.

    What happens if someone unsubscribes?

    Respect it, honor it immediately, and don’t worry about it. Unsubscribes from a warm database are typically low (under 2%) when the content is relevant and non-salesy. The people who unsubscribe were unlikely to refer you anyway. The people who stay are your community.

    Can this strategy work for commercial restoration clients as well?

    Yes, with modified framing. Commercial contacts (property managers, facility directors, HOA boards) respond well to vendor sourcing requests, educational content on maintenance and prevention, and event invitations. The hiring email works in commercial too — facility managers often know trades workers in their buildings or communities.


  • Restoration Documentation: The Real Role of RH and GPP

    Restoration Documentation: The Real Role of RH and GPP

    Andy McCabe published something sharp recently, and my first instinct was to push back.

    His post was direct: RH and GPP have nothing to do with your dehumidifier calculation. The ANSI/IICRC S500 doesn’t use them. TPAs are weaponizing them to deny equipment that’s legitimately justified by the actual standard. His argument is airtight, and I told him so in the comments — after I pushed back on one thing.

    Here’s the double take I had to do.

    What McCabe Got Right About Equipment Justification

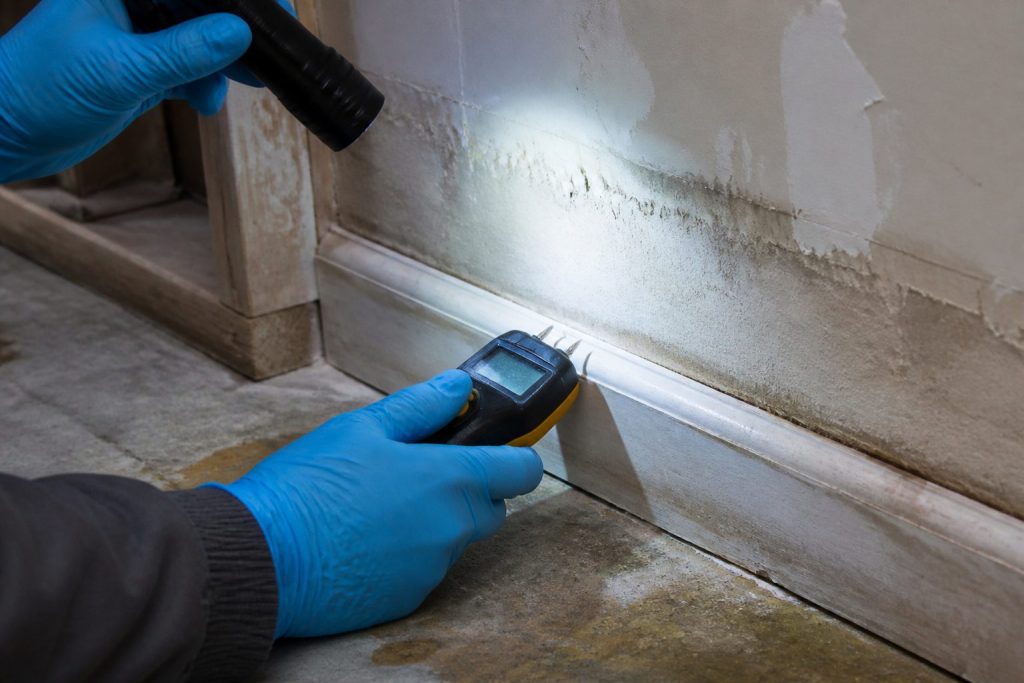
    Gloved hands using a pin-type moisture meter on wet drywall during inspection
    What McCabe got right about equipment justification.

    The S500 Simple Method is not ambiguous. Dehumidifier calculations start with the cubic footage of affected air in each drying chamber, the class of water loss, and the type of equipment on the truck. A Class 2 loss with an LGR uses a factor of 50 to establish a minimum pint-per-day baseline. A Class 1 uses 100. A Class 3 uses 40. Desiccants are calculated in air changes per hour entirely.

    What you will not find anywhere in that calculation: a field for relative humidity. Or grains per pound.

    When a TPA tells you they won’t approve a dehumidifier because RH isn’t at 70%, they’ve invented a threshold that doesn’t exist in any published standard. McCabe’s response to that Liberty Mutual TPA was exactly right: “What standard is that?” They pointed to their own internal guidelines. Not the S500. Not IICRC. Their guidelines.

    That’s the game — and leading your documentation with atmospheric readings as the justification for your equipment is handing them the tool they use to deny you.

    Stop justifying equipment with RH and GPP. The S500 math is your argument. Use it.

    What I Pushed Back On — and Then Reconsidered

    When I responded to McCabe’s post, I drew on years at Polygon/Munters doing large-loss drying — aircraft carrier decks, document archives, new high-rise commercial construction mid-build. In those environments, RH, GPP, and temperature weren’t optional reads. They were the difference between a completed job and a catastrophic materials failure.

    I’ve seen what happens when you dry too aggressively. And I’ve seen the liability that follows.

    The more I sat with it, the more I realized McCabe and I weren’t in conflict. We were talking about two completely different fights happening on the same job.

    The Two-Track Documentation Standard

    Three cards for field SOPs, owner prompts, and KPI rhythm in an operations kit
    The two-track documentation standard.

    Every water loss has two defensible positions that require documentation. Most contractors are only building one of them.

    Track 1: Equipment Justification (McCabe’s Lane)

    Show your dehu calculation per the S500 — cubic footage, drying class, equipment type, the published factor. Show your air mover count based on affected square footage and materials above dry standard. Show moisture readings proving materials haven’t yet reached the established dry standard.

    This documentation defends your equipment billing against TPA denials based on invented atmospheric thresholds. It’s the argument that holds up in a dispute because it’s grounded in a published ANSI standard — not your opinion, not the adjuster’s internal policy.

    Track 2: Materials Science Documentation (The Lane McCabe Didn’t Cover)

    Here’s where atmospheric readings earn their place in your job file — just not as equipment justification.

    Flooring manufacturers explicitly tie warranty coverage to ambient RH maintenance. Hurst Hardwoods voids their warranty if ambient RH drops below 35% during the life of the floor, citing cracking, delamination, and shrinkage as direct consequences of low humidity. Engineered hardwood manufacturers commonly require 30–50% RH maintenance and list surface checking from improper humidity as an explicit warranty exclusion. Even SERVPRO’s own published guidance notes that rapid drying can cause wood to split.

    This isn’t theoretical. When you dry too aggressively — pushing humidity below manufacturer-specified ranges, running heat drying beyond material tolerances, pulling GPP down faster than the materials can handle — you can void the warranty on floors, adhesives, and engineered wood products that weren’t even damaged by the water event itself.

    Now the homeowner has a materials failure claim three months after you packed out. And the carrier has a documented argument that the damage was caused by the restoration, not the loss.

    Your atmospheric logs are your proof that you didn’t do that.

    What This Looks Like in Practice

    Three panels showing one problem, three options, one recommendation
    What this looks like in practice.

    The documentation standard that protects you on both tracks looks like this:

    For equipment: S500 dehu calculation showing class, cubic footage, equipment type, and the published factor. Air mover count tied to affected square footage and material readings above dry standard. Nothing about RH or GPP as justification.

    For materials: Continuous atmospheric logs showing that ambient RH stayed within the manufacturer-specified range for every material type on-site throughout the dry. Temperature logs showing you didn’t apply excessive heat. A record that proves you dried professionally, not just fast.

    One set of data protects you from equipment denials. The other protects you from being blamed for the cracked hardwood, delaminated adhesives, and voided warranties that surface after you’re gone.

    The Bottom Line

    Andy McCabe is doing important work calling out the TPA game of inventing atmospheric thresholds to deny legitimately justified equipment. Every restoration contractor should read his post and internalize the S500 math.

    But don’t stop taking atmospheric readings. Stop leading with them as equipment justification — and start filing them as materials science documentation that proves the quality of your work.

    Two fights. Two documentation tracks. Both matter.

    Find more from Andy McCabe at WaterDamageProfit.com.

    Related on Tygart Media: S500 in the van · moisture map Claude skill · jobs as knowledge base.

    Frequently Asked Questions

    Do RH and GPP belong in a dehu calculation?

    No. Per the ANSI/IICRC S500, dehumidifier calculations use cubic footage of affected air, drying class, and equipment type. RH and GPP are not inputs in the S500 Simple Method and should not be used to justify equipment placement.

    Why should restoration contractors still log RH and GPP?

    Atmospheric readings serve as materials science documentation — proof that drying conditions stayed within manufacturer-specified humidity ranges to protect warranty coverage on hardwood floors, adhesives, and engineered wood products. They protect against post-job liability claims, not equipment denials.

    Can aggressive drying void a flooring warranty?

    Yes. Multiple hardwood flooring manufacturers explicitly void warranties when ambient RH drops below 35%, citing cracking, delamination, and shrinkage as direct results. Drying below those thresholds can create a liability exposure on materials that were undamaged by the original water event.

    What is the S500 Simple Method for dehu calculations?

    The ANSI/IICRC S500 Simple Method calculates minimum dehumidifier capacity by dividing the cubic footage of the drying chamber by a factor based on equipment type and drying class. Class 1 uses a factor of 100, Class 2 uses 50, and Class 3 uses 40 for LGR units.

    What should restoration contractors say when a TPA denies equipment based on RH?

    Ask them to cite the published standard their threshold comes from. If they reference an internal guideline rather than the ANSI/IICRC S500, that threshold has no technical standing. Present your S500-based calculation as the documented industry standard for equipment justification.

  • Restoration Niche Pack: IICRC Content SEO & Schema

    Restoration Niche Pack: IICRC Content SEO & Schema

    What Is the Restoration Niche Pack?
    A targeted optimization pass on your 10 highest-traffic restoration posts — injecting IICRC standards references, RIA industry entity signals, EPA mold guidelines, and OSHA citations throughout your content, then adding FAQPage JSON-LD schema on every post. The result: your content reads (and ranks) like it was written by someone who actually knows restoration, not a generic SEO copywriter.

    Why Generic Restoration Content Fails

    Seven cards naming common AI chatbot failure modes
    Why generic restoration content fails.

    Generic restoration content has a tell: it mentions “water damage” and “mold remediation” without ever referencing the IICRC S500 standard, the Restoration Industry Association (RIA), Class 3 water losses, psychrometric calculations, or EPA 402-K-02-003. Google and AI systems both recognize entity-rich industry content as more authoritative than keyword-stuffed generic copy — and so do adjusters and property managers reading it.

    The search engines and AI systems that increasingly control discovery have trained on authoritative industry sources. When your content references the same entities those sources use — IICRC standards, RIA guidelines, ANSI/IICRC S520, EPA remediation thresholds — it reads as part of the same knowledge graph. When it doesn’t, it reads as filler.

    The Restoration Niche Pack injects the named entities that separate expert content from generic content — then adds FAQPage schema so your posts are eligible for the featured snippet placements that restoration queries are increasingly winning.

    What the Pack Covers (Per Post)

    • IICRC entity injection — Relevant standards (S500, S520, S540, S600) referenced naturally within content based on post topic
    • RIA references — Restoration Industry Association signals where applicable
    • EPA citations — Mold remediation guidelines (EPA 402-K-02-003) and relevant environmental standards
    • OSHA references — Worker safety standards for applicable content (asbestos, mold, confined space)
    • Local entity reinforcement — Service area, local licensing bodies, and regional climate/building context
    • FAQPage section + JSON-LD — 5–6 Q&As covering the questions adjusters, homeowners, and property managers actually ask
    • Speakable schema — Key paragraphs marked for voice search and AI synthesis

    The Entity Stack by Restoration Vertical

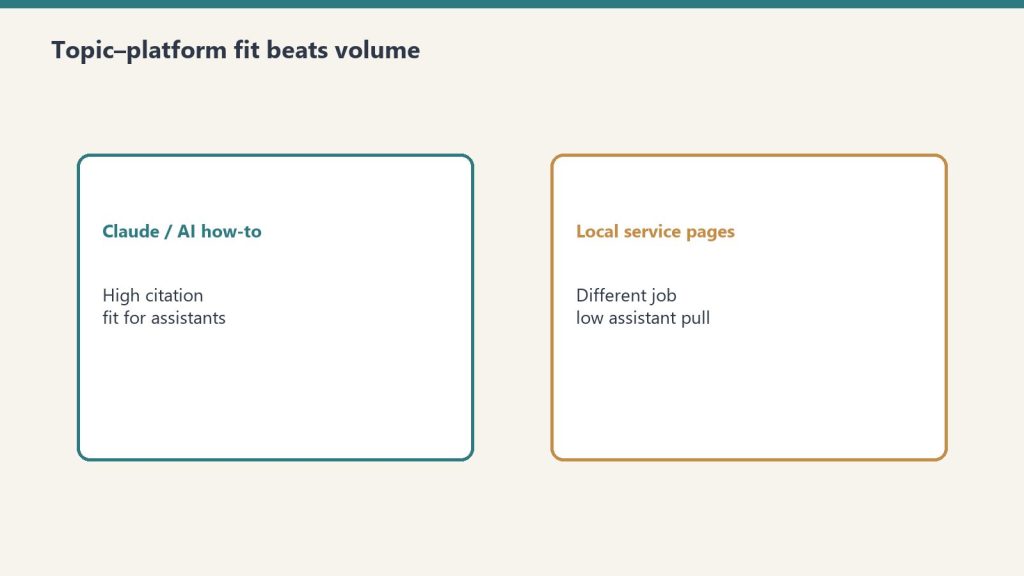
    Comparison of Claude how-to fit versus local service page fit for assistants
    The entity stack by restoration vertical.

    Entity injection is not one-size-fits-all. Each restoration vertical has its own authoritative standards body, regulatory framework, and industry terminology. Here is what gets injected by vertical:

    Water Damage

    The IICRC S500 Standard for Professional Water Damage Restoration is the primary reference — specifically its water damage classification system (Class 1 through Class 4) and contamination categories (Category 1, 2, and 3 water). Content references psychrometric principles, evaporation rates, grain depression calculations, and the role of LGR (Low Grain Refrigerant) dehumidifiers. The Restoration Industry Association (RIA) is cited as the industry advocacy body.

    Mold Remediation

    The IICRC S520 Standard for Professional Mold Remediation provides the remediation protocol framework. EPA 402-K-02-003 (the EPA Mold Remediation in Schools and Commercial Buildings guide) is cited for regulatory context. Content references containment protocols, HEPA air filtration, negative air pressure chambers, and post-remediation verification testing requirements.

    Fire and Smoke Damage

    The IICRC S700 Standard for Professional Fire and Smoke Damage Restoration is the primary standard. Content references smoke residue types (wet, dry, protein, fuel oil), pH-balanced cleaning chemistry, and deodorization protocols including thermal fogging and hydroxyl generation.

    Asbestos and Environmental

    OSHA 29 CFR 1926.1101 governs asbestos work in construction. EPA NESHAP (National Emission Standards for Hazardous Air Pollutants) regulations apply to demolition and renovation work. Content references proper notification procedures, air monitoring, and disposal requirements under applicable state regulations.

    Why FAQPage Schema Matters for Restoration

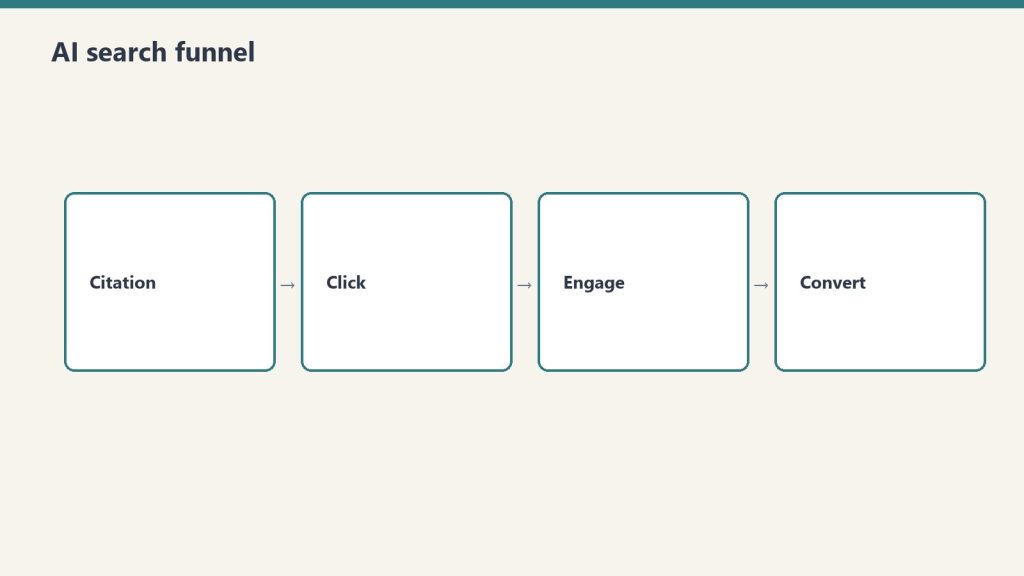
    Four-stage funnel: citation, click, engage, convert
    Why FAQPage schema matters for restoration.

    Restoration queries are intent-rich and question-heavy. “How long does water damage remediation take?” “What does a Category 2 water loss mean?” “Is mold remediation covered by homeowners insurance?” These are not informational queries — they are pre-decision queries from homeowners and property managers about to make a hiring decision.

    FAQPage schema makes your answers eligible for Google’s featured snippets and People Also Ask placements. When your answer appears in position zero for “how long does water damage restoration take,” you have captured the attention of a prospect who hasn’t clicked your competitors yet. The Restoration Niche Pack writes these FAQs around the actual questions your target customers ask — not generic SEO-filler questions.

    AI systems including ChatGPT, Claude, and Perplexity also preferentially cite structured, entity-rich content when answering user questions about restoration topics. A post that references IICRC S500, uses proper industry terminology, and includes a structured FAQ section is significantly more likely to appear in AI-generated answers than generic content covering the same topic.

    Pricing

    Package Posts Price
    Standard Pack 10 posts — entity injection + FAQPage schema $399
    Deep Pack 10 posts — entity injection + FAQPage + speakable + content expansion where thin $699

    Who This Is For

    Restoration companies with an existing WordPress site and at least 10 published posts who are ranking but not converting, or ranking page 2 for queries where page 1 competitors have entity-rich content. Also the right move after a taxonomy rebuild when your content foundation is clean and ready for entity-level optimization.

    The pack works best for companies that have invested in content volume but haven’t yet differentiated it from competitors — the dozens of restoration sites that all say “24/7 emergency water damage restoration” without the entity density that separates expert content from boilerplate.

    What the Pack Does Not Include

    The Restoration Niche Pack optimizes existing content — it does not write new posts. It does not include technical SEO audits, site speed optimization, or link building. It is specifically an entity injection and schema markup operation on your existing highest-traffic posts. If your site needs new content, the Fractional AI Content Infrastructure service covers the full content production stack.

    Get IICRC Entities and FAQPage Schema on Your Top 10 Posts

    Share your restoration site URL. We’ll identify your 10 best candidates and confirm the pack scope before you commit.

    → will@tygartmedia.com

    Email only. No commitment to reply. Turnaround quoted within 1 business day.

    Frequently Asked Questions

    Does this work for all restoration verticals (water, fire, mold, asbestos)?

    Yes — the entity set is adapted by vertical. Water damage posts get IICRC S500 and psychrometric references. Mold posts get EPA 402-K-02-003 and IICRC S520. Fire/smoke posts get IICRC S700. Asbestos posts get OSHA and EPA NESHAP references.

    Will this change the readability of my existing content?

    Entity injection is contextual — we add entities where they fit naturally, not as a keyword list. Most readers won’t notice the additions. What they’ll notice is that the content sounds more authoritative.

    Does the FAQ content get written fresh or pulled from existing content?

    For the Standard Pack, FAQs are written fresh based on the post topic and the questions your target audience actually searches. For posts that already have Q&A sections, we upgrade the existing questions and add schema rather than replacing them.

    How long does the Restoration Niche Pack take to complete?

    Standard Pack turnaround is 3–5 business days after site access is provided. Deep Pack turnaround is 5–7 business days. All work is done via WordPress REST API — no plugin installs or CMS access required beyond application password credentials.

    Do I need a specific SEO plugin for the schema to work?

    No plugin is required. Schema is injected as JSON-LD script blocks in post content, which is the method Google recommends and which works independently of Yoast, RankMath, or any other SEO plugin. If you have an SEO plugin, we check for conflicts before injection.

    Last updated: June 2026

  • Restoration Golf League Setup: B2B Contractor Networking

    Restoration Golf League Setup: B2B Contractor Networking

    Tygart Media / Content Strategy
    The Practitioner JournalField Notes
    By Will Tygart
    · Practitioner-grade
    · From the workbench

    What Is a B2B Golf League for Trade Industries?
    A B2B golf league is a structured networking vehicle — not a scramble, not a charity event — designed to put contractors, adjusters, property managers, vendors, and referral partners on the same course repeatedly throughout a season. The relationship is the product. Golf is the excuse. The deals happen in the cart.

    Cold outreach in the restoration industry has a near-zero response rate. Trade shows are expensive and transactional. Referral relationships — the ones that produce consistent work — are built over time, in informal settings, with people who have chosen to spend 4 hours with you.

    The Restoration Golf League (RGL) is a restoration industry golf network active in the Pacific Northwest — one we sponsor and participate in as a B2B networking vehicle. It was built to solve a specific problem: how does a small restoration operator build relationships with adjusters, property managers, and general contractors without a sales team or a trade show budget? The answer turned out to be a golf league format that runs April through October.

    We’ve now documented the model so other trade operators can replicate it in their market.

    Who This Is For

    Three cards for field SOPs, owner prompts, and KPI rhythm in an operations kit
    Who the restoration golf league setup is for.

    Restoration company owners, plumbing and HVAC operators, roofing contractors, and commercial flooring companies who sell primarily through relationships and want a repeatable, low-cost way to build and maintain those relationships in their local market. Also works for vendors and suppliers who want ongoing access to contractors.

    What the League Setup Includes

    Seven cards naming common AI chatbot failure modes
    What the league setup includes.
    • Format design — Scoring format, flight structure, handicap system, and round length optimized for business networking (not competitive golf)
    • Player acquisition strategy — Outreach templates, target list structure, LinkedIn and direct outreach playbook for filling the first season
    • Sponsor structure — Hole sponsorship, season sponsorship, and in-kind trade frameworks so the league pays for itself
    • Communication system — Email sequence, text reminder cadence, and post-round follow-up templates
    • Scoring and leaderboard — Simple tracking system that keeps players engaged between rounds
    • Season calendar — 6-round template with tee time blocks, course negotiation guidance, and rain date logic
    • The playbook — Full written documentation of the RGL model adapted to your market and vertical

    What We Deliver

    Three panels showing one problem, three options, one recommendation
    What we deliver.
    Item Included
    Custom league format document for your vertical and market ✅
    Player acquisition outreach templates (LinkedIn + direct) ✅
    Sponsor package deck (customizable) ✅
    Season communication sequence (email + text) ✅
    Scoring tracker (Google Sheets) ✅
    Course negotiation talking points ✅
    90-minute strategy call with Will (RGL sponsor and participant) ✅
    30-day async support through first round ✅

    Ready to Build the Relationship Network Your Competitors Don’t Have?

    Tell us your trade vertical, your market (city/region), and roughly how many relationships you’re trying to build. We’ll tell you if the league model fits.

    → will@tygartmedia.com

    Email only. No commitment to reply.

    Frequently Asked Questions

    Does this only work for restoration companies?

    No. The RGL model was built for restoration but the format works for any trade industry where relationship-based selling drives revenue — roofing, plumbing, HVAC, flooring, commercial cleaning, and specialty contractors all fit the model.

    How many players do you need to run a league?

    A minimum viable league runs with 16 players (4 foursomes). The sweet spot is 24–32 players, which gives you enough variation across rounds that players meet new people each time.

    What does it cost to run the league after setup?

    Highly variable by market and course. The RGL model targets sponsor coverage of all hard costs — green fees, cart fees, and prizes — so the operator’s only expense is time. Most leagues break even or generate modest surplus by season two.

    Do I need to be a good golfer to run this?

    No. The format is designed for mixed skill levels. The operator’s job is logistics and relationship cultivation, not competitive golf. A handicap isn’t required — a willingness to spend time with people is.

    Last updated: April 2026

    Frequently Asked Questions

    How much does it cost to set up a restoration golf league?

    Startup costs typically range from $500 to $2,000 depending on whether you pay for course fees yourself or pass them through to participants. Ongoing per-round costs of $50–$150 per player can be fully sponsored by participating vendors, adjusters, or your own marketing budget. The return on a single adjuster relationship justifies the full annual cost of the league.

    Who should I invite to a restoration golf league?

    The core referral targets are insurance adjusters (independent adjusters and staff adjusters from carriers like Allstate, Travelers, and Farmers), commercial property managers, public adjusters, and general contractors who regularly call in restoration specialists. Subcontractors, equipment vendors, and TPA representatives round out a strong league roster.

    How often should the league play?

    Monthly rounds during the golf season (typically April through October in most US markets) produce enough recurring contact to build genuine relationships without feeling like a sales obligation. A season kickoff scramble and an end-of-season awards event anchor the calendar and create shareable content for social media.

    Is a golf league compliant with insurance regulations on referral arrangements?

    A properly structured golf league — where participation costs are reasonable, attendance is not conditioned on directing work, and no explicit quid pro quo exists — is generally compliant under state insurance referral regulations and RESPA. Consult a compliance attorney in your state before structuring any formal cost-sharing arrangements with adjusters. The goal is relationship-building, not a referral fee mechanism.

    How do I track ROI from a restoration golf league?

    Track referral source on every job intake form. Ask “how did you hear about us” and record the specific person, not just the channel. After two seasons, you will have a clear picture of which league relationships produced closed jobs and what the lifetime value of those referral relationships is. Most operators find that two or three adjuster relationships from a league justify the entire annual cost.

  • RCP Proxy Estimation Guide: How to Calculate When Primary Data Is Missing

    RCP Proxy Estimation Guide: How to Calculate When Primary Data Is Missing

    The Agency Playbook
    TYGART MEDIA · PRACTITIONER SERIES
    Will Tygart
    · Senior Advisory
    · Operator-grade intelligence

    The RCP requires 12 data points per job. In practice, some of those data points will be unavailable — particularly for historical jobs being calculated retrospectively, or for field situations where documentation wasn’t captured as completely as the standard requires. The proxy estimation methodology provides documented substitution methods that produce defensible, auditor-acceptable estimates when primary data is missing.

    Key principle: A documented estimate with a stated assumption is always preferable to a blank field in an RCP report. ESG auditors understand that emissions calculation involves uncertainty — what they require is transparency about where estimation was used and what the basis of that estimation was. Undocumented guesses are not acceptable. Documented proxies are.

    Data Quality Tiers

    The RCP uses three data quality tiers, consistent with GHG Protocol Scope 3 guidance:

    Tier Description Audit Acceptability
    Tier 1 — Primary measured data Actual measurements from job records: GPS mileage, disposal facility receipts with weights, materials purchase orders by job Highest — preferred for all data points
    Tier 2 — Primary estimated data Calculated from documented job parameters using RCP proxy methods: affected area × consumption rate, crew size × duration × unit rate Acceptable — must document calculation method and basis
    Tier 3 — Spend-based / invoice-based proxy Dollar amount × industry average emission factor — the fallback of last resort Lowest — use only when no job-specific data is available; flag prominently in data quality notes

    Proxy Methods by Data Point

    Data Point 1 — Vehicle Mileage (Transportation)

    Primary source: GPS fleet tracking data, dispatch records, driver logs.

    Proxy method: Use Google Maps or equivalent mapping tool to calculate round-trip distance from your facility (or prior job address for multi-stop days) to the job site. Multiply by the number of crew trips documented in time records or invoices. This is a Tier 2 estimate.

    Default proxy (Tier 3, last resort): Industry average mobilization distance for restoration contractors is 22 miles one-way (44 miles round trip). Apply this default only when no address or routing information is available. Note as Tier 3 estimate in data quality section.

    Data Point 2 — Waste Transport Mileage

    Primary source: Waste manifests and hauler receipts (these typically include origin and destination).

    Proxy method: Use the distance from the job site to the nearest licensed disposal facility of the appropriate type (standard C&D landfill, licensed ACM facility, medical waste facility). Use online waste facility directories (EPA RCRA Info for hazmat, state environmental agency databases for C&D landfills) to identify the nearest appropriate facility.

    Default proxies by facility type (Tier 3): Standard C&D landfill: 18 miles. Licensed ACM facility: 60 miles. Licensed PCB incineration: 150 miles. Medical waste facility: 55 miles.

    Data Point 3 — Equipment Power Source

    Primary source: Job documentation noting whether equipment ran on building power or contractor generator; generator fuel logs.

    Proxy method: Default assumption is building electrical supply unless your company policy or the job type (remote location, building power unavailable) indicates otherwise. Note the assumption explicitly. If generator use is suspected but not documented, use the following generator fuel proxy: standard drying equipment setup (3 dehumidifiers + 6 air movers) consuming approximately 2.5 gallons of diesel per 8-hour shift × number of drying days × 10.21 kg CO2e per gallon diesel.

    Data Points 4–5 — Chemical Treatments and PPE Consumption

    Application rate proxies by job type and surface type:

    Job Type / Surface Antimicrobial Rate Tyvek Suits per Tech per Day Glove Pairs per Tech per Day N95/P100 per Tech per Day
    Cat 1 water — porous surfaces 0.008 L/sq ft 0.5 2 0.5
    Cat 2 water — porous surfaces 0.015 L/sq ft 1.0 3 1.0
    Cat 3 water — porous surfaces 0.025 L/sq ft (×2 applications) 2.0 5 2.0
    Mold Condition 3 — first application 0.020 L/sq ft 2.0 4 1.5
    Mold Condition 3 — second application 0.015 L/sq ft 2.0 4 1.5
    Fire — smoke cleaning (chemical sponge + cleaner) 1 sponge per 50 sq ft + 0.010 L/sq ft cleaner 1.5 4 1.5
    Hazmat abatement (Level C, standard exit protocol) N/A (wetting agent: 0.003 L/sq ft ACM) 3.0 (full replacement each exit) 6 2 pairs OV/P100
    Biohazard Level C 0.025 L/sq ft × 2 applications 3.0 (full replacement each exit) 6 2 pairs OV/P100
    Biohazard Level B (decomposition) 0.025 L/sq ft × 2 applications 3.0 Level B full-suit (replace each exit) 6 Supplied air — 0 disposable

    Data Point 6 — Containment Materials

    Proxy method: Standard containment for a single affected room (standard ceiling height 8–10 ft): perimeter of affected area (linear feet) × ceiling height × 1.2 (overlap factor) = m² of poly sheeting. For compartmentalized commercial spaces, add 20 m² per additional doorway or penetration point.

    Zipper doors: 1 per entry/exit point, typically 2 per contained area (entry + equipment pass-through).

    Data Points 7–8 — Waste Volume and Disposal

    Volume proxy: Use weight estimation proxies from the RCP Emission Factor Reference Table (drywall at 2.5 lbs/sq ft, carpet at 3.0 lbs/sq ft, etc.) applied to the demolished area documented in job scope records.

    Disposal method proxy: If disposal facility type is unknown, apply default based on material type: standard C&D for non-contaminated demolition debris, regulated C&D or hazmat for contaminated materials (see Table 3 in the Emission Factor Reference).

    Data Points 9–10 — Demolished and Installed Materials

    Proxy method: Calculate from demolition scope records (affected area by room, material type documented in scope of work or Xactimate/Symbility estimate). Weight estimation proxies apply as above. For installed materials in reconstruction phase, use square footage from scope-of-work documentation and apply standard weight proxies.

    Documenting Proxy Use in Your RCP Report

    Every proxy estimate must be documented in the data quality section of the per-job carbon report. The format for documenting a proxy is: [Data point name]: [Tier 2 or 3 estimate]. [Brief description of proxy method]. [Source of proxy rate or assumption].

    Example: “Vehicle mileage: Tier 2 estimate. Round-trip distance calculated using Google Maps from company facility to job site address (44 miles RT × 4 crew trips). Crew trip count from job invoices. Source: RCP proxy method P-4-1.”

    Example: “PPE consumption: Tier 2 estimate. Cat 3 water damage standard consumption rate applied (2.0 Tyvek/tech/day, 5 glove pairs/tech/day) per RCP Table A-5. Actual PPE not tracked separately on this job.”

    Can a per-job carbon report with all Tier 2 estimates be used in GRESB reporting?

    Yes. GRESB accepts primary data at various quality levels, including documented estimates. A Tier 2 estimate is primary data (not spend-based estimation) and is acceptable. The data quality notation in the RCP report demonstrates that you have applied documented methodology rather than guessing, which is what auditors need to see.

    What is the margin of error typical for Tier 2 proxy estimates?

    Typical uncertainty range for Tier 2 RCP estimates is ±20–35% relative to primary measured data. This compares favorably to spend-based estimation (Tier 3), which typically has ±50–100% uncertainty for restoration work due to the high variability of job type, scope, and emission profile at equivalent invoice amounts.

    Should you disclose the uncertainty range in the per-job carbon report?

    The RCP does not require quantified uncertainty ranges in the per-job report, but noting that Tier 2 estimates were used in the data quality section effectively communicates to auditors that the figure carries inherent estimation uncertainty. For clients whose ESG consultants or auditors specifically request uncertainty ranges, use the guidance values above (±20–35% for Tier 2).


  • RCP Emission Factor Reference Table: All Values in One Place

    RCP Emission Factor Reference Table: All Values in One Place

    The Agency Playbook
    TYGART MEDIA · PRACTITIONER SERIES
    Will Tygart
    · Senior Advisory
    · Operator-grade intelligence

    This reference table consolidates all emission factors used in Restoration Carbon Protocol calculations. It is the lookup document you use when completing a per-job carbon report — every factor needed for Categories 1, 4, 5, and 12 across all five job types is in this table, with source citations for audit purposes.

    Version: RCP v1.0 | Factor vintage: EPA 2024, DEFRA 2024, EPA WARM v16 | Units: All values in kg CO2e unless noted as tCO2e

    Table 1: Category 4 — Vehicle Transportation

    Vehicle Type Fuel kg CO2e per mile Source
    Passenger car Gasoline 0.355 EPA Table 2, Mobile Combustion 2024
    Light-duty truck / work van (under 8,500 lbs GVWR) Gasoline 0.503 EPA Table 2, Mobile Combustion 2024
    Light-duty truck / cargo van Diesel 0.523 EPA Table 2, Mobile Combustion 2024
    Medium-duty truck / equipment trailer (8,500–26,000 lbs GVWR) Diesel 1.084 EPA Table 2, Mobile Combustion 2024
    Heavy-duty truck — unloaded (26,000+ lbs GVWR) Diesel 1.612 EPA Table 2, Mobile Combustion 2024
    Heavy-duty truck — loaded (waste hauling, C&D) Diesel 2.25 EPA Table 2 + load factor adjustment
    Licensed hazmat waste hauler (ACM, lead, general hazmat) Diesel 3.20 EPA Table 2 + hazmat vehicle premium
    Licensed hazmat hauler (PCB, high-hazard specialty) Diesel 3.80 EPA Table 2 + specialty vehicle premium
    Medical waste hauler (biohazard) Diesel 2.80 EPA Table 2 + medical waste vehicle
    Pack-out truck (contents restoration) — loaded Diesel 2.25 EPA Table 2 + load factor
    Pack-out truck — empty (return trip) Diesel 1.612 EPA Table 2 — unloaded heavy

    Table 2: Category 1 — Materials

    Chemical Treatments

    Material Unit kg CO2e per unit Source
    Quaternary ammonium antimicrobial / biocide (liquid) Liter 2.8 EPA EEIO — Chemical manufacturing sector
    Hydrogen peroxide-based antimicrobial/biocide Liter 1.9 EPA EEIO — Chemical manufacturing sector
    Borax-based mold treatment kg 1.1 EPA EEIO — Inorganic chemical manufacturing
    Hospital-grade disinfectant (EPA-registered) Liter 2.8 EPA EEIO — Chemical manufacturing sector
    Enzyme biological digester / deodorizer Liter 1.6 EPA EEIO — Specialty chemical manufacturing
    Encapsulant / smoke-blocking primer Gallon 4.2 EPA EEIO — Paint and coatings manufacturing
    Thermal fogging agent Liter 2.1 EPA EEIO — Chemical manufacturing sector
    Desiccant drying agent (silica gel) kg 1.4 EPA EEIO — Chemical manufacturing sector
    Wetting agent / amended water (surfactant for ACM) Liter 1.4 EPA EEIO — Chemical manufacturing sector
    Dry ice (CO2 pellets for blast cleaning) kg 0.85 EPA EEIO — Industrial gas manufacturing

    Personal Protective Equipment

    PPE Item Unit kg CO2e per unit Source
    Disposable Tyvek suit (Level C) Each 1.2 EPA EEIO — Apparel manufacturing
    Level B full encapsulating suit Each 3.0 EPA EEIO — Apparel/specialty manufacturing
    Level C PPE full kit (Tyvek + gloves + goggles + boot covers) Kit 1.8 Composite of individual items
    Level B PPE full kit (encapsulating suit + supplied air + gloves) Kit 4.2 Composite of individual items
    Nitrile gloves (pair) Pair 0.3 EPA EEIO — Rubber and plastics manufacturing
    N95 respirator (disposable) Each 0.4 EPA EEIO — Medical equipment manufacturing
    Half-face respirator, P100 cartridges (pair) Pair 0.8 EPA EEIO — Medical equipment manufacturing
    Full-face respirator cartridges (pair) Pair 1.2 EPA EEIO — Medical equipment manufacturing
    Boot covers (pair) Pair 0.15 EPA EEIO — Rubber and plastics

    Containment and Filtration

    Material Unit kg CO2e per unit Source
    6-mil polyethylene sheeting m² 0.55 EPA EEIO — Plastics product manufacturing
    4-mil polyethylene sheeting m² 0.37 EPA EEIO — Plastics product manufacturing
    Double-layer 6-mil containment (hazmat/biohazard) m² 1.10 2× single-layer factor
    Zipper door — disposable Each 1.8 EPA EEIO — Plastics/hardware
    Zipper door — reusable (amortized over 20 uses) Use 0.09 1.8 ÷ 20 uses
    HEPA filter — air scrubber (standard) Each 3.2 EPA EEIO — Industrial machinery manufacturing
    HEPA vacuum bag (commercial grade) Each 0.4 EPA EEIO — Paper/plastics manufacturing
    Biohazard bag — 33-gallon red (medical waste) Each 0.65 EPA EEIO — Medical plastics manufacturing
    ACM disposal bag — 6-mil labeled (33-gallon) Each 0.55 EPA EEIO — Plastics product manufacturing
    Sharps disposal container (1-gallon) Each 0.35 EPA EEIO — Plastics/medical equipment
    Glove bag (pipe insulation removal) Each 0.85 EPA EEIO — Plastics product manufacturing

    Table 3: Category 5 — Waste Disposal

    Waste Type Disposal Method tCO2e per ton Source
    Standard C&D debris (non-hazardous mixed) Landfill 0.16 EPA WARM v16
    Cat 2 water-contaminated porous materials Standard landfill 0.18 EPA WARM + contamination premium
    Cat 3 sewage-contaminated materials Regulated C&D landfill 0.22 EPA WARM + regulated disposal
    Smoke-contaminated C&D debris (standard) Standard landfill 0.16 EPA WARM v16
    Smoke-contaminated C&D (regulated facility) Licensed C&D landfill 0.20 EPA WARM + transport premium
    Mold-contaminated porous materials Standard landfill (most jurisdictions) 0.18 EPA WARM + contamination premium
    Friable ACM (pipe insulation, spray fireproofing) Licensed hazmat landfill 0.42 EPA WARM + licensed facility + transport
    Non-friable ACM (floor tiles, roofing, joint compound) Licensed C&D with ACM cell 0.28 EPA WARM + regulated C&D transport
    Lead paint debris (TCLP-classified hazardous) Licensed hazmat landfill 0.38 EPA WARM + hazmat transport
    PCB-containing materials ≥50 ppm Licensed PCB incineration 1.85 EPA hazardous waste incineration factors
    PCB-containing materials <50 ppm Licensed landfill 0.22 EPA WARM + transport premium
    Mercury-containing lamps/thermostats Mercury recycler 0.15 EPA WARM — recycling credit offset
    Regulated medical/biohazard waste (standard) Autoclave + licensed landfill 0.55 EPA medical waste treatment factors
    High-pathogen biohazard waste High-temperature incineration 0.85 EPA hazardous waste incineration factors
    Sharps waste Sharps autoclave or incineration 0.65 EPA medical waste — sharps category
    Contaminated water (Cat 3, to wastewater treatment) Municipal wastewater treatment 0.000272 per liter EPA WARM v16 — wastewater treatment
    Disposable PPE — standard Standard landfill 0.25 EPA WARM — mixed plastics
    Disposable PPE — hazmat-contaminated Licensed hazmat or medical waste landfill 0.30–0.55 Apply appropriate hazmat or medical waste factor

    Table 4: Category 12 — Demolished Building Materials

    Material tCO2e per ton (landfill) tCO2e per ton (recycled) Source
    Gypsum drywall (1/2″) 0.16 0.02 EPA WARM v16
    Dimensional lumber / wood framing -0.07 -0.15 EPA WARM v16 — carbon storage credit
    OSB sheathing -0.05 -0.12 EPA WARM v16 — carbon storage credit
    Carpet + pad (standard residential/commercial) 0.33 0.05 EPA WARM v16
    Hardwood flooring -0.12 -0.18 EPA WARM v16 — carbon storage credit
    Vinyl / LVP flooring 0.28 0.08 EPA WARM v16 — plastics category
    Ceramic / porcelain tile 0.04 0.01 EPA WARM v16 — inert material
    Fiberglass batt insulation 0.33 0.05 EPA WARM v16
    Cellulose insulation (spray or loose-fill) 0.06 -0.02 EPA WARM v16
    Spray polyurethane foam insulation (SPF) 0.72 N/A EPA WARM v16 — plastics category
    Acoustic ceiling tiles (standard) 0.12 0.03 EPA WARM v16 — ceiling tile category
    Structural steel (demolished) -0.85 -0.95 EPA WARM v16 — steel recycling credit
    Copper pipe / wiring -0.45 -0.60 EPA WARM v16 — copper recycling credit
    Aluminum (ductwork, framing) -1.20 -1.45 EPA WARM v16 — aluminum recycling credit (high value)

    Weight Estimation Proxies

    When disposal receipts are not available, use these weight proxies to estimate demolished material tonnage:

    Material Weight per sq ft (installed, dry) Notes
    1/2″ gypsum drywall 2.5 lbs Use dry weight, not post-water-damage wet weight
    5/8″ gypsum drywall (Type X) 3.1 lbs Common in commercial construction
    Carpet + pad (residential) 3.0 lbs Including pad and tack strips
    Carpet + pad (commercial, glue-down) 2.2 lbs Heavier carpet, no pad
    LVP / vinyl plank flooring 2.8 lbs Including underlayment
    Ceramic tile (floor, 3/8″) 4.5 lbs Including thin-set mortar
    Acoustic ceiling tiles (2’×2′ standard) 1.8 lbs Mineral fiber type
    Fiberglass batt insulation (3.5″ R-13) 0.5 lbs Per sq ft of coverage area
    Dimensional lumber 2×4 wall framing (per linear foot of wall) 4.0 lbs Assumes 16″ OC framing in 8-ft walls
    Non-friable ACM floor tile (9″×9″) 4.0 lbs Including mastic adhesive

    How often will this reference table be updated?

    The RCP emission factor reference table will be updated annually following the release of updated EPA WARM, EPA Mobile Combustion, and DEFRA databases. Version numbers are included in the table header — always cite the version used in your per-job carbon report data quality notes.

    What if I need an emission factor for a material not in this table?

    First check EPA WARM v16 directly (available free at epa.gov/warm). Second, check the EPA EEIO database for the relevant industry sector. Third, check DEFRA’s Conversion Factors for Company Reporting. If none of these sources contain the specific material, use the closest proxy category and document the substitution in your data quality notes.

    Are these factors suitable for use in EU CSRD reporting?

    EPA and EPA WARM factors are US-specific but are accepted in most international ESG frameworks when accompanied by clear source citation. For EU CSRD reporting specifically, DEFRA factors (UK) or OECD emission factors may be preferred by auditors for non-US operations. The RCP will publish a DEFRA-specific factor table in a future supplement for EU-applicable reporting contexts.


    Table 6: Refrigerant GWP Values — IPCC AR6 Update

    The Global Warming Potential values for refrigerants used in restoration drying equipment have been updated under IPCC Sixth Assessment Report (AR6, 2021). AR6 GWP-100 values are 14–18% higher than AR5 for the HFCs commonly found in LGR dehumidifiers. RCP v1.0 uses AR6 values for refrigerant-related calculations. The EPA AIM Act continues to use AR4 values for regulatory compliance; UNFCCC/Paris reporting uses AR5. When delivering data to clients, disclose which GWP vintage was used.

    Refrigerant Common use in restoration AR5 GWP-100 AR6 GWP-100 Change
    R-410A (HFC-32/125 blend) Most current LGR dehumidifiers ~1,924 ~2,256 +17.3%
    R-32 (HFC-32) Dri-Eaz LGR 6000i; newer units 677 771 +13.9%
    R-454B (HFC-32/HFO-1234yf blend) Next-gen low-GWP units ~467 ~530 +13.5%
    HFC-134a (R-134a) Older residential dehumidifiers 1,300 1,530 +17.7%

    Source: IPCC AR6 WG1, Chapter 7, Table 7.SM.7 (2021). EPA Technology Transitions GWP Reference Table.


    Table 7: EPA eGRID 2023 — Subregional Emission Factors for Major Restoration Markets

    The national average grid factor (0.3497 kg CO₂e/kWh, eGRID 2023) used as the RCP default understates or overstates electricity emissions significantly depending on where equipment is operated. Using location-specific subregion factors improves data quality for clients in GRESB, SBTi, and CSRD reporting contexts.

    Use the subregion factor for the state/metro where the job was performed, not where the contractor’s facility is located.

    eGRID Subregion Primary coverage kg CO₂e/kWh vs. RCP default (0.3499)
    NYUP Upstate New York 0.1101 -68.5%
    CAMX California / Western US 0.1950 -44.3%
    NEWE New England 0.2464 -29.6%
    ERCT Texas (ERCOT) 0.3341 -4.5%
    US Average National default (RCP v1.0) 0.3497 Baseline
    FRCC Florida 0.3560 +1.7%
    SRSO Southeast (excluding FL) 0.3837 +9.7%
    NYCW NYC and Westchester 0.3927 +12.2%

    Source: EPA eGRID2023 Summary Tables Rev 2 (published March 2025). Full subregion table available at epa.gov/egrid. A California restoration contractor using the national average overstates electricity emissions by 44%; a Florida contractor understates by 1.7%. The difference is largest for multi-week jobs with sustained equipment energy consumption.


    Table 8: PPE and Consumables — LCA-Sourced Per-Unit Emission Factors

    The EPA EEIO proxies in Table 2 are sector-level estimates. The following values are sourced from published lifecycle assessments and Environmental Product Declarations for specific product types. Use these in place of the EEIO values where the product type matches.

    Item Unit kg CO₂e Source vs. EEIO proxy
    Nitrile glove (3.5g, size M) Each 0.0277 Top Glove LCA 2024, SATRA-verified -82% vs. EEIO pair proxy
    Nitrile glove pair Pair 0.0554 Top Glove LCA 2024 -82% vs. current 0.3 EEIO
    N95 respirator (disposable) Each 0.05 Springer Env. Chem. Letters 2022 -88% vs. current 0.4 EEIO
    DuPont Tyvek 400 coverall (180g HDPE) Each 0.40–0.63 Estimated: 180g × 2.2–3.5 kg CO₂e/kg HDPE -47–65% vs. current 1.2 EEIO
    LVP/LVT flooring (Shaw EcoWorx) m² 5.2 Shaw Contract EcoWorx Resilient EPD 2023 Consistent with WARM v16 plastics
    Ceramic tile (standard) kg 0.78 ICE Database v3.0 (University of Bath) More granular than WARM v16 inert
    Ready-mix concrete (30 MPa) kg 0.13 ICE Database v3.0 132 kg CO₂e/m³
    Polyethylene LDPE sheeting kg 1.793 DEFRA 2024 (closed-loop recycling scenario) Use as proxy for virgin LDPE sheeting
    H₂O₂ antimicrobial (active ingredient) kg active 1.33 ACS Omega 2025 (anthraquinone process) Lower than EEIO chemical proxy

    Note on Tyvek: DuPont has not published an independent lifecycle assessment for standard Tyvek 400 coveralls. The value above is estimated from HDPE production emission factors. DuPont has commissioned an LCA for Tyvek 500 Xpert BioCircle (a recycled-content variant) claiming 58% reduction versus standard Tyvek, which implies a quantified baseline exists internally. The RCP will update this value if DuPont publishes the underlying LCA data.

    Note on nylon carpet (DEFRA 2024): The DEFRA 2024 value of 5.40 kg CO₂e/kg for nylon carpet should be verified against the actual DEFRA 2024 full spreadsheet to confirm whether this represents virgin nylon production or a closed-loop recycling scenario. DEFRA 2024 uses AR5 GWP values throughout.


    Factor Vintage and GWP Basis: Version Disclosure

    RCP v1.0 uses the following factor vintages:

    • Electricity: EPA eGRID 2023 (published March 2025)
    • Mobile combustion / vehicle fuels: EPA 2025 Emission Factors Hub
    • Waste disposal: EPA WARM v16
    • Refrigerant GWPs: IPCC AR6 (2021)
    • Materials (non-EEIO): ICE Database v3.0, EPD-sourced, DEFRA 2024
    • Materials (EEIO proxy): EPA USEEIO v2.0
    • GWP basis: AR6 GWP-100 for refrigerants; AR5 GWP-100 for all other gases (consistent with EPA GHG Inventory basis)

    When factors are updated in patch releases, the factor vintage table updates accordingly. All RCP Job Carbon Reports should reference the schema_version field (RCP-JCR-1.0) which implicitly references the factor table version used at calculation time. For year-over-year comparisons, use the same factor vintage across both years unless a major correction justifies restating prior-year figures.


  • Biohazard and Trauma Scene Cleanup: Scope 3 Emissions Mapping and Calculation Guide

    Biohazard and Trauma Scene Cleanup: Scope 3 Emissions Mapping and Calculation Guide

    The Agency Playbook
    TYGART MEDIA · PRACTITIONER SERIES
    Will Tygart
    · Senior Advisory
    · Operator-grade intelligence

    Biohazard and trauma scene cleanup is the fifth core restoration job type covered under the Restoration Carbon Protocol. Its Scope 3 emissions profile is distinct from the other four categories in one critical way: virtually all waste generated is classified as regulated medical or biohazardous waste, triggering disposal emission factors that are 3–5× higher than standard C&D waste. Combined with intensive PPE requirements and specialized treatment chemicals, biohazard cleanup generates significant emissions from a relatively small affected area.

    Job Classification

    Job Type Primary Waste Classification Dominant Emission Category Typical Range per Scene
    Unattended death / decomposition Regulated medical waste + affected porous materials Cat 5 (biohazard disposal) + Cat 12 (demolished materials) 0.8–3.0 tCO2e
    Trauma scene (blood/bodily fluids, limited area) Regulated medical waste, minimal structure affected Cat 5 dominant 0.3–1.2 tCO2e
    Crime scene with structural damage Regulated medical waste + C&D debris Cat 5 + Cat 12 1.0–4.0 tCO2e
    Sharps/drug paraphernalia scenes Sharps waste (regulated) + affected surfaces Cat 5 (sharps disposal) dominant 0.4–1.5 tCO2e
    Hoarding remediation with biohazard component Mixed solid waste + biohazard materials Cat 4 (volume transport) + Cat 5 1.5–6.0 tCO2e

    Category 4: Transportation

    Vehicle Type kg CO2e per mile Use
    Biohazard response vehicle (dedicated, sealed) 0.503–1.084 Crew and initial materials transport (van or truck)
    Medical waste hauler (regulated) 2.80 Regulated biohazardous waste to licensed medical waste facility
    Dump truck (standard C&D, non-biohazard portion) 2.25 loaded Non-regulated demolition debris for hoarding jobs

    Medical waste facility distance: Licensed medical waste treatment facilities (autoclaves, incinerators) are less common than standard landfills. Average distance from job site to licensed biohazard disposal facility is 40–80 miles in most US markets. Use actual manifest distances; apply 60 miles as default where manifests are unavailable.

    Category 1: Materials

    Material Unit kg CO2e per unit Notes
    Hospital-grade disinfectant (quaternary ammonium, EPA-registered) Liter 2.8 EPA EEIO — chemical manufacturing
    Enzyme treatment / biological digester Liter 1.6 EPA EEIO — specialty chemical
    Ozone generator treatment (odor/pathogen) Day-unit 0.35 Equipment embodied carbon amortized
    Hydroxyl generator treatment Day-unit 0.40 Equipment embodied carbon amortized
    Level B PPE full kit (Tyvek + face shield + supplied air) Kit 4.2 Required for decomposition / unattended death
    Level C PPE kit (Tyvek + half-face P100/OV) Kit 1.8 Trauma scenes with active biohazard
    6-mil poly sheeting (containment + floor protection) m² 0.55 EPA EEIO — plastics manufacturing
    Biohazard bags (red, 33-gallon) Each 0.65 Medical-grade polyethylene, red-colored
    Sharps disposal container (1-gallon) Each 0.35 EPA EEIO — plastics/medical equipment

    Category 5: Waste — Biohazard Disposal

    Waste Type Disposal Method tCO2e per ton Source
    Regulated medical waste (soft tissue, bodily fluids, porous materials) Autoclave + landfill 0.55 EPA medical waste incineration / autoclave factors
    Regulated medical waste — high pathogen risk High-temperature incineration 0.85 EPA hazardous waste incineration factors
    Sharps waste (needles, glass) Sharps autoclave or incineration 0.65 EPA medical waste — sharps category
    Contaminated porous building materials (drywall, carpet, subfloor) Licensed medical waste landfill or standard landfill (jurisdiction-dependent) 0.38–0.55 Apply higher factor when facility requires medical waste classification
    Non-biohazard C&D debris (hoarding, structural) Standard landfill 0.16 EPA WARM v16 — standard C&D
    Spent PPE (biohazard-contaminated) Licensed medical waste facility 0.55 Same as regulated medical waste stream

    Jurisdiction note on porous material classification: Whether mold-contaminated porous building materials from biohazard scenes must be disposed of as regulated medical waste (vs. standard C&D waste) varies by state and local regulation. Check with your licensed waste hauler for the applicable classification in your jurisdiction. Apply the higher emission factor (0.55) in conservative calculations or when disposal classification is uncertain.

    Category 12: Demolished Building Materials

    Biohazard scenes frequently require demolition of affected porous materials — flooring, subfloor, drywall — that absorbed biological contamination and cannot be cleaned to restoration standards. When these materials are classified as regulated medical waste at removal, their disposal emissions are captured in Category 5 (same as ACM materials in hazmat abatement). When they are classified as standard C&D waste at the jurisdiction level, use Category 12 EPA WARM factors (same as water damage demolition materials).

    Apply Category 12 factors to demolished materials only when they flow to standard C&D landfill rather than medical waste disposal. When in doubt, apply medical waste disposal factors and capture in Category 5.

    Worked Example: Unattended Death, Single Apartment Unit

    Job profile: Unattended death in a 650 sq ft apartment, discovered after 10 days. Affected area: 400 sq ft (bedroom and hallway). Scope: removal of all porous materials in affected area (carpet, subfloor, drywall to 24″ height), disinfection of all surfaces, odor treatment. Duration: 2 days. Crew: 2 technicians in Level B PPE. Facility: 15 miles from job site. Licensed medical waste facility: 58 miles from job site.

    Category 4 — Transportation

    Crew vehicle: 1 van × 30 mi RT × 3 trips = 90 mi × 0.503 = 45 kg
    Medical waste hauler: 1 × 116 mi RT × 2.80 = 325 kg
    Category 4 total: 370 kg = 0.37 tCO2e

    Category 1 — Materials

    Hospital-grade disinfectant (400 sq ft × 0.025 L/sq ft × 2 applications): 20 L × 2.8 = 56 kg
    Enzyme treatment: 8 L × 1.6 = 13 kg
    Ozone generator: 2 day-units × 0.40 = 1 kg
    Level B PPE (2 workers × 2 days × 3 exits/day = 12 kit replacements): 12 × 4.2 = 50 kg
    Biohazard bags (20 bags): 20 × 0.65 = 13 kg
    Poly sheeting (floor protection + containment): 80 m² × 0.55 = 44 kg
    Category 1 total: 177 kg = 0.18 tCO2e

    Category 5 — Waste

    Regulated medical waste (soft materials, porous materials, PPE): estimated 0.6 tons × 0.55 = 0.33 tCO2e
    Non-hazard debris (drywall, not in medical waste stream): 0.25 tons × 0.16 = 0.04 tCO2e
    Category 5 total: 0.37 tCO2e

    Category 12

    Carpet/pad (400 sq ft): 0.55 tons × 0.33 = 0.18 tCO2e
    Subfloor (400 sq ft plywood): 0.40 tons × -0.05 = -0.02 tCO2e
    Category 12 total: 0.16 tCO2e

    Category tCO2e
    Category 4 — Transportation 0.37
    Category 1 — Materials 0.18
    Category 5 — Waste (regulated medical) 0.37
    Category 12 — Demolished materials 0.16
    Total 1.08 tCO2e

    Is biohazard cleanup typically covered by commercial property insurance?

    Yes — biohazard cleanup at commercial properties is typically covered under property insurance. The emissions data from an RCP biohazard calculation should be provided to the commercial property manager for their Scope 3 inventory in the same format as other restoration job types.

    How do you handle hoarding remediation with both biohazard and standard C&D waste streams?

    Split the waste into its classified streams: regulated biohazardous material (apply medical waste disposal factors), standard C&D debris (apply WARM factors), and any hazardous materials encountered (apply hazmat factors). Document each stream separately in the Category 5 breakdown. The mixed nature of hoarding jobs makes them the most complex biohazard calculation scenario.

    Does the RCP apply to crime scenes where law enforcement is involved?

    Yes. The RCP calculation is based on the remediation contractor’s scope of work regardless of the cause of the biohazard condition. The emissions calculation is performed after the scene is released to the contractor and is based on the actual materials used, waste generated, and transportation involved in the cleanup — independent of the legal context of the event.


    Disposal Method Differentiation: Autoclave vs. Incineration Creates a 5–10× Emission Difference

    The biohazard guide currently uses a single disposal factor of 0.88 tCO₂e per short ton for all regulated medical/biohazardous waste. This figure is methodologically sound as a default, but the actual emission factor depends entirely on which treatment pathway your waste hauler uses. The difference is not marginal — it is 5 to 10 times.

    The following lifecycle emission data comes from a peer-reviewed GHG Comparison Assessment conducted by Carbon Action Consultants (2022, reviewed by Dr. Tahsin Choudhury) commissioned by Envetec, covering 72 metric tonnes of biohazardous waste across treatment pathways:

    Treatment Pathway tCO₂e per metric tonne vs. Direct Incineration
    Onsite disinfection and shredding (where permitted) 0.057 93% lower
    Autoclave → standard landfill (no incineration) 0.46 44% lower
    Direct high-temperature incineration → landfill 0.82 Baseline
    Autoclave → incineration → landfill (dual treatment) 0.90 +10% above direct incineration

    Source: Envetec GHG Comparison Assessment, 2022. Validation: UK NHS hospital waste study (Journal of Cleaner Production, 2020) measured high-temperature incineration at 1,074 kg CO₂e per tonne (0.97 tCO₂e/short ton), consistent with the incineration-pathway figure above.

    The current RCP default of 0.88 tCO₂e/short ton (equivalent to approximately 0.97 tCO₂e/metric tonne) reflects the dual-treatment or incineration-dominant pathway. It is a conservative and defensible default. However, for contractors whose waste haulers use autoclave-only treatment, the actual figure may be nearly half the default.

    How to document: Ask your regulated waste hauler which treatment method they use. Record the answer in the data_quality.notes field of your RCP Job Carbon Report. If the hauler uses autoclave-only, apply 0.46 tCO₂e/metric tonne (0.42 tCO₂e/short ton) and flag it as hauler-confirmed primary data. If unknown, apply the default 0.88 tCO₂e/short ton and flag as proxy.


    Autoclave Energy Intensity

    For contractors or facilities operating onsite autoclave treatment, the energy intensity data is available from peer-reviewed hospital operations research. A study published in PubMed (PMID 27075773), tracking 304 days and 2,173 autoclave cycles, measured:

    • Energy intensity: 1.9 kWh per kg of waste sterilized
    • Water consumption: 58 liters per kg of waste

    At the national grid emission factor (0.3499 kg CO₂e/kWh), autoclave treatment of one short ton (907 kg) of biohazardous waste consumes approximately 1,723 kWh of electricity, generating 603 kg CO₂e from energy alone — consistent with the peer-reviewed lifecycle figure of 0.46 tCO₂e/tonne when hauling and residual landfill are included.


    Odor Neutralization Chemistry: What Has Emission Data and What Doesn’t

    Trauma and biohazard cleanup frequently involves odor neutralization as a final step after biological contamination is removed. The emission factors for these chemicals are poorly documented.

    Peracetic acid (PAA) is the best-documented odor treatment and disinfectant in restoration applications. The Envetec lifecycle study assigns 0.61 kg CO₂e per kg of PAA active ingredient, making it one of the lower-footprint chemical treatments available. PAA breaks down rapidly to acetic acid and water — no persistent residue, no downstream emission concerns.

    Chlorine dioxide (ClO₂) is the dominant chemistry for trauma scene odor elimination. Products using sodium chlorite activated with citric acid (Biocide Systems Room Shocker, ProKure1) are self-generating chemistry requiring no electricity for treatment delivery. No published production emission factor exists for ClO₂ generator products specifically. The RCP treats ClO₂ odor treatment as a data gap. Apply the EPA EEIO chemical manufacturing proxy (2.8 kg CO₂e/kg of active chemical) and flag as estimated.

    Enzyme-based neutralizers similarly lack published LCA data. Treat as a data gap and apply the EEIO proxy.


    ATP Testing: Emissions-Negligible but Methodologically Required

    ATP bioluminescence testing (ANSI/IICRC S540 requires minimum two rounds per scene — pre-remediation and clearance) is a consumable source. Hygiena UltraSnap ATP swabs weigh approximately 5–10g each (polypropylene housing, pre-moistened fiber tip, luciferin/luciferase reagent). Estimated carbon footprint: 20–50g CO₂e per swab using generic small medical plastic device lifecycle data. A typical trauma scene requiring 10–30 swabs generates 0.2–1.5 kg CO₂e from ATP testing.

    This is below 0.1% of total job emissions on all but the smallest trauma scene jobs. ATP testing is documented here for methodological completeness — include it in Category 1 if your job tracking captures swab consumption, but it is acceptable to omit and note the exclusion as immaterial in the data_quality section.


    Sources and References — Biohazard Technical Additions

    • Envetec / Carbon Action Consultants. GHG Comparison Assessment for Biohazardous Waste Treatment Pathways. 2022. envetec.com
    • PubMed PMID 27075773. “Steam sterilisation’s energy and water footprint.” Journal of Hospital Infection. 2016.
    • Springer Environmental Chemistry Letters. “Impact of waste of COVID-19 protective equipment on the environment.” 2022.
    • Top Glove. Life Cycle Assessment Results for Nitrile Gloves. SATRA-verified. 2024.
    • ANSI/IICRC S540. Standard for Professional Biohazard Remediation. Current edition.

  • The ESG Case for the Restoration Golf League: A Network That Sets Standards

    The ESG Case for the Restoration Golf League: A Network That Sets Standards

    The Agency Playbook
    TYGART MEDIA · PRACTITIONER SERIES
    Will Tygart
    · Senior Advisory
    · Operator-grade intelligence

    The Restoration Golf League was designed as a B2B networking vehicle — a way for independent restoration contractors to build relationships with commercial property managers, insurance adjusters, and facility directors in an environment that creates genuine connection rather than transactional vendor-client dynamics.

    The ESG conversation creates an opportunity to extend what the RGL does — not by adding another agenda item to golf networking events, but by positioning the RGL network as the restoration industry’s first ESG-capable contractor coalition. A group of independent operators who share a commitment to structured emissions reporting and who collectively represent a preferred vendor base for commercial clients with Scope 3 obligations.

    What a Network Does That Individuals Can’t

    An individual restoration contractor who adopts RCP is a data point. A network of 50 RCP-certified restoration contractors across multiple markets is a standard. The distinction matters to commercial property managers who operate nationally — they need consistent data from vendor bases across multiple regions, not ad-hoc reporting from individual contractors who each implement differently.

    When a national REIT’s sustainability team is looking for RCP-compliant restoration vendors in six markets simultaneously, a network of contractors who share a common standard, a common report format, and a common data delivery commitment is a procurement solution, not a patchwork of individual vendor relationships to manage. The RGL becomes a vendor category rather than a collection of individual vendors.

    The RGL ESG Proposition to Commercial Clients

    Straightforward: every RGL member contractor provides RCP-format per-job carbon data. When you hire an RGL contractor, you receive structured Scope 3 emissions data for your GRESB, CDP, and SB 253 disclosures. You don’t need to evaluate each contractor’s ESG capability individually — RGL membership in an RCP-adopting network is the credential. This is a market-facing advantage the RGL can offer today.

    How to Advance RCP Through the RGL Network

    Present the RCP framework at the next RGL event. Invite member contractors to commit to a 60-day RCP implementation pilot. Collect the five pilot jobs required for self-certification from willing members. Then publish the pilot results — aggregate emissions data from the pilot cohort — as the first empirical data set for the restoration industry’s Scope 3 baseline.

    That aggregate baseline — even from a small pilot cohort of 10–20 contractors — would be the first published data on restoration industry Scope 3 emissions. It would immediately become the reference data cited by property managers, ESG consultants, and eventually trade associations trying to understand what restoration work actually emits. First-mover advantage in publishing that data is significant and durable.

    The Longer View

    Commercial real estate’s appetite for ESG-credentialed vendor networks is growing. As SB 253 deadlines approach and GRESB supply chain requirements tighten, property managers will actively seek vendor networks that reduce their ESG data collection burden. A restoration contractor network offering consistent RCP reporting across multiple markets is exactly what large commercial property management companies will pay a premium for — in the form of preferred vendor status, longer contract terms, and the relationship stability that comes from being a supply chain ESG partner rather than a transactional service vendor.

    The RGL’s golf format builds the relationships. RCP adoption builds the credential. Together, they create a network that commercial clients can point to when their investors and auditors ask about supply chain ESG engagement in property restoration.

    Does RGL membership automatically confer RCP certification?

    Not currently. RCP certification requires completing the self-certification checklist, which is separate from RGL membership. The goal is for RCP certification to become a condition of active RGL membership in markets where commercial real estate is a significant client category.

    How can a commercial property manager find RGL member contractors in their market?

    Contact the Restoration Golf League directly. As the network grows and ESG positioning develops, a public directory of RCP-certified RGL members by market will be the most efficient way for commercial clients to identify ESG-capable restoration vendors in their service areas.

    Can restoration contractors outside the RGL adopt RCP?

    Absolutely. RCP is an open standard available to any restoration contractor regardless of RGL membership. The RGL pilot cohort is one pathway to RCP adoption — not a prerequisite for using the framework.


  • RCP and KnowHow: Internal & External Knowledge Stacks

    RCP and KnowHow: Internal & External Knowledge Stacks

    The Agency Playbook
    TYGART MEDIA · PRACTITIONER SERIES
    Will Tygart
    · Senior Advisory
    · Operator-grade intelligence

    The restoration industry is developing two parallel knowledge infrastructure plays simultaneously, and they are more complementary than they might appear at first.

    KnowHow — the AI-powered operational knowledge platform — solves the internal problem: capturing what your best people know, making it accessible to every team member, and ensuring institutional knowledge doesn’t walk out the door when someone leaves. It makes your operational playbook consistent, scalable, and resilient to turnover.

    The Restoration Carbon Protocol solves the external problem: structuring your operational data — specifically the emissions data generated by your work — in a format that commercial clients can use in their ESG disclosures. It makes your environmental footprint visible, consistent, and credible to institutional clients who need it for their own reporting obligations.

    Where the Two Stacks Connect

    The connection point is job documentation. KnowHow helps your crew follow consistent protocols — which means the data generated during a job (materials used, waste generated, work performed) is more consistent and reliably captured. That consistency directly benefits RCP data quality. When crews follow a KnowHow-documented protocol for Category 3 water damage mitigation, the resulting data consistency makes the RCP calculation for that job more reliable.

    In the other direction: RCP creates external accountability for the quality of your internal processes. When you’re producing per-job carbon reports for commercial clients that may be reviewed by ESG auditors, the incentive to maintain rigorous job documentation increases. External reporting requirements are one of the most effective drivers of internal data discipline.

    The Two-Layer Architecture

    Layer 1 — Internal (KnowHow): Operational SOPs, job protocols, training materials, quality standards. Purpose: consistent execution, scalable training, knowledge retention. Audience: your team. Knowledge stays inside your organization.

    Layer 2 — External (RCP): Per-job carbon data, client-facing reports, ESG vendor profiles, methodology documentation. Purpose: commercial client ESG compliance, preferred vendor status, market differentiation. Audience: commercial clients, their auditors, government contracting officers. Knowledge flows outward in structured, client-usable form.

    Neither layer replaces the other. A contractor with excellent internal processes (Layer 1) but no external reporting capability (Layer 2) has a good operation that commercial clients can’t verify. A contractor with RCP reporting capability (Layer 2) but inconsistent internal processes (Layer 1) has credibility problems — the external reports may not reflect consistent underlying reality. The competitive position that’s hard to replicate is both layers, built deliberately, operating together.

    Does KnowHow integration with RCP require a technical connection between the platforms?

    Not currently. The integration is conceptual — KnowHow documents the protocols, crews follow them, and resulting data consistency benefits RCP calculations. Future integration could include RCP data capture fields within KnowHow’s job documentation workflows.

    Which should a contractor implement first?

    Either order works. If internal processes are inconsistent, KnowHow first — consistent processes make RCP data more reliable. If processes are consistent but no external reporting capability exists, RCP first — the commercial client relationship benefit is more immediately visible. Both are worth pursuing regardless of order.

    Are there other knowledge platforms comparable to KnowHow?

    General knowledge management platforms (Notion, Confluence, Process Street) can serve the same internal documentation purpose with more configuration effort. The RCP is compatible with any internal knowledge management approach — it’s agnostic to which platform captures and delivers your operational SOPs.


  • How to Become an RCP-Certified Restoration Contractor

    How to Become an RCP-Certified Restoration Contractor

    The Agency Playbook
    TYGART MEDIA · PRACTITIONER SERIES
    Will Tygart
    · Senior Advisory
    · Operator-grade intelligence

    The RCP self-certification program provides a structured pathway for restoration contractors to demonstrate they have implemented the framework — moving from awareness to a verifiable credential that commercial clients can rely on. Self-certification is the appropriate model for an early-stage standard: honest about what the credential represents (contractor attestation, not third-party audit), and creating a meaningful bar that not every contractor will clear.

    The RCP Self-Certification Checklist

    Part 1: Knowledge and Training

    • Company leadership has read and understands the RCP v1.0 framework document
    • At least one employee designated as RCP implementation lead has completed the RCP calculation methodology training
    • The implementation lead can explain the four primary GHG Protocol Scope 3 categories applicable to restoration work and why each is relevant

    Part 2: Data Capture Implementation

    • The company’s job close-out process includes capture of all 12 RCP data points (or documented proxy methods for any that cannot be directly captured)
    • The data capture process has been applied to at least 5 commercial restoration jobs
    • Job records from those 5 jobs are retained and available for calculation purposes

    Part 3: Calculation Capability

    • The company can produce a complete RCP per-job carbon report for each of the 5 pilot jobs, covering all four primary Scope 3 categories
    • The calculation uses RCP-specified emission factors from EPA or DEFRA sources
    • Each report includes a data quality section noting any points where estimation was used

    Part 4: Client Delivery

    • At least one per-job carbon report has been delivered to a commercial client
    • The company has an ESG vendor profile including the five RCP vendor profile components
    • The company’s standard commercial contract can include an RCP data delivery commitment

    The Certification Process

    Complete the checklist, submit it along with five sample redacted per-job carbon reports, and attest that the information is accurate. The RCP program reviews submissions for completeness and consistency — not to audit the underlying data, but to verify that reports are structured correctly and the methodology is applied as specified. Contractors who complete the review process receive the RCP Certified designation and may use the RCP Certified badge in commercial materials and vendor profiles.

    What RCP Certification Signals

    RCP Certified tells a property manager’s ESG team three things: the contractor understands Scope 3 methodology (training completed), they have a functioning data capture system (reports produced for five jobs), and they are committed to ongoing delivery (client delivery process established). For ESG-aware preferred vendor programs, RCP certification reduces due diligence burden — property managers can require it as a qualification criterion and rely on it to indicate capability.

    How long does the certification process take?

    For a contractor starting from scratch, implementing data capture, completing five jobs with RCP tracking, producing reports, and completing the submission typically takes 60–90 days. Contractors who already track detailed job data can move faster.

    Does certification need to be renewed?

    RCP certification will be renewable annually, requiring brief attestation that the contractor is using the current RCP version and has maintained their data capture and delivery process. Annual renewal is a light lift — its purpose is to maintain the quality signal of the credential over time.

    Is there a cost for RCP certification?

    The initial self-certification program will have a nominal administrative fee to cover program management. The framework documentation, training materials, and calculation worksheets remain free regardless of certification status.