• Tacoma, WA
• Industry Bulletin
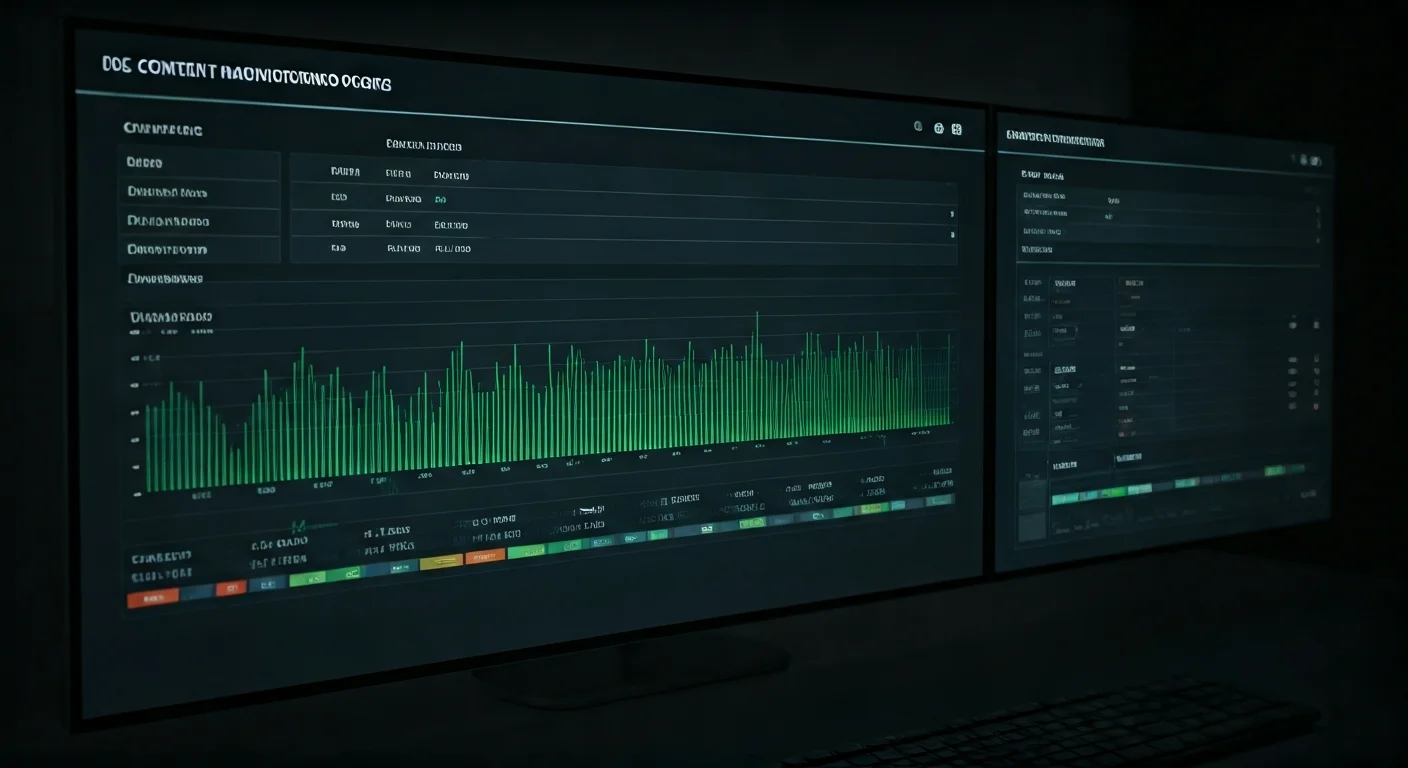
TL;DR: The Living Monitor is a real-time system that tracks whether your content is being cited by AI systems (ChatGPT, Gemini, Perplexity, Claude). It measures: citation frequency, which AI systems are citing you, which specific claims are cited, competitor displacement, and citation accuracy. Without monitoring, you’re flying blind. With it, you see exactly where your content wins and where competitors dominate—enabling rapid optimization.
The Problem: You Can’t Improve What You Can’t Measure
In the Google era, you had rank tracking. You knew exactly which keywords you ranked for, what position, how you compared to competitors. Tools like Semrush and Ahrefs gave you complete visibility.
Now, with AI-driven search, you have zero visibility into what’s happening. You don’t know if your content is being cited. Which AI systems cite you? Which competitors are cited more frequently? Which of your claims get pulled into AI responses?
You’re optimizing for something you can’t measure. That’s backwards.
The Living Monitor solves this. It’s a real-time tracking system that tells you: Am I being cited by AI systems? How often? By which systems? Where am I winning? Where am I losing?
What the Living Monitor Tracks
Citation Frequency
How many times per day/week/month is your content cited by AI systems? Track this for:
• Overall brand citations
• Per-article citations
• Competitor citations (for comparison)
• Citation growth rate (are you trending up?)
You’ll immediately see patterns. Articles optimized for lore get cited 10-50x per day. Traditional blog posts get cited 0-2x per day. This visibility lets you double down on what works.
AI System Breakdown
Different AI systems cite differently. Track your citations by system:
• ChatGPT (largest user base, highest citation volume)
• Gemini (second-largest, growing)
• Perplexity (specialized, searcher audience)
• Claude (technical audience, enterprise)
• Others (Copilot, Grok, etc.)
You’ll likely find asymmetric dominance. Maybe Claude cites you heavily (technical audience), but Gemini ignores you (consumer audience). This tells you where to optimize your content strategy.
Claim-Level Citations
Which specific claims from your content get cited? Track this at the sentence level. Example:
Article: “Data teams spend 43% of time on prep. Modern data warehouses cost $50K/month. ROI appears at 18 months.”
Monitor output: “Claim 1 cited 127 times. Claim 2 cited 3 times. Claim 3 never cited.”
This precision tells you: Specific claims drive citations. Generic claims don’t. Optimize by doubling down on high-citation claims and cutting low-citation ones.
Competitive Displacement
When an AI system could cite either you or a competitor, who wins? Track this explicitly:
• In queries about topic X, are you cited more than competitor A?
• Is your citation frequency growing faster than theirs?
• Are you displacing them, or are they displacing you?
This is your actual competitive metric. Not rank position. Citation dominance.
Citation Accuracy
When you’re cited, is the attribution correct? Does the AI system quote you accurately? Is the context preserved? Track:
• Citations with correct attribution
• Misquotes or contextual distortions
• Attribution omissions (your claim cited but not attributed to you)
High misquote rates suggest your content is being paraphrased (losing attribution). This is a sign your content needs to be more quotable (more lore-like).
How the Living Monitor Works
The technical architecture is straightforward:
1. Content Fingerprinting
Identify your key claims. Extract them as semantic signatures. Example: “Data preparation consumes 43% of analyst time” becomes a fingerprint. Your system learns this claim and its variants.
2. AI System Monitoring
Use APIs and web scrapers to monitor responses from ChatGPT, Gemini, Perplexity, Claude. When these systems generate responses to queries related to your domain, capture them.
3. Claim Detection
Use semantic similarity (embeddings) to detect when your claims appear in AI responses. Similarity matching catches paraphrases, not just exact quotes.
4. Attribution Verification
Check whether your brand/site is mentioned in the context of the cited claim. Track if attribution is present, accurate, or omitted.
5. Real-Time Dashboarding
Aggregate all this data into dashboards showing: total daily citations, breakdown by AI system, breakdown by claim, competitive displacement, trends.
Interpretation: What the Data Tells You
High Citation Frequency (100+ per day)
Your content is canonical source material in your domain. AI systems treat you as authoritative. Double down on this. Deepen your lore. Expand to adjacent topics. You’re winning.
Low Citation Frequency (0-10 per day)
Your content is being read but not cited. Either: (a) it’s not dense enough (lacks lore characteristics), (b) competitors have more authoritative content, or (c) your content is not aligned with common queries. Run audit: is your content machine-readable? Is it as dense as competitors’?
Asymmetric System Citations
Example: High ChatGPT citations, zero Gemini citations. This suggests your content aligns with one system’s training data or query patterns but not others. Investigate: does your content use technical jargon that ChatGPT understands but Gemini doesn’t? Is your domain underrepresented in Gemini’s training? Adjust accordingly.
Claim-Level Patterns
If specific claims get cited 100x more than others, those claims are winning. Understand why. Are they more specific? More surprising? More authoritative? Use this to train your lore-writing process.
Competitive Displacement Trends
If you’re gaining citations while competitors lose, you’re winning the market. If competitors are gaining while you stagnate, your content strategy needs adjustment.
Real Example: Data Analytics Company
Company: “Modern Analytics” (data platform). Topic: ROI of modern data warehouses.
Before Living Monitor (flying blind):
They published 8 articles about data warehouse ROI. No visibility into which were cited, how often, by which systems. Assumed all equally valuable.
After Living Monitor (first 30 days):
Found: Article 1 cited 312 times. Article 2 cited 4 times. Article 3 cited 89 times. Articles 4-8 cited 0 times.
Breakdown: ChatGPT (198 citations), Gemini (67), Perplexity (43), Claude (4).
Claim analysis: “Modern data warehouses cost $50K-$200K/month” cited 189 times. “Set up Snowflake in 6 steps” cited 0 times.
Competitive analysis: Versus Databricks (competitor): Modern Analytics cited in 67% of responses. Databricks in 33%. Modern Analytics winning displacement.
Action Taken:
1. Killed articles 4-8 (no citations, low quality).
2. Expanded Article 1 (312 citations, clearly resonant).
3. Rebuilt Article 2 with higher lore density (4 citations = too shallow).
4. Created 5 new articles following the structure of Article 1 (claims over tutorials).
5. Optimized for Gemini (only 67 citations vs ChatGPT’s 198; growth opportunity).
After 90 days (with optimization):
Total citations: 4,200 (up from 400). ChatGPT: 2,400. Gemini: 1,200 (3-4x growth). Competitive displacement: Modern Analytics now cited in 81% of relevant responses.
Result: 3-5x increase in qualified traffic from AI systems (users referred by AI system citations).
Implementing the Living Monitor
Option 1: Build In-House
You’ll need: API access to major AI systems (ChatGPT, Gemini offer APIs; others require scraping). Semantic fingerprinting (embeddings). Real-time monitoring infrastructure. Data aggregation and dashboarding.
Timeline: 6-12 weeks for MVP. Cost: $50-150K (depending on scale).
Option 2: Use Existing Tools
Several AI monitoring platforms are emerging (e.g., Brand monitoring tools that track AI citations). They’re not perfect—coverage is limited, data is usually delayed by 24-48 hours—but they’re faster to implement.
Option 3: Hybrid
Use existing tools for baseline monitoring. Build in-house systems for deeper claim-level analysis on your top-10 articles.
The Competitive Advantage Is Temporary
Right now (2026), most brands have zero visibility into AI citations. They’re optimizing without data. This is a massive advantage for anyone with a Living Monitor.
In 18-24 months, monitoring will be standard. Every brand will have visibility. The advantage will diminish.
But for the next 12 months, if you’re the only brand in your market with a Living Monitor, you’ll see patterns competitors miss. You’ll optimize faster. You’ll win.
Start now. Read the pillar guide, then implement the Living Monitor. Track your baseline. Start optimizing. Watch your AI citation frequency compound.
{
“@context”: “https://schema.org”,
“@type”: “Article”,
“headline”: “The Living Monitor: How to Track Whether AI Systems Are Actually Citing Your Content”,
“description”: “Real-time monitoring of AI citations across ChatGPT, Gemini, Perplexity, and Claude. Measure citation frequency, competitive displacement, and optimize where yo”,
“datePublished”: “2026-03-30”,
“dateModified”: “2026-04-03”,
“author”: {
“@type”: “Person”,
“name”: “Will Tygart”,
“url”: “https://tygartmedia.com/about”
},
“publisher”: {
“@type”: “Organization”,
“name”: “Tygart Media”,
“url”: “https://tygartmedia.com”,
“logo”: {
“@type”: “ImageObject”,
“url”: “https://tygartmedia.com/wp-content/uploads/tygart-media-logo.png”
}
},
“mainEntityOfPage”: {
“@type”: “WebPage”,
“@id”: “https://tygartmedia.com/the-living-monitor-how-to-track-whether-ai-systems-are-actually-citing-your-content/”
}
}
📖 Recommended Reading in The Signal
-
🎯 Pillar Guide:
Restoration Company SEO: Fix Your AI Search Visibility -
🔗 Next Topic:
Information Density Analyzer: Is Your Content Dense Enough for AI?
Leave a Reply