Equipment is the line item that surprises new restoration operators the most. The catalog photos look cheap. The package quotes from suppliers look expensive. The truth is somewhere in between, and the right answer depends on whether you’re outfitting one truck or three.
The line-item equipment list (water mitigation)
| Item | Per-Unit (2026) | Qty (1-truck) | Subtotal |
|---|---|---|---|
| Low-profile air movers | $200 – $300 | 16 | $3,200 – $4,800 |
| Axial air movers | $200 – $350 | 4 | $800 – $1,400 |
| Small refrigerant dehumidifier | $900 – $1,200 | 2 | $1,800 – $2,400 |
| Large LGR dehumidifier | $2,200 – $3,000 | 2 | $4,400 – $6,000 |
| HEPA air scrubber (500 CFM) | $700 – $1,000 | 2 | $1,400 – $2,000 |
| Truck-mount or portable extractor | $3,500 – $25,000 | 1 | $3,500 – $25,000 |
| Moisture meter (pin + pinless) | $300 – $600 | 2 | $600 – $1,200 |
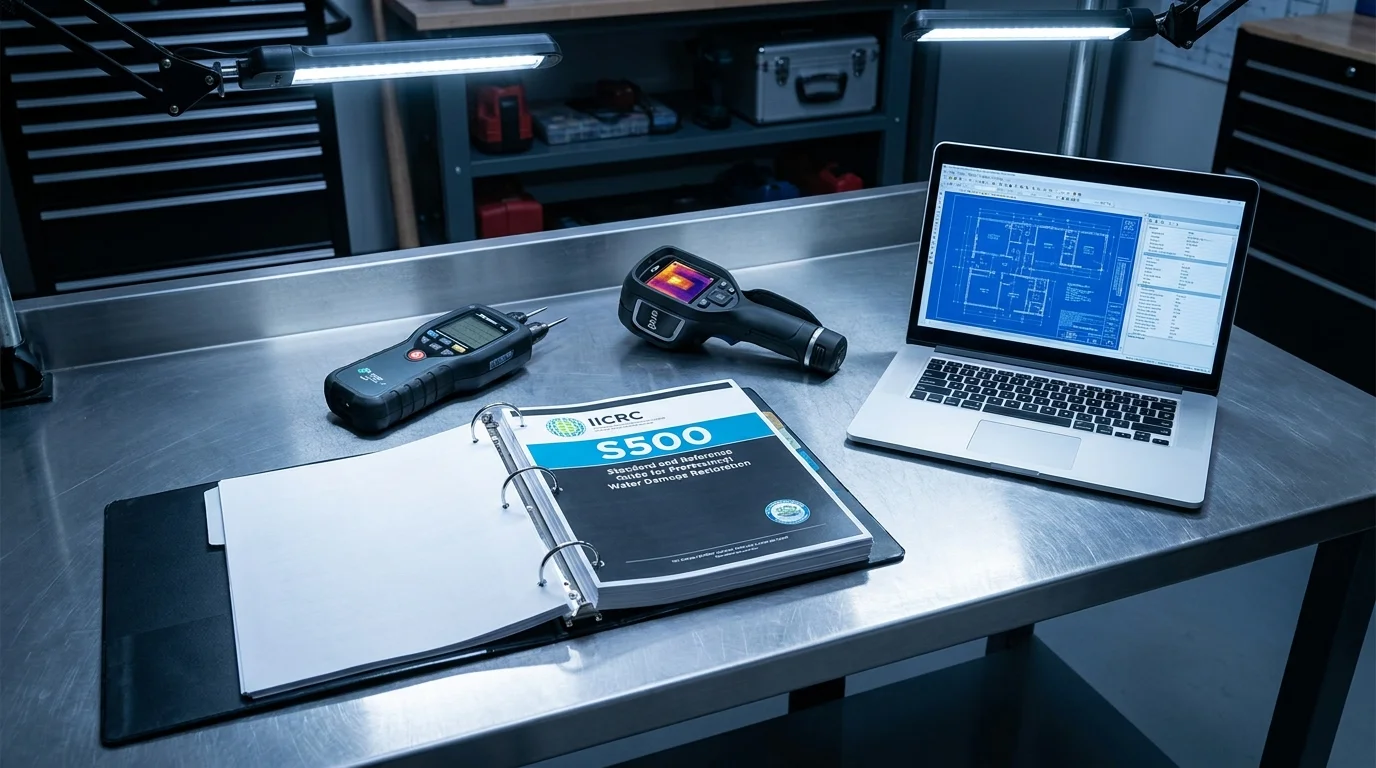
| Thermal imaging camera | $1,500 – $4,000 | 1 | $1,500 – $4,000 |
| Hygrometer / data loggers | $200 – $500 | 2 | $400 – $1,000 |
| PPE, hand tools, hoses, generators | — | — | $2,000 – $5,000 |
| 1-truck equipment subtotal | $19,600 – $52,800 |
Add fire and mold capability
- Fire/smoke: Ozone generators ($800 – $2,000), hydroxyl generators ($3,000 – $7,000), thermal foggers ($300 – $800), HEPA vacuums ($600 – $1,500), chemicals/cleaners. Plan on $8,000 – $15,000 added.
- Mold: Negative air machines ($800 – $1,500), additional HEPA scrubbers, containment poly and zipper doors, full PPE program. Plan on $5,000 – $10,000 added.
- Contents: Pack-out boxes, content cleaning station, ultrasonic cleaner ($2,000 – $8,000), storage racks. Plan on $5,000 – $20,000 added.
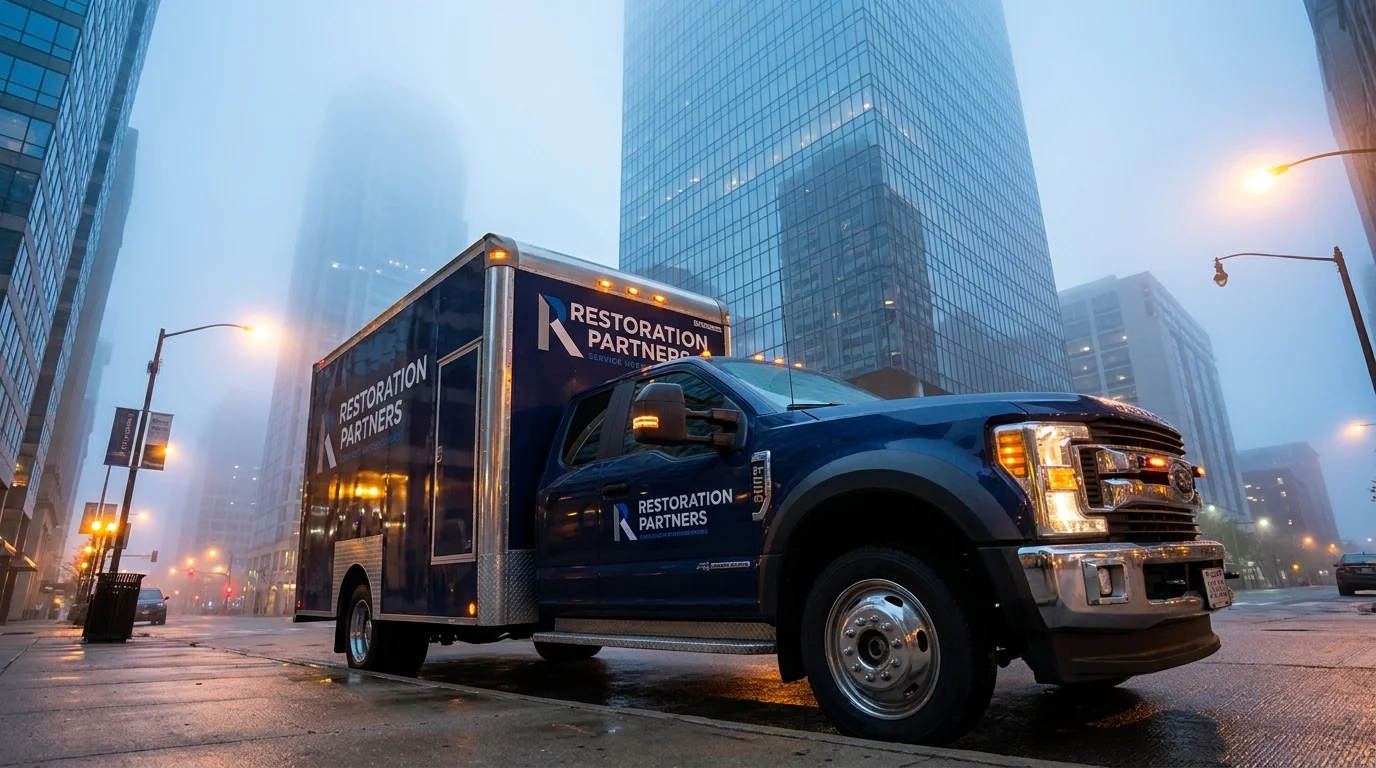
Vehicle costs (2026)
- Used cargo van + basic shelving: $35,000 – $50,000.
- New cargo van + custom buildout: $60,000 – $90,000.
- Box truck or step van: $70,000 – $130,000.
- Vehicle wrap (branded fleet visibility): $3,000 – $6,000 each.
Industry models for fully-equipped multi-truck launches put the initial fleet investment at ~$80,000 for two service vans, with total capital expenditures including specialized equipment around $172,000.
Three realistic startup tiers
Tier 1: Lean Owner-Operator ($80K – $150K total cash)
- 1 used van
- Water mitigation only
- 16 air movers, 2 small dehus, 1 LGR, 1 HEPA
- Owner-only crew
Tier 2: Mid-Tier Multi-Service ($250K – $450K total cash)
- 2 vans
- Water + mold + entry-level fire
- 40 air movers, 6 dehus, 4 HEPA, 2 negative air, basic contents capability
- 2-3 technicians
Tier 3: Multi-Truck Production Shop ($500K – $1M+ total cash)
- 3-5 vans + 1 box truck
- Water + fire + mold + contents + light reconstruction
- 80+ air movers, 12+ dehus, 8+ HEPA, full negative air kit, content cleaning station
- 5-8 technicians + dispatcher
Equipment pitfalls to avoid
- Buying everything new at launch. Used dehumidifiers and air movers from auctions or other restorers can cut equipment cost 40-60%.
- Underbuying air movers. 16 is the practical floor — large losses eat 30+ on day one.
- Skipping the thermal camera. It pays for itself in scope defensibility on the first 3 jobs.
- Cheap moisture meters. Insurance adjusters notice. Buy Delmhorst or Tramex.
- Ignoring asset tracking. By job 50 you’ll lose track of where your equipment is. Plan tracking from day one.
FAQs about restoration equipment costs
How many air movers do I need to start?
Minimum 16. A typical Cat 1 water loss in a 2,000 sq ft home requires 12-20 air movers running 3-5 days. Underbuying means you can only run one job at a time, which kills revenue per truck.
Should I buy used or new restoration equipment?
Air movers and small dehus: used is fine if you can verify hours and condition. Large LGR dehumidifiers: buy new — refurb risk on compressor failure isn’t worth the savings. Trucks: used with a real PPI is the budget winner.
What is the cheapest way to start a restoration company?
Lean owner-operator with $80K cash: used van, 16 air movers, 2 dehus, 1 HEPA, water mitigation only, owner does all production for the first 6 months. Add capability as cash flow allows.
Do I need a truck-mount extractor?
For pure water mitigation, a portable extractor ($3,500 – $5,000) is enough for the first year. Truck-mounts ($15,000 – $25,000) become worth it when you’re running 5+ jobs/week or doing significant carpet cleaning.
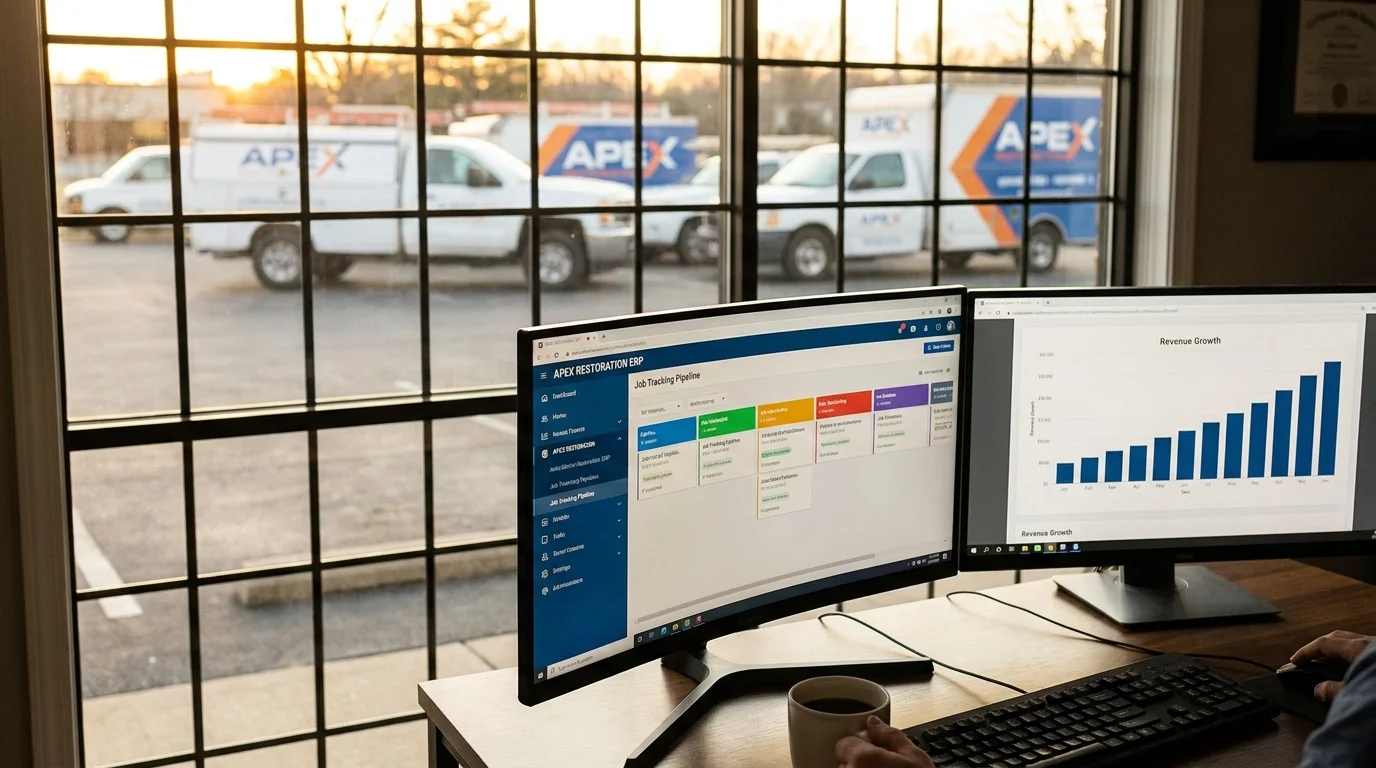
What software should I budget for?
Xactimate ($150-200/month base + per-estimate fees), Encircle or Magicplan ($50-150/month), DASH or Restoration Manager ($200-500/month), QuickBooks ($30-90/month). Plan on $400-800/month in software once you’re operational.
Full operator playbook: Restoration Startup and Scaling Master Guide.