If you have run a GEO campaign for any length of time, you already know the measurement problem: there is no Search Console for ChatGPT, no Performance report for Perplexity, and the analytics you do have leak roughly a third of the traffic into Direct. LLM visibility is real, the buyers are real, but the dashboards that prove it exist have to be assembled from at least three different layers. This is the stack we use for client work in 2026 — what each layer measures, what it costs, and the regex you need to make it work.
What “LLM visibility” actually means
What LLM visibility actually means.
LLM visibility is the percentage of relevant AI-generated answers in which your brand, content, or experts appear. It is not the same as ranking, because answers do not have ranks — they have presence or absence. A useful operational definition borrowed from the practitioner community: track a fixed list of prompts that represent buyer intent for your category, run them across a fixed list of models on a recurring cadence, and count two things. First, mention rate — what percent of responses name you at all. Second, citation rate — what percent of responses include a clickable link back to your domain. Those two numbers are the foundation of every dashboard worth building.
The three measurement layers
The three measurement layers.
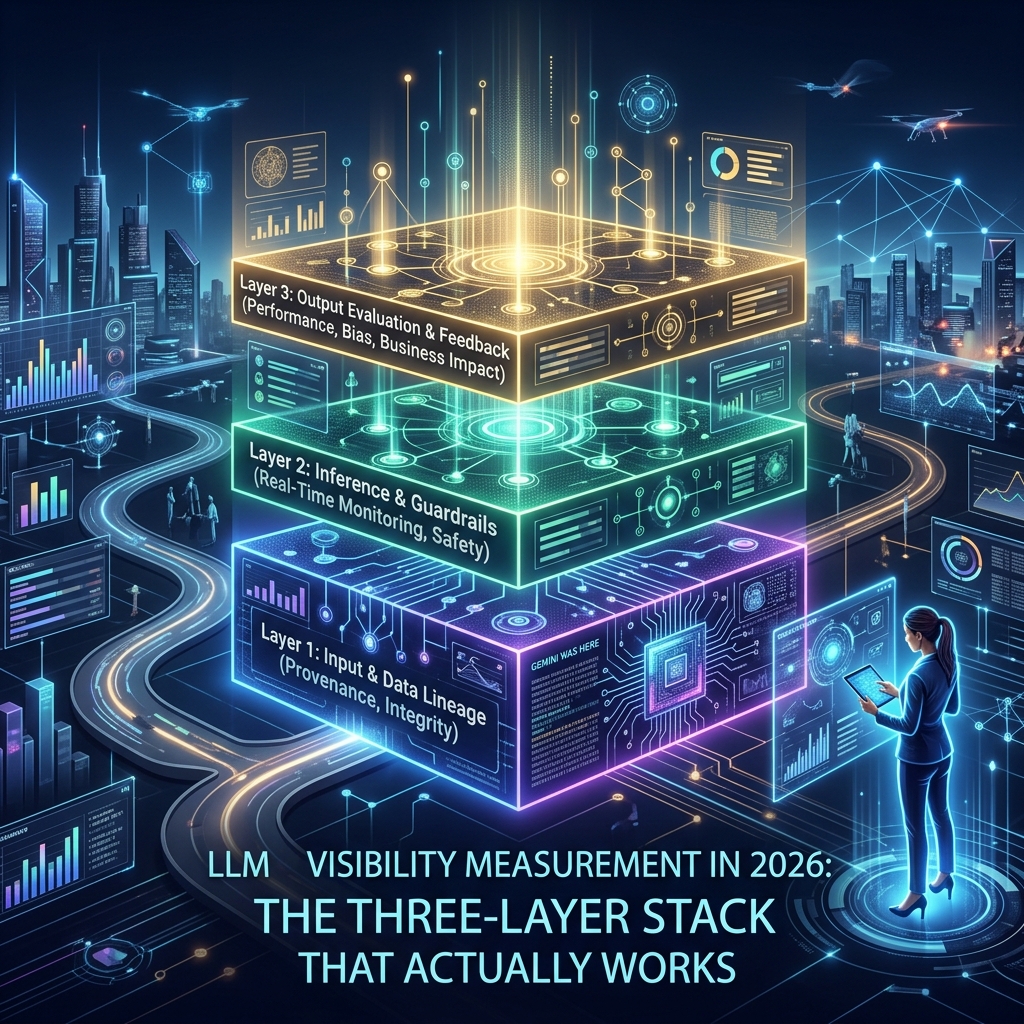
No single tool gives you the full picture, so build the stack in three layers and treat them as complementary.
Layer one — Visibility tracking. Are you in the answer? This is the prompt-monitoring layer. You pick 50 to 200 prompts that a real buyer would type into ChatGPT, Perplexity, Gemini, Copilot, or Claude, then a tool re-runs them on a schedule and parses the responses for your brand and your competitors. This is the only layer that can prove a GEO campaign is working before any clicks happen.
Layer two — Referral analytics. When an AI answer does include a link and a user clicks it, does it show up in GA4? In May 2026 Google added a native “AI Assistant” channel to the GA4 Default Channel Group, which assigns the medium value ai-assistant to recognized referrers and groups those sessions automatically. That is a major improvement, but the underlying problem has not gone away: mobile apps and in-app browsers for ChatGPT, Claude, and Perplexity strip referrer headers, so a meaningful portion of AI-originated visits still arrive as Direct. Practitioner estimates put clean-referrer coverage somewhere in the 60 to 80 percent range depending on the model and the platform mix.
Layer three — Proxy signals. Branded search volume, direct traffic on long-tail URLs that have no other discovery path, self-reported attribution in lead forms, and CRM “how did you hear about us” data. None of these are clean, but together they sanity-check the first two layers and catch the AI traffic that the referrer pipeline lost.
The GA4 channel-group regex
Even with the native AI Assistant channel in place, you still want a custom channel group for granular per-platform reporting and for any property where the new default has not propagated yet. Create one under Admin → Data Display → Channel Groups and put it above Referral in the rule order — GA4 applies rules top-down and Referral will swallow the visit if it gets there first.
Match against the source dimension with this pattern:
That is the full set of recognized referrers as of the May 2026 Google update. For agency reporting we split this into one channel per platform rather than a single “AI” bucket, because the engagement profile is genuinely different — Perplexity sessions tend to behave like high-intent research traffic, while ChatGPT sessions skew more exploratory.
What the tools actually do — and what they cost
The visibility-tracking market in 2026 has consolidated into a recognizable shape. Here is the practitioner read on the four tools most likely to come up in a procurement conversation.
Profound. Tracks coverage across ChatGPT, Gemini, Google AI Overviews, Google AI Mode, Perplexity, Claude, Copilot, Grok, and DeepSeek. The Lite tier starts at $499/month per Profound’s published pricing. This is the enterprise-default option — broadest model coverage, mature competitive view, the price tag to match.
Semrush AI Toolkit. Tracks Google AI Overviews, Google AI Mode, Perplexity, ChatGPT, and Gemini. Available standalone at $99/month per domain or bundled inside Semrush One starting at $199/month. Strong choice if you already run Semrush — the prompt monitoring lives next to your traditional keyword reports.
Otterly. Tracks share of voice across ChatGPT, Google AI Overviews, Perplexity, and Copilot, with AI Mode and Gemini as add-ons. Starts at $29/month on the Lite plan, which makes it the cheapest serious on-ramp in the category. Best for solo operators and small in-house teams that need a real share-of-voice number without a five-figure annual commitment.
SE Ranking AI Visibility Tracker. Bundled inside SE Ranking’s existing SEO platform. Good fit for SE Ranking users; not a category leader for AI alone.
For a single client account we typically run Otterly for the day-to-day share-of-voice number and add Profound when the scope justifies the spend — usually when the client has more than three competitors they care about benchmarking against.
A minimal measurement framework you can ship this week
A minimal measurement framework you can ship this week.
Build it in this order. None of the steps require a tool purchase to begin.
Write your prompt list. Fifty prompts that a buyer in your category would actually type. Mix top-of-funnel (“what is X”), comparison (“X vs Y”), and bottom-of-funnel (“best X for Y”) in roughly equal thirds.
Establish a baseline manually. Run every prompt in ChatGPT, Perplexity, and Gemini once. Record: did the response mention you, did it cite you, who was cited instead. This becomes the zero-point for the campaign.
Configure GA4. Create the AI custom channel group with the regex above and place it above Referral. Verify the native AI Assistant channel is populated on the property.
Set the cadence. Monthly for the manual re-run if you are unfunded. Weekly automated tracking the moment Otterly or equivalent is in the stack.
Report two numbers. Mention rate and citation rate, broken down by model. Everything else is secondary.
The honest limitation
Every tool in this category is sampling. They re-run your prompts on their own infrastructure, not on the model instance a real user hits. The same prompt run twice in ChatGPT in the same hour can return different brand mentions because of retrieval variance and the freshness of the model’s web index. Treat any single-day number as noise and any 30-day trend as signal. The teams that get this right report on rolling four-week windows, not daily deltas.
Where to spend next
Once the measurement stack is live, the next dollar belongs in two places: the content updates that show up in your low-mention-rate prompts, and an LLMs.txt file if you don’t have one yet. Measurement without an action loop is a dashboard, not a campaign. The point of knowing your citation rate is to move it.
What is LLM visibility?
LLM visibility is the percentage of relevant AI-generated answers — across ChatGPT, Perplexity, Gemini, Copilot, and Claude — in which your brand, content, or experts are mentioned or cited. It is measured by running a fixed prompt list on a recurring cadence and counting mention rate and citation rate.
How do I track AI traffic in Google Analytics 4?
GA4 added a native “AI Assistant” channel to the Default Channel Group in May 2026 that automatically groups sessions from recognized AI referrers. For per-platform reporting, also create a custom channel group under Admin → Data Display → Channel Groups, place it above Referral, and match the source dimension against the regex of known AI domains.
What is the cheapest LLM visibility tool?
Otterly is the lowest-priced serious option at $29/month on its Lite plan, with coverage of ChatGPT, Google AI Overviews, Perplexity, and Copilot. It is the recommended starting point for solo operators and small in-house teams.
Why does AI referral traffic show up as Direct in GA4?
Mobile apps and in-app browsers for ChatGPT, Claude, and Perplexity often strip the referrer header when a user clicks an outbound link. Without a referrer, GA4 cannot identify the source and classifies the session as Direct. Industry estimates put clean-referrer coverage at 60 to 80 percent of true AI-originated traffic.
How often should I measure GEO performance?
Report on rolling four-week windows, not daily deltas. The same prompt run twice in the same hour can return different brand mentions because of retrieval variance, so single-day numbers are noise. Weekly automated tracking with monthly reporting is the practitioner standard.
If you want to understand why some Claude Code rollouts compound and others quietly stall, stop looking at license telemetry and start looking at one artifact: the skill library. Every public 2026 case study with sustained productivity gains has the same shape — a committed skill kit, tight CLAUDE.md files, a handful of hooks, and a Friday retro cadence the team actually keeps. Teams that buy seats and skip the artifacts get install-only adoption and a dashboard that reads flat for a quarter.
The 30-engineer case that landed at 35% productivity lift
30-engineer case — productivity lift framing.
The cleanest recent case study comes from a Digital Applied write-up published May 15, 2026 — an anonymized composite tracking a Series-B SaaS shop with thirty engineers across six squads on a Node/TypeScript monorepo. The team had Claude Code seats for the better part of a year before the engagement started. Roughly half the engineers used the CLI weekly. Zero shared skills, no committed project settings, no hooks, two squads with no project memory at all.
The day-zero audit on a 50-point scorecard came in at 19/50. Ninety days later it hit 41/50 — a 22-point shift from late Stage 1 to mid-Stage 3. The headline number reported to leadership: a sustained 35% productivity lift, engagement-weighted, that held flat into month four.
The shipped artifacts behind that number:
22 shared skills, with authorship spread across 9 engineers
11 wired hooks across three archetypes (notification, audit, gate)
CLAUDE.md files pruned and held under 400 lines per repo
The most-invoked skill was commit, accounting for roughly a third of all invocations by month four. That kind of skew is normal in a mature library and tells you which workflow is actually being changed by the rollout.
Why CLAUDE.md hygiene predicts depth
CLAUDE.md hygiene predicts depth.
The single most actionable lesson from the case study is mechanical: cap CLAUDE.md at 400 lines and enforce it in PR review. Two squads in the engagement drifted past 800 lines in sprint two. Their skill-invocation rate ran roughly 40% lower than the four squads that held the line.
The hypothesized mechanism, validated in two follow-up retros: bloated memory causes the model to skim the file rather than internalize it, which produces more generic responses, which makes engineers reach for the tool less often, which drops invocation rates further. The cycle is self-reinforcing in either direction. When the team ran a month-four prune that cut the average CLAUDE.md from 520 to 340 lines, skill-invocation rate rose 12% across the team in the following two weeks.
The discipline: long-form content moves to .claude/docs/ as sub-docs with one-line summaries and links in the main file. The main file stays orientation-shaped — who the team is, what the repo does, where to look for the rest.
The productivity panel mistake every team makes first
Version one of this team’s productivity panel was wrong, and that wrongness taught the rollout more than any single milestone after it. The first panel tracked the metrics license telemetry already covered: total sessions opened per week, total tokens, average session length. It read flat for six weeks while the underlying capability of the team was visibly shifting in retros and PRs.
Version two, rebuilt in week eight, weighted around engagement signals:
Skill invocations split by skill
Subagent runs per week
Time-to-first-meaningful-output for new contributors
Audit-score deltas from the quarterly 50-point scorecard
PR-to-merge time on Claude-Code-assisted PRs versus baseline
By month four the panel showed roughly 410 skill invocations per week, 85 subagent runs per week, new-hire time-to-first-meaningful-output at -45% versus baseline, and PR-to-merge time -18% versus baseline. The 35% headline was an engagement-weighted composite of those signals, not a single measurement — and the team was careful never to frame it as “engineers ship 35% more code,” because that framing invites a debate the panel cannot win.
How this case lines up with the rest of the 2026 cohort
The Digital Applied 30-dev case is not an outlier. A companion case study from the same firm, dated May 13, 2026, covers a 100-developer engineering organization that sustained a 28% productivity lift with a 32-entry skill library over six months. That team ran Claude Code and Cursor side-by-side: Claude Code as the terminal/CLI surface for refactors, multi-file edits, codebase navigation, and review automation; Cursor as the in-editor surface for line-level completion and inline review.
The pattern that replicates across both engagements is the cadence, not the contents. Three ninety-day sprints — install, leverage, governance — plus an explicit sustain phase that starts at day 90 with the same owner and the same Friday retro cadence as the active sprints. Treating days 91+ as a vague quarterly review is the most common reason adoption drifts back to install-only inside two quarters.
What to actually do on Monday
What to actually do on Monday.
If you have Claude Code seats and want a rollout that compounds instead of stalls, the operational order matters more than the contents of your skill library:
Run the day-zero audit and write down the score. The 50-point rubric Digital Applied published is a defensible starting point; any scorecard that distinguishes install from artifacts from governance will do. The number is what makes the case for the engagement internally.
Name the rollout lead and carve 20-30% of their week. Less than that and the calendar slips. The role shape is enough seniority to enforce milestone discipline, enough engineering depth to write skills and hooks rather than just steward them, and enough calendar discipline to keep the cadence intact when product pushes back.
Calendar the four phase-end retros and the month-four review before sprint one opens. Friday retros are thirty minutes per squad per week — the cheapest part of the rollout and the most often skipped. The friction they catch in week three compounds silently for the rest of the sprint if you don’t.
Build the productivity panel deliberately badly in sprint two and rebuild it in sprint three. The version-two rebuild is structural, not incremental. Trying to ship the right panel on the first try usually delays the cadence rather than improving the signals.
Cap CLAUDE.md at 400 lines and enforce it in PR. This is the single highest-ROI hygiene rule in the engagement and the one teams skip most often because completeness feels safer than discipline.
The honest framing: a single-quarter Claude Code rollout takes you from Stage 1 to mid-Stage 3 on a defensible scorecard. Stage 4 — the optimized end-state with deeper subagent governance, a security cadence that catches drift, and a productivity panel that has been iterated against a full quarter of data — is a second-quarter project. The teams that get there are the ones whose sustain phase looks identical to the sprints that preceded it. The teams that drift are the ones whose Friday retro disappeared sometime around month two.
Model versions referenced throughout this piece reflect Anthropic’s current lineup as of May 2026: claude-opus-4-7 (flagship), claude-sonnet-4-6 (workhorse), and claude-haiku-4-5-20251001 (fast). If you are reading this six weeks from now, check the model docs before you copy any string into a config.
This is a working theory, not a finished one. It proposes a specific reframing of how solo operators and small agencies should be using large language models day-to-day, names the failure mode of the current dominant approach, and lays out the experiments that would prove or disprove the central claim. The piece is published here so it can be referenced, tested against, and revised in public as the evidence comes in. If the claim is wrong, the next version of this article will say so.
The Claim, in One Sentence
The claim, in one sentence.
For solo operators and small agencies working with large language models, the dominant mental model — build a knowledge base, feed it to the model, ask questions of the document — is correct for a narrow class of work and wasteful or counterproductive for a much larger class, and the work most operators are doing fits the larger class.
A better mental model for that larger class is what this piece will call Elicitation Over Extraction: the assumption that the model already contains the relevant knowledge as latent capability, and that the operator’s job is to activate the right region of that latent capability with precise, compact prompts rather than to ship the knowledge into the context window through document retrieval. Knowledge stays in training. The work shifts to activation.
This is not a new idea in the AI research literature. It is, however, almost entirely absent from how operators are currently building their personal AI workflows. The gap between what the research suggests is possible and what the operator-tooling ecosystem is building toward is the gap this piece is trying to name and close.
Where the Current Dominant Pattern Comes From
The current dominant pattern in operator-side AI tooling is retrieval-augmented generation, or RAG. The pattern is straightforward. An operator builds a knowledge base — pages in Notion, files in Drive, articles in a vector database, transcripts of YouTube videos, customer support tickets, whatever the operator’s domain produces. When a question is asked of the model, a retrieval system finds the most relevant chunks of that knowledge base, packs them into the model’s context window, and asks the model to answer using that retrieved material as grounding.
The pattern works. For certain shapes of problem, it works very well. It is the right architecture when the operator’s question depends on information that is genuinely outside the model’s training data — proprietary documents, current events that postdate the training cutoff, client-specific details that no public source contains, internal organizational knowledge that exists nowhere on the open internet. For that shape of problem, RAG is not optional. It is the only honest way to get accurate answers, because the alternative is the model inventing details about things it has no real knowledge of.
The pattern has also been heavily promoted by the AI-tooling industry for reasons that have only loosely to do with whether it is the right pattern for any specific operator. Vector databases, retrieval pipelines, document-loading frameworks, embedding services, and knowledge-base products all exist because RAG creates demand for them. The narrative that every operator needs a knowledge base, that every workflow benefits from document retrieval, that the path to better AI work runs through better document organization — that narrative is commercially convenient for the vendors selling the components. It is also half true, which is the worst kind of half true, because the part that is true gets used to justify the part that isn’t.
The part that is true: when the model lacks the specific knowledge needed for the task, retrieval helps. The part that isn’t: when the model already has the knowledge, retrieval is at best redundant and at worst actively degrades the response. The middle case — when the model has the general knowledge but lacks the specific framing, voice, or activation — is the case the operator ecosystem has not figured out how to name or handle, and it is also the case most operators are actually in for most of their work.
The Specific Failure Mode
The specific failure mode of extraction.
Picture an operator who wants to write content in the voice of a particular thinker — call this thinker Senior Operator-Investor, someone who has been writing publicly for twenty years and whose work is heavily represented in the model’s training data. The operator’s default move, under the RAG pattern, is to collect transcripts of that thinker’s podcasts and YouTube videos, structure them in a knowledge base, and feed them to the model along with the question.
What actually happens when the operator does this is the following. The 20,000-token transcript dump enters the model’s context window. The model attends to that transcript on every generation step, scanning for relevant passages, weighing them against the question being asked. This is computationally expensive, slow, and noisy — most of the transcript is irrelevant to any specific question. The model also already knew this thinker’s voice from training. The transcript is mostly redundant with patterns the model can already produce from its weights. The operator is paying tokens to remind the model of things the model knows.
The more efficient version is to write a 200-token activation prompt: a careful description of the thinker’s voice, their characteristic moves, their temperament, and a few canonical reference points. That prompt activates the same region of the model’s latent space that the 20,000-token transcript was trying to activate, at one one-hundredth the token cost, with less attentional noise, and with output that is often qualitatively better because the model is not being pulled in inconsistent directions by tangentially relevant transcript passages.
The 100x token reduction is not theoretical. It is what happens in practice when prompts are designed for activation rather than information transfer. The reduction is also not the most important benefit. The more important benefit is that the operator stops doing knowledge-engineering work that is duplicative with the training the model has already received, and starts doing the work that is actually distinctive: designing the activation patterns themselves.
The failure mode of the current dominant pattern is that operators are spending their time on the wrong layer. They are building warehouses when they should be building switchboards. The warehouse holds information the model already has. The switchboard turns on specific patterns of cognition that the model can already produce but does not produce by default.
What the Research Literature Says
There is a real body of research on what is called persona prompting, role conditioning, and activation steering. The findings are nuanced and they refine the claim above in ways worth knowing.
Persona prompting does change model output. The effect is measurable and consistent across many tasks. The voice, style, and reasoning approach of the model can be meaningfully shifted by a few hundred well-chosen tokens at the start of a prompt. This part of the picture confirms the central intuition of Elicitation Over Extraction: latent capability is real, activation prompts can reach it, and the activation work is meaningful work.
But the same research literature surfaces an important caveat that the strong version of the claim has to address. Persona prompting consistently helps with style, voice, clarity, and tone — the things one might call the surface texture of generation. It is less consistent, and sometimes actively harmful, on tasks that depend on precise factual recall, multi-step logical reasoning, or strict accuracy on benchmarked knowledge. In some studies, telling a model to “act like an expert” on a factual recall task decreased accuracy compared to no persona at all. The model became so focused on performing expertise that it stopped retrieving its underlying knowledge cleanly.
This is important and it changes the shape of the claim. Elicitation Over Extraction is not a universal replacement for RAG. It is the right approach for tasks where what the operator needs from the model is voice, framing, judgment, or pattern-matching against a thinker’s known mode. It is the wrong approach — and may be worse than neutral — for tasks that depend on precise factual recall of specific data points.
The honest version of the claim, then, is something like the following. Operator work falls into at least three different shapes. The first shape is “I need the model to produce content in a specific voice or style” — activation prompts dominate, RAG is wasteful. The second shape is “I need the model to retrieve specific facts from a corpus the model has not seen” — RAG dominates, activation prompts are insufficient. The third shape is “I need the model to apply judgment to information I am providing” — both layers matter, with activation handling the judgment and retrieval handling the information.
Most operators are running shape one and shape three workflows but using shape two tooling. That mismatch is the source of the inefficiency. The fix is not to abandon retrieval. The fix is to know which shape any given workflow is and use the right layer for that shape.
Why This Is Not Obvious
Why this is not obvious.
If the distinction is real and well-documented in research, the question is why operators are not already organizing their work this way. Three reasons, in roughly increasing order of importance.
The first reason is that “knowledge engineering” carries a status premium that “elicitation engineering” does not. Building a structured knowledge base sounds like real work. Writing a 200-token prompt sounds like a parlor trick. The fact that the 200-token prompt may actually be doing more useful work than the knowledge base does not show up in the social register of the activity. Operators who are evaluating their own productivity, even if only to themselves, tend to over-weight effort that looks substantial and under-weight effort that looks easy, even when the easy effort is producing better results. The shape of effort matters more than the result of effort, until the operator becomes deliberate about correcting for that bias.
The second reason is that the dominant vendor narrative pushes against elicitation. Every vendor selling a vector database, every vendor selling a document loader, every vendor selling a RAG pipeline product has a commercial incentive to frame all problems as retrieval problems. The vendor ecosystem does not have a strong commercial incentive to teach operators how to write better activation prompts, because activation prompts do not require vendor products. There is no SaaS company selling “the activation layer” because the activation layer fits on one Notion page and does not need to be sold. The absence of a commercial narrative around elicitation makes it invisible to operators who are learning about AI through vendor content.
The third reason is the deepest one and it is about the relationship between knowledge and accessibility. The model containing knowledge in its training is not the same as the model producing that knowledge when queried. A first-year medical student who has read every textbook on the shelf is not the same as a senior physician who can produce the right diagnosis under pressure. The knowledge is the same in both cases. The accessibility is different. The senior physician has navigated the latent space of medical knowledge so many times that the relevant patterns activate automatically when the case presents. The first-year student has the same knowledge in storage but cannot get to it on demand under realistic conditions.
Operators are encountering models that are, in a precise sense, in the first-year-medical-student position with respect to most domains. The knowledge is there. The activation is unreliable. The dominant vendor response to this is to bypass the activation problem by stuffing the relevant knowledge directly into the context window — which works but treats the symptom rather than the cause. The Elicitation Over Extraction response is to do the activation work directly, build a library of activation patterns that reliably reach the relevant latent regions, and stop treating the model as an empty container that needs to be filled with documents.
The Working Theory
Pulling the threads together, the working theory of this piece is the following set of connected claims.
Claim one. Large language models contain enormous latent knowledge that is not, by default, reliably accessible through naive prompting. The knowledge is in the weights. The activation is the problem.
Claim two. The dominant operator response to this — document retrieval and knowledge-base construction — addresses the activation problem indirectly, by bypassing latent knowledge in favor of in-context knowledge. This works but is inefficient when the latent knowledge is already strong, and the inefficiency compounds across many operator workflows.
Claim three. A complementary approach, currently underbuilt in operator tooling, is to develop a library of compact activation prompts that reliably steer the model into specific cognitive modes — voices, frames, temperaments, schools of thought. This library serves a different function than a knowledge base and the two are complements, not substitutes, but most operators have heavily over-built the knowledge-base side and barely built the activation side.
Claim four. The right architecture for an operator’s personal AI infrastructure is therefore three-layered: a library of activation patterns for tasks that depend on voice, framing, and judgment; a structured set of retrieval sources for tasks that depend on specific external knowledge the model lacks; and a clear decision rule for which layer a given task draws from. The current state of most operators’ setups has layer two heavily built, layer one missing entirely, and layer three not articulated at all.
Claim five. The work of building the activation layer is fundamentally different from the work of building the retrieval layer. The retrieval layer is a knowledge-engineering problem and is well-served by the existing vendor ecosystem. The activation layer is closer to a writing and curation problem — closer to compiling a literary anthology than to building a database. It requires taste, exposure to many voices, and the willingness to test and refine specific prompts against actual generations until they produce the intended cognitive mode reliably. This is craft work, not engineering work, which is part of why the vendor ecosystem has not produced it.
Claim six, and this is the operator-specific implication. For a solo operator who has already built substantial knowledge infrastructure, the highest-leverage next move is not to build more knowledge infrastructure. It is to build the activation layer, integrate it with the existing knowledge layer through clear decision rules, and audit which existing workflows are running in the wrong layer. Most operators with mature stacks will find that a meaningful percentage of their token consumption is being spent on retrieval that activation could replace, and a meaningful percentage of their workflow latency is coming from documents the model did not need.
The Falsifiable Predictions
A working theory is only useful if it can be tested. The following are specific, falsifiable predictions that follow from the working theory. If any of them turn out to be wrong, the theory needs revision. If most of them hold, the theory has earned the right to be promoted from working hypothesis to operational doctrine.
Prediction one. For tasks that are primarily about voice, framing, or stylistic mimicry of a well-known thinker, a carefully written 200-token activation prompt will produce output of equal or greater quality than a 10,000-to-20,000-token transcript dump of that thinker’s work, as evaluated by blind comparison. The expected effect size is large for thinkers heavily represented in training data and shrinks toward neutral for niche or rarely-published thinkers. The test is straightforward: pick five well-known operator-thinkers whose work is heavily public, write activation prompts for each, generate responses to the same prompt using each method, and have multiple readers blind-rate the outputs.
Prediction two. Activation prompts will significantly underperform retrieval-augmented prompts on tasks that depend on precise factual recall of specific data points — dates, numbers, names, technical specifications, or any fact the model has not seen during training. This is not a weakness of the theory; it is the theory specifying its own limits. The test is to construct a set of factual-recall tasks where the relevant facts are either in the model’s training or outside it, and observe that activation alone fails on the outside-of-training cases.
Prediction three. For mixed-shape tasks — those requiring both voice/framing and specific factual recall — a hybrid approach using both an activation prompt and a small, focused retrieval payload will outperform either approach alone. The retrieval payload should be much smaller than the default RAG pattern produces, because the activation prompt is doing the framing work and the retrieval only needs to supply the specific facts. The test is to construct mixed-shape tasks and compare three configurations: activation alone, retrieval alone, and minimal hybrid.
Prediction four. Token consumption for an operator who switches from a retrieval-default workflow to an elicitation-default workflow with retrieval used only where required will drop by at least 50% across a representative week of operational tasks, with output quality holding constant or improving. The test requires the operator to instrument their token usage before and after the switch, with the same task types running through both configurations.
Prediction five. The activation layer, once built, will compound faster than the retrieval layer compounds. New activation prompts can be derived from existing ones with small modifications. New retrieval sources require substantial setup and maintenance per source. Six months after starting both, the operator will have a richer activation library than retrieval library, in terms of distinct cognitive modes available on demand, even with comparable effort spent on each.
Prediction six. The most useful activation prompts for an operator will not be persona prompts in the style most commonly published online. They will be more specific. Not “respond as an expert investor” but “respond as someone who has been wrong publicly enough times to have lost the need to perform certainty, who thinks in terms of base rates and second-order effects, and who treats the strongest argument against their own position as the most important argument to engage with first.” The granularity matters. The cognitive mode is the unit, not the role or job title. The test is to compare generations from generic-role prompts against granular-mode prompts and observe that the granular versions produce more distinctive and useful output.
The Experimental Protocol
The above predictions are testable, but they require a deliberate setup to test honestly. The protocol that this piece commits to running, with results published in a follow-up, looks like this.
Phase one is the activation library build. Five to ten distinct cognitive modes are identified, each one specifying a particular school of thought, temperament, or framing that the operator finds useful. Each mode gets an activation prompt of between 100 and 400 tokens. The prompts are written, tested, refined, and locked. The library is small enough to fit on a single page and visible enough that the operator can choose modes deliberately rather than defaulting to whichever was most recently used.
Phase two is the workflow audit. The operator’s actual workflows over a representative two-week period are catalogued. Each workflow is classified by shape: voice-and-framing, factual-recall, or mixed. The current configuration of each workflow is documented — what knowledge sources it draws from, how much retrieval it does, what its token costs are.
Phase three is the reconfiguration. Each workflow is reconfigured based on its shape. Voice-and-framing workflows switch to activation-prompt-only. Factual-recall workflows keep retrieval but trim the payload to the specific facts required. Mixed workflows switch to hybrid configuration. The total token consumption and output quality of the reconfigured stack is measured against the baseline.
Phase four is the head-to-head test. Specific representative tasks are run through both the old and new configurations in parallel, with output graded blind by the operator and ideally by a second reader. The results are published with no editing of inconvenient outcomes.
This protocol is honest if the results are published whether or not they confirm the theory. The commitment of this piece is that they will be. If the protocol shows that the existing retrieval-default configuration was actually working better than expected, the follow-up article will say so. If the protocol shows that the activation-default configuration produces equivalent or better output at materially lower token cost, the follow-up article will report the specific magnitudes. Either way, the working theory will be updated to match the evidence.
What This Does and Does Not Imply for Specific Operator Choices
If the working theory is roughly correct, a few specific implications follow for how solo operators should be thinking about their AI infrastructure.
It does not imply that knowledge bases are wasted effort. Some knowledge truly is not in training data — client specifics, internal processes, current events, proprietary frameworks. That knowledge has to live somewhere outside the model, and a structured knowledge base is the right place for it. The theory is about not duplicating general-domain knowledge that is already in training into knowledge bases that exist to remind the model of things the model already knows.
It does not imply that retrieval-augmented generation is the wrong architecture. RAG is correct for the class of problem it was designed for. The theory is about applying RAG to problems it was not designed for and getting worse outcomes than a simpler activation approach would have produced.
It does imply that operators should audit their knowledge bases. Some material in those bases is irreplaceable; some is duplicative with training and could be deleted with no loss of capability. The audit is honest only if the operator is willing to be told that some of their hard-won knowledge structuring was unnecessary.
It does imply that operators should start building activation libraries — small, dense pages of compact prompts that reliably activate specific cognitive modes. The library is more valuable than its size suggests, because each prompt represents a reliable reach into a region of latent space that would otherwise be hit only by accident.
It does imply that the dominant vendor narrative around AI tooling — that more documents, better retrieval, larger context windows, and more sophisticated knowledge bases are the path to better AI work — is partially right and partially misdirected. The operator who builds carefully on the activation side will, over time, produce better work with less infrastructure than the operator who builds heavily on the retrieval side without considering the activation question.
And it does imply, finally, that the relationship between operators and large language models is being mismodeled in most current operator tooling. The model is not an empty vessel that needs to be filled with documents. The model is a vast latent capability that needs to be activated. The job of the operator is to learn the activation. Most of the actual leverage is in that learning.
The Honest Limits of This Theory
This theory is a working hypothesis published in public, and a few things about it deserve to be flagged before any reader uses it to make operational decisions.
The theory is based on the current generation of large language models. If the next generation handles activation differently — through better default behavior, through changes in how training data is organized, through architectural shifts toward mixture-of-experts routing that handles activation natively — the operator-side implications change. The theory should be re-tested at every model generation, not treated as settled.
The theory is based on the current state of operator tooling. If a future vendor builds a strong “activation layer” product that handles the work this piece is describing as operator-side craft, the operator’s optimal allocation of time shifts. The theory should be revised as the tooling landscape changes.
The theory is based on the specific shape of work that solo operators and small agencies do. Large enterprises with very different scale, different data privacy constraints, and different output requirements may need different architectures. The theory is operator-flavored on purpose; it does not claim to be a universal description of how all users should engage with these models.
And the theory is, finally, a theory. It is more rigorous than a guess but less established than a doctrine. The predictions it makes are testable and will be tested. Until they are, the right posture is interested skepticism rather than adoption. The reader of this piece is invited to argue with it, propose better versions, run the experimental protocol independently, and report results that contradict the central claim if they find them. That is how working theories should be treated. The article is not the final word. It is the opening of a conversation that the evidence will close.
What Happens Next
The experimental protocol described above will run over the next sixty days. Phase one — building the activation library — begins this week. Phases two through four follow on a published schedule. A follow-up article will report results, including any results that contradict the theory laid out here.
In the meantime, this piece serves as the reference point. It is what was thought to be true on the date of publication. The version of these ideas that the evidence eventually supports may be quite different. That is the point. Working theories are published so they can be refined. The publication is the commitment to the refinement.
If the theory is right, the implications for how solo operators should be building their AI infrastructure are significant and largely opposite to what the current vendor ecosystem is pushing toward. If the theory is wrong, knowing it is wrong is itself useful — the failure modes that show up during testing will surface things about how these models actually behave that no current piece of operator-side writing has named clearly.
Either way, the work is the work. The theory is published. The experiments run next. The evidence settles it.
A Second Take on a working decision: whether a solo operator should build production-grade infrastructure on alpha SDKs, or wait for general availability. This is not a hypothetical. Yesterday a fleet of ten Notion Workers shipped in three hours on an alpha SDK — eight of them working end-to-end, two of them gated behind capabilities that have not been enabled. Today the question is whether that was leverage or whether that was a detour. Both cases get made here.
The Thesis from the First Take
The argument for building on alpha software is older than software itself. It is the argument every operator who ever shipped early made to themselves: the people who get to the new surface first do not just get there first. They shape what arrives. They become the reference customer. Their friction becomes the roadmap. The ones who wait until everything is polished are buying the polish someone else paid for — and giving up the position that polish makes invisible.
In the specific case of Notion Workers, the argument is even stronger. The SDK is free until August 11, 2026. The fleet built in one session validated four full capability shapes — tool, sync, sync-with-external-HTTP, and webhook with HMAC. The friction points discovered were specific enough to compile into a Slack-ready writeup to Notion’s product-ops team. The auth gotcha that cost four OAuth attempts at the start of the session is now a documented doctrine that any future operator on Windows-WSL will inherit for free. That is the trade you make on alpha. You pay in friction. You earn in surface knowledge and the right to be a voice in what gets built next.
There is a deeper version of this argument that matters more than the tactical one. Production infrastructure is not built by people who watch other people build production infrastructure. It is built by people who put their hands on the actual surface, find the actual edges, and develop the kind of tacit understanding that no documentation, however good, can transfer. Reading about how a Worker handles a webhook signature is different from having one fail at 11 PM because the secret was not pushed. That second experience is what gets called intuition later. It cannot be downloaded. It has to be earned.
The first take, then, is not really about Notion Workers at all. It is about the deeper claim that the people who learn the new surfaces first are the people who define what those surfaces are for. Everyone else inherits a category that was already decided.
And the Case for Waiting
Now the counter.
The same fleet of ten Workers that proved four capability shapes also revealed something that the celebration glosses over. Two of the ten — the automation Worker and the AI connector Worker — could not be tested at all. They deployed clean. The code is fine. The bundles are sitting in the Notion infrastructure. They do not run because the user account does not have alpha access to those specific capabilities. The fix is not a code change. The fix is a permission grant that has to come from inside Notion. Until that happens, two of the ten Workers are not Workers. They are receipts for work done that cannot ship.
That is the first hidden cost of alpha. The capability gates are not announced. They become visible only at the moment of attempted use, which is the most expensive moment to discover them. A solo operator’s time is the binding constraint of the entire operation. Spending it on bundles that cannot run because of an upstream permission is a worse trade than it looks on the surface.
The second hidden cost is the dispatch gap. The Workers SDK in its current state assumes a developer running commands from a laptop. The `–local` execution mode requires a WSL Ubuntu environment with the right environment variables exported, the right token loaded into the right config file, and a human being to type the command. There is no remote trigger surface available through the Notion MCP server. There is no scheduled execution that an external system can verify. There is no way for an AI assistant working from a mobile session to invoke a Worker, even one already deployed and working. The Workers exist. They can be triggered. But only from one specific laptop, by one specific human, sitting in front of it.
That gap turns out to matter more than any individual capability. The reason for building Workers in the first place was to remove the operator from the critical path of routine operations. If the operator still has to be physically present to start the Worker, the Worker has not removed the operator from the critical path. It has just changed the operator’s job from doing the work to invoking the thing that does the work. The leverage is real but smaller than advertised.
The third hidden cost is the one nobody talks about. It is the cost of being early on a surface that may never become widely adopted. Every hour spent learning the idiosyncrasies of an alpha SDK is an hour not spent on a surface with broader applicability. If Notion Workers become the standard automation pattern for the platform, the early learning compounds for years. If Notion deprioritizes the SDK, retires it quietly, or pivots to a different model — none of which are unlikely for an alpha product — that learning has a shelf life measured in months. The operator who waited for GA still has all of the time they did not spend on the deprecated surface. The early adopter has bills receivable in a currency that no longer trades.
The case for waiting, then, is not a case for timidity. It is a case for opportunity cost. Every alpha SDK is competing with every other thing that operator could have built in the same window. The question is not “is the alpha SDK valuable” — it usually is, in some narrow technical sense. The question is “is the alpha SDK more valuable than the next-best use of the same hours.” For a solo operator, that comparison is often unflattering to the alpha.
What the First Take Gets Right
The first take is correct that surface knowledge cannot be downloaded. The team that put hands on the alpha now knows things about how Notion Workers authenticate, how the schema module differs from the builder module, how the webhook HMAC pattern resolves, and how the capability registration phase fails in five different ways. None of this is in any document anyone has written. All of it will be implicit in every future architectural decision the operator makes about Notion as a platform. That is not nothing. That is a kind of capital.
The first take is also correct that the price of alpha is paid once, while the position earned can compound. The four OAuth attempts that cost an hour of frustration on Worker number two cost zero hours on Worker number three. The capability shape that took thirty minutes to validate the first time took twelve minutes the second time and would take five minutes the next time it appears. Learning curves are nonlinear in the operator’s favor. The cost is front-loaded. The return, if the surface survives, is durable.
And the first take is correct about something the counter-argument tends to miss: there is no neutral position. The operator who waits for GA is not pausing. They are doing something else with that time. If the something else is also valuable, the wait is rational. If the something else is consuming content about other people’s builds, the wait is just deferral dressed up as discipline.
What the Second Take Gets Right
The second take is correct that capability gates are real, that dispatch gaps are real, and that the operator’s time is the binding constraint on everything. None of those are abstract concerns. The two gated Workers from yesterday’s session are sitting in the infrastructure right now, doing exactly nothing, because a permission grant has not arrived. The eight working Workers cannot be triggered from anywhere except one specific laptop. The operator who wanted to invoke a Worker from a mobile session this morning could not.
The second take is also correct that the deeper question is opportunity cost. If the same three hours had gone to building a Cloud Run service that wrapped the same logic, the result would be a working dispatch surface that any system could invoke — Slack, Notion automations once they’re enabled, scheduled cron, a webhook, an AI assistant on a phone. That service would not have been blocked on alpha permissions. It would not have required a specific WSL environment to invoke. It would have been ready for use the moment it deployed. The Workers fleet is more capable per line of code than the equivalent Cloud Run service would be, but it is less invokable. For an operator whose problem is “I want this to run when I am not there,” the less-invokable solution is the worse solution, even if it is more elegant.
And the second take is correct that the rhetoric of “shaping the product” tends to flatter the early adopter beyond what the evidence supports. Most early adopters do not shape products. They use products that other early adopters shaped before them, and they generate friction reports that get triaged into a backlog that may or may not produce changes before the product changes direction. The reference customers who actually get heard tend to be the ones with the largest accounts, the most followers, or the deepest relationships with the product team. A solo operator is rarely any of those things. The Slack message to Notion’s product-ops team yesterday was a good message. Whether it produces changes in the SDK is a question whose answer is mostly out of the operator’s hands.
The Test That Decides It
Both takes are partially right, which is what makes the decision interesting rather than obvious. The test that decides between them, for any specific operator on any specific alpha SDK, is not whether the SDK is interesting or whether the friction is tolerable. It is a simpler test, and it is the only test that matters:
Does the alpha SDK shorten the path to a result the operator already wanted, or does it create a new path to a result the operator did not previously care about?
If the SDK shortens an existing path, alpha is leverage. The operator was going to solve the problem anyway. The alpha tool reduces the time and cost of solving it. The friction is just the friction of any new tool, and the early-mover advantage is real because the operator’s underlying intent was real.
If the SDK creates a new path to a new problem, alpha is a detour. The operator is now solving a problem the SDK suggested rather than a problem the business required. The friction is no longer in service of any pre-existing goal. The early-mover advantage is hypothetical because there is no business outcome the alpha is actually serving — only an interesting tool that happens to exist.
The Notion Workers case fails this test on the strict reading. The operator did not have an existing need to schedule recurring Notion automations. The Workers SDK suggested that need. The fleet was built to validate the SDK, not to solve a pre-existing operational problem. By the strict test, this is a detour.
But the strict test misses something. The operator did have an existing need — to remove themselves from the critical path of routine operations. That need pre-dated the SDK by years and survives the SDK if it gets retired. The Workers SDK was one possible tool to serve that need. Cloud Run was another. Notion’s own automations product was a third. The fleet built yesterday tested whether Workers was the right tool for the existing need. The answer, on the evidence, is: partially. Workers are excellent at the work itself. They are not yet good at the dispatch problem. That is useful information, and it was acquired in three hours at zero dollar cost.
By the strict test, the build was a detour. By the deeper test, it was a calibration run on a candidate tool for a real need. Both readings are defensible. The operator will know which is correct when the next decision arrives: whether to invest in the dispatch gap that would make Workers fully production-ready, or whether to redirect that investment toward a Cloud Run service that solves the dispatch problem natively. That decision is the verdict. Until it is made, the build is neither leverage nor detour. It is a question still open.
The Verdict
The verdict, for this specific case, leans toward continuation but with a different framing.
Notion Workers are not a production automation platform yet. They are a research investment in what a production automation platform on the Notion surface might look like. The eight working Workers are not deliverables. They are experimental rigs that produced specific knowledge about a specific surface. That knowledge is valuable independent of whether Workers ever become the standard pattern. It is also valuable independent of whether the operator continues to use Workers at all.
The right next move is not to abandon the Workers fleet. It is also not to keep building Workers as if the dispatch problem will solve itself. The right next move is to add a Cloud Run dispatcher — a small service that accepts authenticated POST requests and, internally, triggers the appropriate Worker. That dispatcher would close the dispatch gap immediately, would work for any future Worker without further integration, and would also work for any non-Worker job the operator wants to invoke from anywhere. It would cost less to build than the original Workers fleet because it would inherit all the lessons.
That move makes both takes correct. The first take wins on the claim that the alpha investment paid for itself in surface knowledge and capability shape validation. The second take wins on the claim that the dispatch gap is the binding constraint and that the path through Cloud Run is the better answer for that specific gap. Neither take is wrong. Both takes describe a real part of the trade.
The deeper lesson, if there is one, is that the question “should an operator build on alpha SDKs” is the wrong question. It is too general to answer. The right question is “does this specific alpha SDK shorten a path the operator already cares about, and what is the operator’s plan for the parts of the path the SDK does not yet cover.” If both halves of that question have answers, the alpha investment is rational. If either half is missing, the alpha investment is a detour wearing the costume of leverage.
For Notion Workers, the first half has an answer. The second half got its answer today. The Cloud Run dispatcher is the missing half. Once it is built, the fleet that looked like a possible waste yesterday becomes the foundation of something usable. That is the way alpha investments usually work, on the cases where they work. They look like a detour right up until the moment the missing piece arrives. Then they look like infrastructure.
And that, finally, is the second take. Not “wait for GA.” Not “always ship on alpha.” Something more specific: build on alpha when the SDK shortens a path you already care about, and when you have a plan for the parts of the path the SDK does not yet cover. If both conditions hold, alpha is leverage. If either fails, alpha is a detour. The Workers fleet is not yet a finished case. It is a case in progress, and the progress depends on what happens next, not what happened yesterday.
The original take ran here yesterday, in a different form, when a fleet of ten Workers was treated as proof that alpha investments pay off. This take argues that the proof is still pending — and names the move that converts the pending proof into a finished one.
TurboTax did not kill the accountant. Neither did QuickBooks, H&R Block’s software, or the dozens of automated tax-prep and bookkeeping platforms that have absorbed the procedural floor of accounting work over the last two decades. What they killed was a specific kind of accountant — the one whose business was preparing returns and reconciling books and nothing else. The CPAs and bookkeepers thriving in 2026 are not selling tax returns or bookkeeping work. They are selling something the platforms structurally cannot deliver: a multi-decade trusted advisor relationship that integrates tax, strategy, financial planning, and ongoing business consulting.
The accounting software platforms commoditized the procedural floor of the profession in two waves. The first wave, starting in the early 2000s, was the consumer tax software taking over simple personal returns. TurboTax made the W-2 return a fifteen-minute exercise that anyone could complete without an accountant. The accountants whose business depended on simple personal returns got squeezed.
The second wave was the small business software taking over routine bookkeeping. QuickBooks, Xero, and the broader small business accounting stack absorbed the day-to-day reconciliation work that used to require bookkeepers and lower-level accounting staff. Combined with bank feeds, automatic categorization, and AI-assisted reconciliation, the bookkeeping floor became cheap enough that any small business could handle most of it internally.
AI is now adding a third wave on top of these. Document processing, tax research, basic tax return preparation, financial analysis, and advisory drafting are all being absorbed by AI tools that accounting firms are deploying internally. The procedural floor is being compressed yet again.
The narrative through all of this has been that accounting was being commoditized to death. The narrative was wrong. The accountants whose value was the procedural work got compressed. The accountants who built advisory practices — the trusted advisors, the strategic counselors, the business consultants who happened to do taxes too — became more valuable than ever.
What the Ceiling Actually Is in Accounting
The ceiling work in accounting is the trusted advisor relationship, and it operates at a completely different level from tax preparation or bookkeeping.
The trusted advisor accountant is not preparing the return. They may oversee the preparation, but the actual return preparation is increasingly automated or handled by junior staff with AI assistance. What the advisor is doing is something different. They are the first call when the client is considering whether to take an offer for their business. They are the first call when the client’s parent dies and the estate is complicated. They are the first call when the client is considering a major equipment purchase that will affect cash flow and tax position. They are the first call when the client’s child wants to start a business and needs structural advice.
The relationship is multi-decade. The accountant knows the client’s business intimately, the client’s family structure, the client’s goals, the client’s risk tolerance, and the client’s history. The annual tax return is the artifact of the relationship, not the product. What the client is buying is the ongoing access to a trusted financial mind that understands their specific situation and is engaged with their decisions on a continuous basis.
This work cannot be done by software. It cannot be done by AI. It can only be done by a human who has spent years developing genuine knowledge of the specific client’s specific situation, in a profession that requires technical depth and judgment-based integration across tax, finance, business, and personal life domains.
The Practice Structures That Win
The accounting firms that have successfully shifted to the advisory model share several specific characteristics.
They specialize in a defined client segment. Not “small business” in the abstract. A specific kind of small business — restaurants, dental practices, manufacturing companies, professional service firms, real estate investors. The specialization allows the advisor to develop genuine depth in the specific tax, financial, and strategic issues that segment faces. The advisor becomes the recognized expert for that segment in their region, which generates referrals at a rate generalist firms cannot match.
They sell engagement structures, not transactions. The traditional model bills tax preparation as a discrete annual transaction. The advisory model bills an ongoing retainer that includes the tax work plus continuous advisory access. The client pays monthly or quarterly, knows what they are paying, and uses the access regularly. The economics for the firm are dramatically better because the revenue is predictable and the client utilization of the advisor’s time tends to be more efficient under retainer billing than under hourly billing.
They build cross-domain integration capabilities. The trusted advisor accountant needs to engage credibly on tax strategy, business strategy, financial planning, estate considerations, and operational decisions. This requires either developing capabilities internally or building strong coordination relationships with the client’s other professionals — financial advisors, attorneys, insurance agents, bankers. The firms that win are the ones whose accountants can credibly coordinate across these domains.
They use AI and platform tools aggressively for the procedural floor. Tax preparation, document handling, basic research, financial analysis, routine reporting — all increasingly automated. The firms that try to protect this work from automation lose. The firms that automate it and reinvest the time in advisory relationships win.
They develop their senior staff into advisors deliberately. The traditional accounting career path produced technical specialists. The advisory path requires different skills — relationship management, business strategy, integrative judgment, client communication, comfort with ambiguity. The firms that develop these capabilities deliberately produce advisors. The firms that keep training pure technicians keep producing tax preparers who will be commoditized.
How a Solo or Small Firm Builds the Advisory Practice
The transition to advisory work is achievable for solo practitioners and small firms, not just the large national firms. The playbook is more focused but the moves are the same.
Pick a specific client niche you can serve at advisor depth. Five to ten distinct client types is too many. One or two well-defined niches is right for a solo or small firm. The narrowness is the moat. The advisor who deeply understands the financial life of dental practices in a region will outperform the generalist accountant serving every kind of business.
Develop the technical depth required for the niche. Not just tax. Tax plus business strategy plus financial planning plus operational issues specific to the niche. Read the trade publications. Attend the conferences. Become genuinely expert in the niche, not just credentialed.
Build the relationships with the other professionals serving the niche. The attorneys, the financial advisors, the insurance agents, the bankers, the business brokers who specialize in that segment. Your value to clients includes the ability to refer them to other professionals who understand their world. The relationships are the network.
Convert clients from transactional to retainer engagements deliberately. Most clients in transactional relationships will accept a conversion to retainer billing if the advisor presents the value clearly. The conversion is the moment the business model shifts. Once the retainer is established, the relationship deepens because the client uses the access.
Use AI and software for the procedural work. Automate everything that can be automated. Spend the time on the advisory work that defines the practice.
Frequently Asked Questions
Will TurboTax and QuickBooks replace accountants?
No. The platforms have commoditized the procedural floor of accounting — simple tax preparation and routine bookkeeping — but cannot replicate the trusted advisor relationship that integrates tax, strategy, financial planning, and business consulting. The accountants whose value was procedural work have been compressed. The accountants who built advisory practices thrive.
What is a trusted advisor accounting practice?
It is the practice model where the accountant serves clients on an ongoing retainer basis rather than as discrete annual transactions. The client pays for continuous access to the accountant’s judgment across tax, business, financial, and strategic decisions. The annual tax return is the artifact of the relationship, not the product.
How do accountants compete with platforms like TurboTax and QuickBooks?
Not on price or convenience for simple returns and routine bookkeeping. The platforms will always win on those. Accountants win by delivering integrated advisory work — strategic counsel, business consulting, multi-domain coordination, ongoing judgment — that the platforms structurally cannot do.
What kinds of clients want a trusted advisor accountant?
Business owners with complex financial lives, high-income professionals coordinating multiple financial decisions, families with significant assets or businesses, and any client whose financial situation involves ongoing decision points where strategic judgment matters. The pool is large and growing as platforms commoditize the simple-return market.
How does an accounting firm transition from transactional to advisory?
Pick a specific client niche. Develop genuine depth in that niche. Build coordination relationships with other professionals serving the same niche. Convert existing clients from transactional to retainer engagements deliberately. Use AI and software for the procedural work. Develop staff into advisors rather than pure technicians.
How long does it take to build an advisory accounting practice?
Two to three years to establish the niche specialization and the coordination relationships, with significant compounding after year five as the niche reputation generates referrals at a rate that generalist firms cannot match.
The Bottom Line
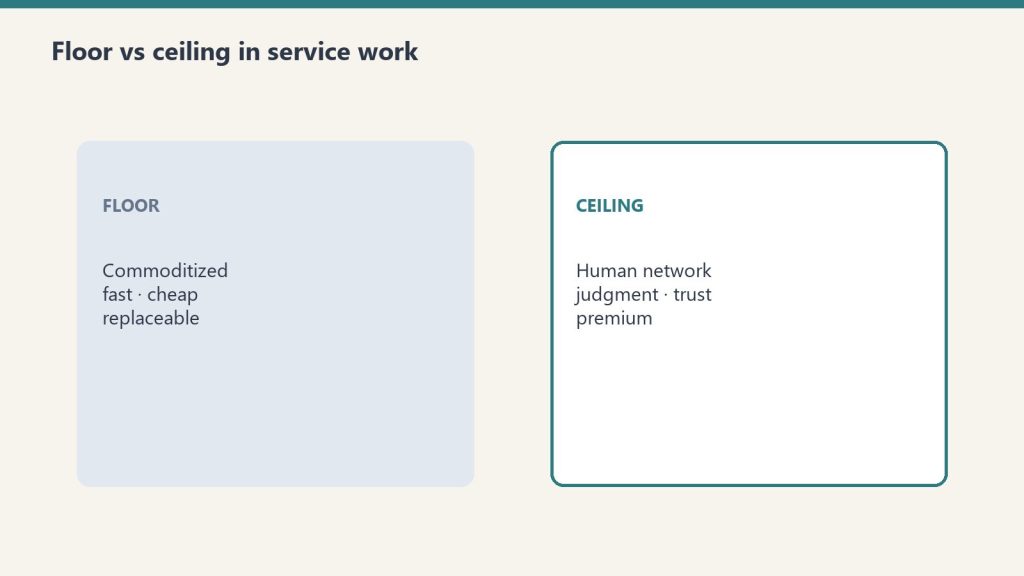
TurboTax and QuickBooks killed the transactional accountant. They did not kill the trusted advisor. The future of accounting is the multi-decade trusted relationship that integrates tax, strategy, financial planning, and business consulting for a specific client niche. The tax return is the artifact. The relationship is the product. This is the floor-and-ceiling pattern that defines the future of every service profession. Build the niche specialization. Build the retainer model. Build the cross-domain capabilities. Become the human advisor the platforms cannot be.
The robo-advisors did not kill the financial advisor. Vanguard, Betterment, Wealthfront, Schwab’s robo offering, and the dozen other algorithmic portfolio managers commoditized the procedural floor of investment management — asset allocation, rebalancing, tax-loss harvesting, basic portfolio construction. They made those services free or near-free for any consumer with a phone. They did not touch the ceiling of financial advisory, which is something completely different from portfolio management. The advisors who built that ceiling are thriving at levels they never reached when investment management was the product.
The robo-advisors collapsed the cost of portfolio construction and basic asset management to near zero. The math underneath modern portfolio theory was never proprietary. The work of allocating across index funds, rebalancing on a schedule, and harvesting tax losses is genuinely amenable to algorithmic delivery. Once the platforms reached scale, the floor pricing for these services dropped to a fraction of what traditional advisors charged.
The advisors whose entire value was investment management got compressed. The 1% AUM fee for portfolio management without anything else attached became increasingly hard to defend when the same service was available for 0.25% from a robo or close to free from a brokerage platform. The narrative was that the robo-advisors were going to eliminate the human advisor entirely.
They did not. The advisors whose value had always been more than investment management — the comprehensive planners, the trusted advisors, the financial life coordinators — got more valuable. The robo handled the floor. The ceiling — the integrated multi-decade planning that touches every part of a client’s financial life — became the entire offering. The advisors who built the ceiling business have larger practices, higher per-client revenue, and stronger career stability than the AUM-only advisors of the prior era ever had.
What the Ceiling Actually Is in Financial Advisory
The ceiling work in financial advisory is comprehensive life planning, and it is structurally different from investment management in ways that matter for the business model.
Investment management is about the portfolio. Comprehensive life planning is about the whole financial life. It includes investment management, but the investment management is one component of a much larger offering. The full scope of comprehensive planning includes retirement planning across multiple time horizons, tax strategy coordinated with the client’s accountant, estate planning coordinated with the client’s attorney, insurance review and coordination, education funding strategies, charitable giving structure, business succession planning if applicable, and behavioral coaching during market stress.
The advisor running a comprehensive practice is not picking stocks. They are integrating decisions across every financial domain in the client’s life over decades. They are the central coordination point for the client’s relationship with their accountant, their attorney, their insurance agent, their banker, their business advisors. They are the person the client calls when something significant changes — a death in the family, a business offer, a divorce, an inheritance, a major health event. They are not selling investment management. They are selling a multi-decade trusted relationship that organizes the client’s entire financial life.
This is the work that the robo-advisors cannot do, will not do for the foreseeable future, and structurally cannot replicate even when AI gets meaningfully more capable. The integration across domains, the trust built over years, the knowledge of the specific family’s specific situation — none of it lives in algorithms. It lives in the advisor.
The Behavioral Coaching Layer Is Where the Real Value Lives
One specific aspect of comprehensive planning deserves its own discussion because it is the part most often missed in conversations about advisor value. The behavioral coaching layer — the work the advisor does to keep clients from making catastrophic decisions during emotional moments — is, by most rigorous measures, the single highest-value contribution an advisor makes over the course of a client relationship.
When the market is down 40 percent and the client wants to sell everything and go to cash, the advisor’s voice is what prevents the decision that would destroy the client’s retirement. When the client inherits a significant sum and wants to put it all in their cousin’s startup, the advisor’s voice is what slows the decision down. When the client is going through a divorce and wants to make immediate financial changes that will be hard to reverse, the advisor’s voice is what keeps the financial impact of the divorce manageable.
None of this work is investment management. All of it is comprehensive advisory work. It cannot be done by an algorithm, because the algorithm does not have a relationship with the client and the client does not call the algorithm when they are emotionally distressed. The robo-advisors that have tried to add behavioral nudges to their interfaces have produced exactly nothing of value in this domain, because behavioral coaching is fundamentally about a human relationship that the client trusts under pressure.
The advisors who deliver real behavioral coaching are the advisors whose practices are the most resistant to robo-advisor compression. Their clients do not leave for lower fees, because the value they receive at the moments that matter is not visible in normal-market conditions and is irreplaceable when conditions are not normal.
How to Build the Comprehensive Practice
The advisors who have built genuine comprehensive practices follow a specific playbook.
Choose a specific client segment to serve deeply. Not “anyone with assets to invest.” A specific life-stage, profession, family structure, or business type that you can become the trusted advisor for. The narrowness is what allows the advisor to develop genuine expertise in the planning challenges of that segment and build the referral network that serves them.
Build the coordination network across domains. Your clients have accountants, attorneys, insurance agents, bankers. Your job is to coordinate with those professionals and serve as the central integrator of the client’s financial life. The coordination work is invisible to the client most of the time and is exactly what makes the comprehensive offering work.
Develop genuine planning depth in tax, estate, insurance, and business areas. You do not need to be the deepest expert in each of these. You need to be deep enough to recognize the issues, ask the right questions, and bring in the appropriate specialist when needed. The advisor who is purely an investment manager and refers everything else out is not running a comprehensive practice. The advisor who can credibly engage on tax strategy, estate structure, insurance adequacy, and business succession is.
Build the behavioral coaching practice deliberately. Document your communication protocols during market stress. Have a defined approach to client outreach during volatility. Be the calm voice the client expects to hear. The advisors who let clients drift away during difficult markets lose them. The advisors who proactively engage during volatility keep them for life.
Use AI and platform tools for the procedural floor. Portfolio management, performance reporting, routine compliance, basic financial planning calculations — automate or platform-mediate all of it. Spend the time saved on the relational and integrative work that defines the comprehensive practice.
Price for the relationship, not the assets. The AUM model that worked for the investment management era is becoming increasingly mismatched with the comprehensive planning offering. Flat-fee planning retainers, hourly advisory billing, or hybrid arrangements often better reflect the value delivered and align the economics with what the client is actually paying for.
Frequently Asked Questions
Will robo-advisors replace human financial advisors?
No. Robo-advisors have commoditized the procedural floor of investment management but cannot replicate the comprehensive life planning, multi-domain coordination, and behavioral coaching that defines the work of a true financial advisor. The advisors whose value was AUM-only have been compressed. The advisors who built comprehensive practices thrive.
What is comprehensive financial planning?
Comprehensive financial planning is the integration of investment management, retirement planning, tax strategy, estate planning, insurance coordination, education funding, charitable giving, business succession, and behavioral coaching into a single trusted relationship that organizes the client’s entire financial life over decades.
What does behavioral coaching mean in financial advisory?
Behavioral coaching is the work the advisor does to keep clients from making catastrophic decisions during emotional moments — selling at the market bottom, making rash decisions after an inheritance, restructuring finances impulsively during major life events. By most rigorous measures, it is the single highest-value contribution an advisor makes over the course of a client relationship.
How do financial advisors compete with platforms like Vanguard and Betterment?
Not on portfolio management fees. The platforms will always win on that. Advisors win by delivering integrated planning across multiple domains, behavioral coaching during volatility, and coordination with the client’s other professionals — all work the platforms structurally cannot do.
What kinds of clients want a comprehensive financial advisor?
Clients with complex financial lives — business owners, families with significant inheritances, high-income professionals coordinating multiple decisions, retirees managing multi-decade income strategies, families with multi-generational financial considerations. The pool is large and growing as algorithmic platforms commoditize the basic portfolio management layer.
How long does it take to build a comprehensive financial advisory practice?
Three to five years to establish strong domain depth and the cross-professional referral network, with significant compounding after the first market downturn when clients experience the behavioral coaching value and become the advisor’s most active referral sources.
The Bottom Line
The robo-advisors killed the AUM-only advisor. They did not kill the comprehensive planner. The future of financial advisory is the multi-decade trusted relationship that integrates every financial decision in a client’s life. The portfolio is the artifact. The relationship is the product. This is the floor-and-ceiling pattern that defines the future of every service profession. Build the comprehensive practice. Build the coordination network. Build the behavioral coaching capability. Become the human voice the client expects to hear during the worst market they will ever experience, and the robos will never reach you.
Lemonade did not kill the insurance agent. Neither did Geico’s app, the direct-write carriers, or the captive software that turns quoting into a fifteen-second mobile transaction. What those platforms killed was a specific kind of agent — the one whose value was the quote, the bind, and the renewal letter. The agents who matter in 2026 are not selling policies anymore. They are selling something the apps structurally cannot deliver: a claim-time concierge relationship that shows up when the customer’s house burns down at three in the morning.
Lemonade, Geico, Progressive’s mobile flow, the direct-write carriers, and the captive carrier software all commoditized the same set of procedural functions. Quoting became instant. Binding became automatic. Renewals became algorithmic. Policy documents became downloadable PDFs. Customer service for routine questions became chatbot-driven. The procedural floor of insurance — the work that used to fill an agent’s day — got absorbed into apps that consumers can run themselves.
The agents whose value was the quote and the bind got compressed. They could not compete with the apps on speed, price, or convenience for routine policies. The transactional model of insurance agency, where revenue depended on policy volume and standardized renewals, became progressively harder to defend. The narrative was that the apps were going to disintermediate the agent entirely.
They did not. They could not. The apps are excellent at quoting, binding, and routine service. They are catastrophically bad at the thing insurance is actually for, which is the moment something terrible happens to a customer and they need a human to handle it.
Why the Claim Is the Real Product
The claim is the real product — not the policy brochure.
Insurance, at its core, is a promise to show up when something goes wrong. The policy is a document. The claim is the moment of truth. The customer who never has a claim does not particularly care whether they bought from Lemonade or from a local agent — the difference is invisible to them. The customer who has a claim discovers, often painfully, what they actually bought.
The app-only carrier model is structurally limited in claim handling. The customer files the claim through the app. They get a chatbot for initial intake. They get an adjuster they have never spoken to. They get a process that is designed for efficiency, not advocacy. When the claim is straightforward — a fender bender, a minor theft — the app model handles it adequately. When the claim is complex, urgent, or contested — a total-loss fire, a complicated water loss, a liability dispute — the app model leaves the customer alone with a process that does not know them and is not optimized for their outcome.
This is exactly where the human agent becomes irreplaceable. The agent who has built a real practice picks up the phone when the customer calls. They know the adjuster. They know the restoration company that will actually be on site at three in the morning. They know the carrier’s claims escalation path. They advocate for the customer through the process. They are not a layer between the customer and the policy. They are a layer between the customer and the disaster.
This is the ceiling work in insurance. It is also the work that the apps structurally cannot replicate, because it requires human relationships, local knowledge, and judgment under pressure that no automated system delivers.
The Claim Concierge as the Insurance Agent’s Real Product
Claim concierge: guide the loss from first call to close.
The insurance agent who recognizes the ceiling opportunity stops selling policies and starts selling the claim-time concierge relationship. The policy is the legal artifact. The concierge is the actual offering. The customer is paying for the human who will show up when the loss happens.
What does the concierge actually include? Concretely, it includes things like this. The agent maintains direct relationships with named adjusters at every carrier they place business with — not just claim numbers, but actual people who answer when the agent calls. They maintain a curated referral list of restoration companies, public adjusters, contractors, and attorneys who deliver under pressure. They have a defined claim-time response protocol — within four hours of being notified, the agent has personally engaged with the customer, contacted the carrier, and triggered the right downstream resources. They do the documentation work that customers cannot do themselves under stress — the inventory, the contemporaneous notes, the carrier-facing reporting that determines claim outcomes.
The customer experiences this offering as someone showing up when their life falls apart. The agent who was nowhere visible during the policy years suddenly becomes the most important person in their life for ninety days. That is what insurance is supposed to be. The apps cannot deliver it. The agents who deliver it have a moat the apps cannot cross.
How to Build the Concierge Practice
Build the practice around jobs that actually get done.
The insurance agents who have built genuine concierge practices follow a specific playbook.
Pick a vertical or a community small enough to serve at the concierge level. High-net-worth personal lines. Specific commercial verticals. Local communities where the agent can be personally available. The narrowness is what makes the concierge offering sustainable. An agent trying to deliver concierge service to 8,000 policies cannot. An agent serving 400 carefully selected client relationships can.
Build named relationships at every carrier. The agent’s value at claim time depends on knowing actual humans at every carrier they place. This relationship-building is invisible work that happens during the policy years and pays off at claim time. The agents who skip this work cannot deliver the concierge offering when it matters.
Curate the downstream referral network. Restoration companies, public adjusters, attorneys, contractors. These referrals are the agent’s product at the moment of loss. Vet them. Update the list as performance changes. Refuse to refer providers who would damage the trust. The referral list is a curated asset.
Build the claim-time response protocol. Specific committed response times. Specific committed actions in the first 24, 72, and 168 hours after a major loss. Make this a documented promise to clients during the policy year. Deliver it when the loss happens. The agents who have a real protocol earn referrals at a rate that volume agents cannot match.
Use AI and platform tools for the procedural floor. Quoting, binding, renewals, routine service, document delivery — automate or platform-mediate all of it. Spend the time saved on the relationship work that defines the concierge practice.
Price for membership. The traditional insurance commission model is tied to policy volume. The concierge model often runs better on flat retainer fees, fee-for-service advisory billing, or a hybrid arrangement that recognizes the value of the relationship rather than the policy transaction.
Will Lemonade and app-only insurance carriers replace insurance agents?
No. The apps have commoditized the procedural floor of insurance — quoting, binding, routine service. They cannot replicate the claim-time concierge relationship where an agent advocates for the customer through a complex loss. The agents whose value was the quote have been compressed. The agents who built concierge practices thrive.
What is an insurance agent claim concierge?
It is the offering where the customer pays for the agent’s commitment to show up when a loss happens — to call the adjuster, coordinate the restoration company, advocate through the claim process, and handle the documentation that determines claim outcomes. The policy is the legal artifact. The concierge is the actual product.
How do insurance agents compete with direct-write carriers?
Not on price or convenience for routine policies. Agents win by delivering value the apps cannot deliver — the human concierge at claim time, the curated downstream referral network, the advocacy through complex losses. The agents who try to compete on quote speed lose. The agents who compete on claim-time value win.
What kinds of clients want an insurance agent versus an app?
High-net-worth clients with complex coverage needs. Commercial clients with significant exposures. Customers in vertical industries where claims are frequent and complicated. Customers who have had a bad claim experience in the past and value the human relationship. The pool of clients who want the concierge model is large and growing.
How long does it take to build a concierge insurance practice?
Two to three years to establish strong carrier relationships and a curated referral network, with significant compounding after the first major loss the agent handles for a client. Clients who experience the concierge service during a claim become the agent’s most active referral sources.
The Bottom Line
The insurance apps killed the transactional agent. They did not kill the concierge agent. The future of insurance brokerage is the human who shows up at claim time — who knows the adjuster, knows the restoration company, knows the carrier’s escalation path, and advocates for the customer through the worst day of their year. The policy is not the product. The concierge is the product. This is the floor-and-ceiling pattern that defines the future of every service profession. Build the claim-time concierge offering. Build the carrier relationships. Build the referral network. Become the human the apps cannot be.
Zillow did not kill the real estate agent. It killed the kind of real estate agent whose entire value was the gatekept information that Zillow made free. The realtors who built genuine community networks — who became the central connectors of their towns and neighborhoods — are thriving in 2026 at levels they never reached in the pre-platform era. Buyers and sellers are not paying them for listings anymore. They are paying for membership in a human network that the platform cannot replicate.
Zillow, Redfin, Realtor.com, and the broader real estate platform stack commoditized the procedural floor of the industry. Listing search, basic property data, comparable sales, neighborhood statistics, market trends, mortgage estimators, agent reviews — all of it became free to any buyer with a phone. The information that realtors used to gatekeep and charge commissions to access became table stakes.
The agents whose business model depended on controlling the information got squeezed hard. The transactional agent who showed buyers houses and pulled comps and not much else lost the structural advantage that made them necessary. Some left the industry. Some clung to the old model and watched their incomes decline. The narrative in the early platform era was that this was the death of the profession.
It was not. It was the death of a specific kind of agent. The agents whose work had always been more than transactional — the community connectors, the neighborhood specialists, the trusted referral hubs — got more valuable. Their floor work became cheap, which freed up their time. Their ceiling work — the human network, the curation, the trust — became the entire offering. The economic outcomes diverged sharply. The floor agents compressed. The ceiling agents thrived.
The Realtor as Community Network Operator
The realtor as community network operator.
The realtor who has built the ceiling business does not think of themselves as a house seller. They think of themselves as the central connector of a specific community. The transaction is the entry point into membership. The membership is the actual offering. The buyer is not paying a commission for the house. They are paying for ongoing access to everything the realtor knows, knows about, and is connected to.
What does the membership actually include? Concretely, it includes things like this. The new buyer gets the realtor’s contractor list — the roofer who will not gouge them in three years, the electrician who actually shows up, the painter who is honest about timelines. They get the introductions to neighbors who matter — the block captain who can warn them about the upcoming HOA fight, the family with kids the same age as theirs, the retired contractor down the street who is happy to weigh in on the deck project. They get the local intelligence — which school administrator actually returns calls, which pediatrician is taking new patients, which mortgage broker will close on time when the appraisal is tight. They get invited into the realtor’s ecosystem — the holiday party, the summer cookout, the monthly newsletter, the private group chat. They become part of a community whose center of gravity is the realtor.
The buyer would pay for any one of those things individually if they could find them. They get all of them because they bought a house from the right agent. The commission, in this framing, is not too high. It is significantly underpriced for the value being delivered, because most of the value is delivered after the transaction closes and continues for years.
How to Build the Network Deliberately
How to build the network deliberately.
The realtors who have built genuine community networks did not do it by accident, and most of them did not do it through volume marketing. The playbook is more specific.
Pick a community small enough to genuinely serve. Not a metro area. Not a county. A specific neighborhood, town, or community of interest. The realtors who win at the ceiling level are deep, not wide. They know everyone in their specific community. They are the first call when anyone has a real estate question, but they are also the first call when someone needs a contractor recommendation, a school question answered, or a referral to a tax advisor. The narrowness is what makes the network usable.
Map the providers in that community that you would stake your reputation on. Contractors, mortgage brokers, attorneys, insurance agents, financial advisors, pediatricians, school administrators, local employers. The realtor’s job is to know these people personally, vouch for the ones who deserve it, refuse to refer the ones who do not. The referral network is the product. Curate it like a product.
Become the first call for the community’s information needs. Run the newsletter that actually has useful local intelligence. Host the events where the community connects. Be the person who knows what is happening before it is in the news. The realtor who is the information hub for their specific community has built a moat that no platform can cross.
Treat every client as a member, not a transaction. After the closing, the relationship begins. Stay in regular contact. Ask how the renovations are going. Connect them to the local restaurant when their out-of-town family visits. Introduce them to the neighbor who works in their industry. The post-transaction relationship is what generates the referrals that build the next generation of clients.
Use AI and platform tools for the procedural floor. Let the platform do the listings, the comps, the market analysis, the scheduling, the document handling. Stop competing with Zillow on speed or data accuracy. They will always win on the floor. Reinvest the time you save into the relational work that builds the network.
What This Looks Like Economically
The realtor running the community network model typically has a smaller client roster than the transactional agent and generates significantly more revenue per client over a multi-year horizon. The commissions on individual transactions may not be different on a per-deal basis, but the lifetime value of a client in the network model is dramatically higher because clients refer their friends, family, and colleagues into the same network repeatedly over years.
The retention dynamics are also stronger. The transactional client comes back to the agent only when they need another house. The network client stays in the agent’s orbit continuously and brings every real estate question, every referral opportunity, and every introduction. The lifetime value math favors the network model significantly, even though the marketing-funnel math looks worse on the surface.
The career stability also diverges. The transactional agent is exposed to market downturns, platform algorithm changes, and commission pressure. The network agent’s business depends on the strength of their community relationships, which compounds over time and resists short-term market conditions. The network agent who has been in their community for fifteen years has a business that is genuinely durable.
Will Zillow eventually replace real estate agents?
No. Zillow has commoditized the procedural floor of real estate but cannot replicate the community network, neighborhood expertise, and trusted referral relationships that good agents build. The transactional agents who depended on information gatekeeping have been compressed. The community network agents thrive.
How does a realtor build a community network business?
Pick a specific narrow community to serve. Map the providers in that community you would stake your reputation on. Become the information hub for the community. Treat every client as an ongoing member rather than a transaction. Use platform tools for the procedural floor and reinvest the time in relational work.
What is a real estate community network membership?
It is the offering where a buyer who purchases a home from the agent gains ongoing access to the agent’s curated network — contractors, attorneys, neighbors, employers, local intelligence — for years after the closing. The commission pays for membership in a human network, not just the transaction.
Should new real estate agents try to compete with Zillow?
No, not on the floor. The platforms will always win on listings, search, and data. New agents should pick a specific community, build relationships in it deliberately, and become the local connector. The ceiling is open to anyone willing to do the relational work.
How long does it take to build a community network real estate business?
Typically two to three years to establish strong network density in a specific community, and the business compounds significantly after year five as referrals from earlier clients drive new business. The agents who started this work five years ago are dominant in their communities now.
The Bottom Line
Zillow did not kill realtors. It killed the realtors whose entire value was the information Zillow made free. The realtors who built community networks — who became the central connectors of their specific towns and neighborhoods — are in the strongest position the profession has seen in decades. The transaction is no longer the product. The membership in the network is the product. The commission pays for the entry into something larger. This is the floor-and-ceiling pattern that plays out across every service profession. Build the network. Build the membership. Become the French press in your community, and the Nespresso platforms will never reach you.
Most people own a Nespresso machine. It is fast. It is consistent. It is convenient. It produces a perfectly fine cup of coffee with zero effort, every time, exactly the way the manufacturer designed. And yet, in kitchens across the country, there is also a French press sitting on the counter. The Nespresso gets used on weekday mornings when the only thing that matters is getting to work on time. The French press gets used on Sunday morning, when the person making the coffee actually wants the experience of making it, smelling it, waiting for it, sharing it.
The Nespresso did not kill the French press. The Nespresso raised the floor of coffee — anyone in any kitchen can now produce a decent cup without skill or time. The French press did not become obsolete. It became the thing you choose when you want more than convenience. When you want texture. When you want ritual. When you want the human thing the machine cannot give you.
This is the structural pattern that nobody is naming clearly enough about what software has done to service professions, and what AI is now accelerating. Software raised the floor of every service industry it touched. It did not touch the ceiling. Zillow did not kill realtors. TurboTax did not kill accountants. Robo-advisors did not kill financial advisors. LegalZoom did not kill lawyers. The platforms made the procedural floor of those services cheap and accessible. The ceiling — the human work, the trust, the network, the curation, the membership into something larger than a transaction — became the only thing left worth paying for. And the practitioners who figured this out are thriving while everyone else complains about the platforms.
The Pattern Is Older Than AI
The temptation in 2026 is to frame everything happening to service professions as an AI story. That framing is too small. The pattern of software raising the floor and forcing the ceiling to evolve has been playing out for at least twenty-five years, and AI is just the latest and fastest example of it. The story matters because the responses that worked for prior waves of disruption are exactly the responses that work for the AI wave too.
Look at what actually happened in each industry.
Zillow and the major real estate platforms made listings, comps, and basic property data free and accessible to anyone with a phone. The procedural work that real estate agents used to gatekeep — finding houses, pulling comps, scheduling viewings — became commoditized. The reaction in the industry was loud and panicked. Realtors were going to be replaced. The platforms were going to disintermediate the agents. The commission model was going to collapse.
None of that happened. What happened instead was that the realtors whose entire value was the gatekept information got squeezed out, and the realtors who had built genuine community relationships, neighborhood expertise, and trusted networks became more valuable than ever. The platforms raised the floor. The ceiling — knowing the neighborhood, knowing the schools, knowing which contractor to call, knowing which neighbors will be at the block party, knowing the mortgage broker who actually closes on time — became the entire offering. The best realtors in any town are not selling houses. They are selling membership in a community network that you happen to enter by buying a house from them.
TurboTax did something similar to the tax profession. Simple returns became free. The procedural floor of preparing a standard W-2 return collapsed in value. The reaction was the same panic. Accountants were going to be replaced. The CPA license was going to lose meaning. None of that happened either. What happened was that the accountants whose business was simple returns got compressed, and the accountants who built actual advisory relationships, tax strategy expertise, business consulting integration, and ongoing trusted-advisor positions became more valuable than ever. The platform raised the floor. The ceiling became advisory, relational, strategic. The CPA who is your trusted advisor for the next thirty years of your financial life is not selling tax returns. They are selling a membership in their judgment.
The robo-advisors did the same thing to financial advisory. Vanguard, Betterment, Wealthfront, and the platform offerings from the major brokerages made basic portfolio construction, rebalancing, and tax-loss harvesting free or near-free. The reaction was identical. Financial advisors were going to be replaced by algorithms. The 1% fee was going to die. None of that happened. The advisors whose entire value was basic portfolio construction got compressed. The advisors who built genuine financial planning relationships, comprehensive life integration, estate and tax coordination, behavioral coaching during market stress, and trusted multi-generational relationships became more valuable than ever. The robo raised the floor. The ceiling — comprehensive judgment about a specific family’s specific situation, integrated across decades — became the entire offering.
LegalZoom did it to legal services. Incorporation, simple wills, trademark filings, basic contracts — all commoditized. The lawyers who depended on those transactions for income compressed. The lawyers who built strategic advisory relationships with businesses, complex estate planning relationships with families, and judgment-heavy practice areas thrived. The platform raised the floor. The ceiling became the trusted advisor relationship that no platform can replicate.
The pattern is the same in every case. The platform commoditizes the procedural floor. The panic predicts the death of the profession. The death does not happen. The practitioners who were already on the floor compress. The practitioners who climb to the ceiling — relationships, networks, judgment, curation, trust, community — thrive at a level they never reached before. The industry survives, often more profitably than before, but the shape of the work and the identity of the practitioners shift dramatically.
What the Ceiling Actually Is
People pay more for the ceiling than they ever paid for the floor.
The word “ceiling” can sound abstract. Let us make it concrete. The ceiling of any service profession, in the era of commoditized procedural floor work, is the human network the practitioner builds around the work. The practitioner is not selling the transaction. They are selling membership into something larger.
The realtor who has built a real community network is not selling a house. They are selling a relationship with someone who knows the town. When you buy a house from them, you are getting introduced to the local contractor who will not gouge you on the roof you need replaced in three years. You are getting an invitation to the neighborhood holiday party where you will meet the parents your kids will grow up with. You are getting a referral to the mortgage broker who will close on time even when the appraisal comes in low. You are getting the name of the senior partner at the law firm who handles the messy probate work nobody else wants. You are getting the introduction to the local employer who is hiring exactly the kind of role your spouse needs. You are getting access to a network that took the realtor twenty years to build, and you are paying a commission to enter it.
The accountant who has built a real advisory practice is not selling a tax return. They are selling a thirty-year relationship with someone who knows your financial life, your business, your family, your risks, and your goals. When you have a question about whether to take the offer your business just received, the accountant is the first call. When your parent dies and the estate is complicated, the accountant is the first call. When your kid wants to start a business, the accountant is the first call. The annual tax return is the artifact of the relationship, not the product.
The financial advisor who has built a real planning practice is not selling investment management. They are selling a multi-decade trusted relationship that integrates every financial decision in your life. When the market is down 40 percent and you want to panic-sell, the advisor is the voice that keeps you from doing the wrong thing. When your aging parents need long-term care and the family does not know how to pay for it, the advisor is the person who has thought about that scenario for years and has the network of attorneys and care coordinators to handle it.
The insurance agent who has built a real practice is not selling a policy. They are selling someone who shows up when the house burns down, who knows the adjuster personally, who pushes the claim through when the carrier is dragging its feet, who connects you to the restoration company that will actually be there at three in the morning. The policy is the contract. The relationship is the product.
The pattern is consistent. The ceiling is the network. The ceiling is the trust. The ceiling is the membership. The platform sells the transaction. The practitioner sells membership into a human network that the platform structurally cannot replicate, because the platform is a transaction engine and the network is a lifetime accumulation of relationships, reputation, and judgment.
Why People Will Pay More for the Ceiling Than They Ever Paid for the Floor
The financial economics of the ceiling shift in service professions are widely misunderstood. The default assumption is that when the floor gets commoditized, total industry revenue declines because the average transaction price falls. This is partly true and obscures the more important truth.
The transactions that used to be the entire industry move to the platforms. The customers who only ever wanted the floor service — the cheap tax return, the basic listing search, the simple incorporation — leave the human practitioners and go to the platforms. That is a real loss of volume at the bottom.
But the customers who want the ceiling service — and there are far more of them than the platforms or the industry consultants assume — start paying more, not less, for the human practitioner. They are no longer paying for a tax return. They are paying for a thirty-year advisor. The annual fee for the ceiling relationship is significantly higher than the fee for the floor transaction ever was. The customer perceives the value as much higher, because they are getting something they cannot get anywhere else.
The practitioners who climb to the ceiling end up with smaller client rosters but higher revenue per client and dramatically higher career stability. They are no longer competing with the platforms. They are operating in a category the platforms do not enter. They are also operating in a category that has high client retention, strong referral dynamics, and pricing power that floor practitioners never had.
This is why the realtors who have built genuine community networks routinely outearn the realtors who depend on Zillow leads. It is why the accountants who run advisory practices outearn the ones who run tax-prep mills. It is why the financial advisors with comprehensive planning practices outearn the ones running portfolio management businesses. The economics of the ceiling are better than the economics of the floor ever were, but only for the practitioners who actually build something the platforms cannot replicate.
The Nespresso Effect in Daily Life
Now consider what is happening at the consumer level, beyond just service professions. People are increasingly surrounded by convenient, AI-augmented, software-mediated experiences. Nespresso machines. DoorDash deliveries. Streaming algorithms. Dating apps. Robo-advisors. The platforms have made convenience the default in almost every domain of life.
And yet — across exactly this same period — the cultural pull toward the human and analog version is intensifying, not weakening. Sourdough bread baking became a mass phenomenon. Vinyl records outsell CDs again. Independent bookstores are growing. Farmers markets are mobbed on Saturday mornings. The local coffee shop with the slow pour-over has a line out the door. Concert ticket prices are climbing because people will pay anything to be in a room with other humans experiencing something live. Small-batch everything — beer, whiskey, chocolate, soap — commands premium prices that the mass-produced version cannot touch.
The Nespresso machine is great. People also genuinely want the French press, and the cafe, and the conversation. The convenience layer is necessary infrastructure. The human layer is what people actually crave, especially as the convenience layer expands. The more the platforms commoditize the procedural baseline of everything, the more people search for the human version of whatever it is they used to get from a person.
For service professions, this is the cultural tailwind nobody is naming. The clients who want a thirty-year advisor relationship are not declining in numbers. They are increasing, because everything else in their lives is becoming algorithmically mediated and the desire for one or two genuinely human relationships is rising in response. The realtor who is also the trusted community connector is in more demand, not less. The accountant who knows your family is more valuable, not less. The insurance agent who shows up at midnight is the one people refer to their entire network.
The platforms are creating the demand for the human ceiling at the same time they commoditize the floor. The Nespresso era is the French press era. They coexist. People want both, for different purposes, and they pay differently for each.
What This Means for AI Specifically
What this means for AI — it raises the floor; humans still own the ceiling.
Set aside the multi-decade history of software commoditization for a moment, and look just at AI. The same pattern is now playing out across the service professions that have not yet been hit by their dedicated platform.
AI is the next layer of floor-raising for every service profession. Document drafting, research, basic analysis, routine communication, scheduling, follow-up — AI is absorbing all of it across every field simultaneously. The lawyers, accountants, advisors, agents, and consultants who built their practices on producing those outputs are facing the same compression that Zillow created for realtors and TurboTax created for accountants.
The response is the same. Climb to the ceiling. Use AI to handle the procedural floor of your work. Spend the time you save building the network, the relationships, the trust, the membership offering that no AI can replicate. The practitioners who do this in the next twenty-four months will own their niches for the next twenty years. The ones who keep doing floor work and competing with AI on speed and price will be commoditized, exactly the way the floor realtors and tax-prep mills were commoditized by their respective platforms.
The pattern that already played out across real estate, tax, financial advisory, and legal is now playing out across every remaining service profession simultaneously. AI is the cross-industry platform. The response that worked in the prior waves works in this one too.
How to Build the Ceiling Offering in Any Service Profession
The practical move for any service professional who recognizes this pattern is the same regardless of industry. Build the network. Build the relationships. Build the membership. Make the transaction the artifact of a much larger human offering.
Identify the specific community you serve. Not a target market in the abstract. A specific community of people who share a context — geographic, professional, lifestyle, life stage — that you can become the central connector of. The realtors who win build community networks around specific neighborhoods. The accountants who win build advisory networks around specific business owner segments. The financial advisors who win build planning networks around specific life-stage cohorts. The narrower and more specific, the more powerful the network becomes, because the practitioner can know everyone in it personally.
Become the connector. The practitioner’s job is to connect the people in their network to each other and to the resources they need. The realtor introduces the new buyer to the contractor, the mortgage broker, the school principal, the neighborhood association. The accountant introduces the business owner to the attorney, the banker, the consultant, the bookkeeper. The financial advisor introduces the family to the estate attorney, the elder care coordinator, the insurance specialist. The connecting is the value. The transaction is just the entry point.
Curate ruthlessly. The network is only as valuable as the trust the practitioner has built into it. Connect people to providers you genuinely trust. Refuse to connect them to providers who would damage the trust. Treat your referral list as a curated product, because that is what it is. The practitioners who refer indiscriminately destroy the trust that gives the network its value.
Use AI for the floor work, religiously. Automate the documents, the routine communication, the scheduling, the basic research. Free up the hours that used to go to procedural work. Reinvest those hours in the relationships that build the network. The judgment and the trust are the only defensible assets left. Build them.
Price for membership, not transactions. The pricing model that fits the ceiling offering is closer to a retainer, an annual relationship fee, or a long-term advisory engagement than a per-transaction commission. Some industries cannot fully escape transactional pricing structures, but every service profession has room to shift the revenue model toward something that reflects the actual value being delivered, which is the ongoing membership rather than the one-time service.
The Specific Industries This Applies To Right Now
Service professions this applies to right now — including restoration trades.
This pattern is in active play across multiple service professions right now. For each, the platform that raised the floor and the human ceiling that practitioners can build to.
Legal services. LegalZoom, Rocket Lawyer raised the floor on standard incorporations, wills, and contracts. The ceiling is the trusted attorney relationship — strategic counsel on the difficult cases, the messy estates, the complex business transactions, the litigation that requires judgment beyond any document automation.
Primary care medicine. Telehealth apps, One Medical, Forward, retail clinic chains raised the floor on routine episodic care. The ceiling is the continuous trusted physician relationship — knowing the patient over decades, integrating mental health and physical health, navigating complex family medical dynamics, advocating through the specialist system.
Mortgage brokerage. Rocket Mortgage, Better.com raised the floor on standard refinances and conforming purchases. The ceiling is the broker who handles the complex situations the platforms cannot — self-employed buyers, jumbo loans, unusual property types, time-pressured closings where human judgment and lender relationships matter.
Travel agency. Expedia, Booking, Kayak raised the floor on standard bookings. The ceiling is the travel curator who knows you, builds bespoke trips, has lifelong relationships with operators in destination markets, and shows up when the trip falls apart. Most consumer travel went to the platforms. The high end of travel curation is doing better than ever.
Photography. Smartphones and AI image tools raised the floor on standard photos. The ceiling is the photographer with vision, relationships with specific subjects, presence in moments that matter, and the kind of curated visual storytelling that no automated tool produces.
The pattern repeats across virtually every service profession that depends on a mix of procedural and relational work. The procedural part goes to the platform or the AI. The relational part becomes the entire offering. The practitioners who build the relational offering deliberately and durably end up in a better economic position than they ever held in the era before commoditization.
Frequently Asked Questions
Why did Zillow not kill real estate agents?
Zillow commoditized the procedural floor of real estate — listings, comps, scheduling — but did not touch the ceiling, which is the community network, the neighborhood expertise, and the trusted referral relationships that good agents build over years. The agents whose entire value was the gatekept information got squeezed out. The agents who built genuine community networks thrived because Zillow could not replicate their human ceiling.
What is the floor and ceiling framework for service professions?
Every service profession has a floor of procedural, transactional, documentable work that platforms and AI are commoditizing, and a ceiling of relational, judgment-based, network-driven work that platforms structurally cannot replicate. The practitioners who survive commoditization deliberately shift their time, energy, and offerings toward the ceiling and let the platforms have the floor.
What does it mean to sell membership instead of transactions?
Selling membership means structuring the offering so that the client is not paying for a single service event but for ongoing access to the practitioner’s network, judgment, and curation. The realtor who introduces the new buyer to contractors, neighbors, mortgage brokers, and employers is selling membership in a community network, not a house transaction. The same pattern applies across every service profession.
Will AI replace lawyers, accountants, financial advisors, and other professionals?
No. AI will replace the procedural floor of those professions — document drafting, basic analysis, routine research, standard preparation — but cannot replace the trusted-advisor relationship, the judgment on complex situations, and the network that defines the senior practitioners in those fields. The pattern is identical to what software platforms have done to these industries over the prior twenty-five years.
What is the Nespresso vs French press metaphor for service work?
The Nespresso represents the convenient, automated, platform-delivered version of any service — fast, consistent, low-effort, low-price. The French press represents the human, slower, ritual-driven, higher-touch version. Both coexist. The Nespresso did not kill the French press. The platforms did not kill the human service practitioner. The practitioner who deliberately becomes the French press — the human ritual nobody can get from the platform — captures the part of demand that the platforms cannot serve.
How does a service professional start building the ceiling offering?
Identify a specific community to serve. Become the connector of that community. Curate referrals ruthlessly. Use AI for floor work. Price for ongoing relationship rather than one-time transaction. The transition usually takes two to three years to fully build, but practitioners who start now will own their niches for the next twenty years while floor-focused competitors get progressively commoditized.
The Bottom Line
Software raised the floor of every service profession it touched. Zillow, TurboTax, the robo-advisors, LegalZoom — each one commoditized the procedural baseline of an industry and triggered panic about the death of the profession. None of those deaths happened. The professions evolved. The practitioners who depended entirely on procedural work compressed. The practitioners who built networks, relationships, trust, and curation became more valuable than ever. The floor went to the platform. The ceiling became the entire game.
AI is the next platform layer, hitting every service profession simultaneously. The response that worked in real estate, tax, financial advisory, and legal works for the AI wave too. Climb to the ceiling. Build the network. Sell membership instead of transactions. Become the human ritual that no machine can replicate — the French press in the era of Nespresso.
People will always want both. The convenience layer is necessary infrastructure. The human layer is what they actually crave, particularly as the convenience layer expands. The service professionals who deliberately build the human ceiling in the next two to three years will dominate their niches for the next twenty. The ones who try to compete with the platforms on speed and price will be commoditized along with the platforms themselves. The choice is being made right now in every service profession. Make it deliberately.
The Tacit Knowledge Cluster — Further Reading
This piece is part of a larger body of writing on what the AI shift and the broader software-platform shift actually mean for service professions and the workers in them. The full cluster: