Tag: Restoration Content

  • Restoration Accounts Receivable: Fix Your Cash Cycle

    Restoration Accounts Receivable: Fix Your Cash Cycle

    Direct answer: A restoration company’s profit and loss statement and its bank account tell two different stories, and the gap between them is the AR cycle. Industry data references show construction-sector DSO averaging around 83 days — the highest of any major industry — and restoration claim cycles stretching well beyond 60-90 days are common. The well-run shop measures days sales outstanding by carrier, by service line, and by job size, builds working capital reserves sized to the actual aging profile rather than the optimistic version, and runs documentation discipline that removes the most common reasons adjusters delay payment. Compressing days-to-cash from 90+ down to a defensible 45-60 is worth more to most restoration companies than a 5-point margin improvement, because it directly funds growth without external capital.

    The single most common silent killer of growing restoration companies is not bad work, bad marketing, or bad people. It is the gap between when the cash goes out and when the cash comes in. A restoration company growing at 30 percent per year is, by definition, funding 30 percent more labor, more equipment, more materials, and more subcontractor invoices than the previous year — out of working capital that has not yet been replenished by the carrier checks for last quarter’s work. The math compounds. Every additional dollar of revenue requires roughly the same proportional dollar of working capital. A growth rate that exceeds the working-capital cycle eventually exhausts the bank account, even while the P&L looks healthy and the owner cannot understand why payroll is suddenly hard to make.

    The first move toward fixing this is recognizing that the AR cycle is not a back-office annoyance. It is the central operational metric of the restoration business model. Operators who understand and manage it correctly run growing companies without external capital. Operators who do not understand it either grow slower than their market opportunity allows or take on debt they do not need to take on. The well-run shop treats AR cycle as a strategic discipline.

    This article is the first cluster piece in the finance and operations stack and is the one most operators should attack first. The rest of the cluster builds on the assumption that the AR cycle is under control. Without it, the other improvements in service mix, equipment economics, crew structure, and KPI hygiene cannot compound.

    What the Xactimate-to-cash cycle actually looks like
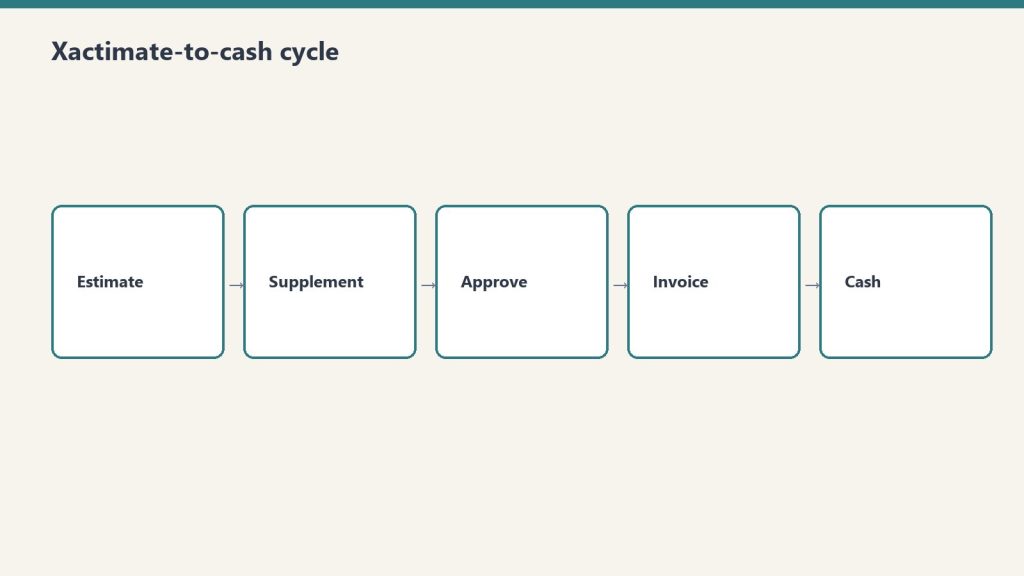
    Five-step flow from estimate to supplement, approve, invoice, cash
    What the Xactimate-to-cash cycle actually looks like.

    The Xactimate-to-cash cycle has more steps than most operators map out. Each step is a place where days accumulate. The full sequence on a typical commercial or residential insurance claim:

    Loss event and dispatch. Day zero. Restoration company arrives, performs emergency mitigation, begins documentation.

    Mitigation completion. Days three to seven on a typical water loss. Drying complete, dry standards verified, mitigation invoice ready to assemble.

    Mitigation invoice submission. Days seven to fourteen. Restoration company assembles the mitigation invoice — Xactimate estimate, photos, moisture logs, daily reports, work authorization, certificate of completion — and submits to the adjuster.

    Adjuster review and approval. Days fourteen to thirty-five. Adjuster reviews the submission, may request additional documentation, may negotiate scope or pricing, eventually approves the invoice in whole or in part. Independent industry references from restoration billing services note that documentation gaps are the most common reason adjusters extend this window — missing photos, incomplete moisture logs, inconsistent line items, or scope items that cannot be supported by the documentation.

    Carrier payment processing. Days thirty-five to sixty. Carrier processes the approved invoice and issues payment. For claims involving a mortgaged residential property, the check is typically made out jointly to the policyholder and the contractor, which means the homeowner has to endorse and forward, and lender involvement is required for claims above a threshold (commonly $10,000-$15,000) where mortgage companies release funds in stages.

    Reconstruction or repair phase. Begins after mitigation phase. The reconstruction scope is developed, approved, and executed. The cycle for reconstruction billing repeats — invoice assembly, adjuster review, carrier processing — but on a longer cycle because reconstruction work itself takes longer.

    Final invoice and closing. Days ninety to one-hundred-eighty for a fully reconstructed loss. Final scope reconciliation, depreciation holdback recovery on RCV claims, retainage release if applicable.

    The aggregated cycle on a typical mid-size residential or commercial loss runs sixty to one-hundred-twenty days from loss to full payment. On larger commercial losses with multiple phases, scope disputes, or coverage issues, it stretches to one-hundred-eighty days or more. On problematic claims with denied items, public adjuster involvement, or litigation, it can stretch into multi-year territory.

    For working-capital math, the simple version is that every dollar of revenue requires roughly the proportional dollars of cash held in AR for the average cycle length. A shop with $10 million in annual revenue and a 90-day cash cycle is carrying roughly $2.5 million in average AR — and that AR is funding the labor, equipment, materials, and subcontractor cost the shop is incurring on the next set of jobs. Compress the cycle to 60 days and the shop’s working-capital requirement drops to roughly $1.65 million, freeing $850,000 in cash for growth, debt reduction, equipment investment, or distribution. Compress further to 45 days and the freed cash hits $1.25 million. These are real, recoverable numbers, and they show up in the bank account, not just on the spreadsheet.

    Why DSO is the wrong single metric and the right multi-metric

    Most restoration companies that measure AR at all measure a single overall DSO number, calculated as accounts receivable divided by total revenue, multiplied by the number of days in the period. This is the standard cross-industry calculation and it produces a useful directional read — but on its own it is not actionable, because the underlying AR is not homogenous. The well-run shop measures DSO three ways simultaneously.

    DSO by carrier. The DSO with State Farm is different from the DSO with USAA, which is different from the DSO with Allstate, which is different from the DSO with the local independent commercial carriers. Some carriers pay reliably in 30-45 days; some stretch to 60-90; some stretch beyond 90 routinely. The shop that knows its DSO by carrier can make rational decisions — which programs to lean into, which to pull back from, which to limit exposure on. The shop that knows only its blended DSO is making aggregate decisions on heterogeneous data.

    DSO by service line. Mitigation invoices typically pay faster than reconstruction invoices because they are smaller, simpler, and structured to industry-standard mitigation Xactimate line items. Reconstruction invoices pay slower because they involve more scope negotiation and more adjuster review. Specialty work — documents, electronics, art, medical — pays in patterns that depend on the carrier’s familiarity with the specialty pricing and on whether the specialist bills direct or through the prime restoration company. A shop that knows DSO by service line can spot whether the cycle problem lives in mitigation, reconstruction, or specialty.

    DSO by job size. Small jobs (under a few thousand dollars) often pay quickly because adjusters approve them with minimal review. Mid-size jobs ($10,000-$50,000) often hit the worst of both worlds — large enough to require full documentation review, small enough to lack the executive attention that moves large losses through the system. Large jobs (over $100,000) often have dedicated adjuster attention, large-loss specialists involved, and faster decision-making once scope is settled, although the cycle from loss to first payment can still be long. A shop that knows DSO by job size can identify the band where the cycle is most painful and target documentation and follow-up effort there.

    The combined picture — DSO by carrier, by service line, by job size — is what produces actionable management information. Most restoration companies do not produce this view because their accounting systems are not configured to slice AR this way and their internal reporting effort has been on top-line metrics. Configuring the accounting system to support this slicing is a one-time investment that pays back almost immediately.

    What is causing the long cycle, and which causes are operator-controllable
    Six cards covering job margin, cycle time, AR days, utilization, CAC, close rate
    Operator-controllable causes of a long cycle.

    The long restoration cycle has multiple causes, and the operator’s intervention point is different for each.

    Documentation gaps. Operator-controllable, high impact. Industry references from restoration billing services consistently identify documentation as the single largest cause of payment delays. An invoice missing photos, moisture logs, daily reports, signed work authorizations, or scope justification gives the adjuster a defensible reason to delay payment with a request for more information. Each round trip costs five to fourteen days. A shop that submits complete, clean, defensible documentation on the first submission collects faster than a shop that submits incomplete documentation and chases revisions.

    Xactimate scope quality. Operator-controllable, high impact. An Xactimate estimate that uses incorrect line items, that prices outside the standard price list without justification, or that includes scope items not supported by the documentation will be reduced or returned. Real Xactimate proficiency — Level 1 certification at minimum, Level 2 ideal, in-house or contracted — pays for itself on the first half-dozen invoices. Operators who use Xactimate as a glorified word processor without understanding the underlying line-item logic submit estimates that produce avoidable disputes.

    Carrier program structure. Partially operator-controllable. Different carrier preferred-vendor programs have different documentation requirements, different review cycles, and different payment-processing timelines. Some require submission through specific portals (Verisk’s claims platforms, Symbility, carrier-specific systems) that produce faster cycles than email-based submission. Some require pre-approval at scope thresholds. The operator’s intervention point is to learn the program’s specifications cold and submit to specification, and to selectively de-prioritize programs whose cycle structure does not work for the shop’s working-capital tolerance.

    Mortgage company involvement. Limited operator-controllability. On residential losses where the property is mortgaged, the lender’s check-handling protocol adds a cycle layer the contractor cannot eliminate. The intervention is to communicate the lender process to the homeowner early, provide the documentation the lender will require (final invoices, work completion certificates, lien waivers) ahead of need, and follow up actively rather than passively waiting.

    Public adjuster involvement. Mixed operator-controllability. When a PA is on the file, scope is scrutinized harder and disputes take longer. The contractor’s intervention is to maintain documentation discipline strict enough to survive PA scrutiny, communicate professionally with the PA on scope questions, and avoid behaviors that escalate the file unnecessarily.

    Coverage disputes. Limited operator-controllability. When the carrier disputes coverage on items the contractor has performed, the cycle stretches indefinitely. The intervention is upfront — confirming coverage on questionable items before performing the work, getting written authorization on scope expansions, and avoiding work the policy clearly does not cover.

    Litigation. Not operator-controllable except by avoidance. Once a claim is in litigation, the cycle is governed by the legal process rather than the claims process. The contractor’s defense is to not get into litigation in the first place, which means honest scope, complete documentation, professional communication, and a willingness to walk away from disputes that are not worth litigating.

    The pattern in this list: the highest-impact causes are operator-controllable. Documentation discipline and Xactimate scope quality are the two largest levers, and they are entirely within the shop’s control. Operators who blame the long cycle on the carriers without first auditing their own documentation and Xactimate practice are diagnosing the wrong problem.

    The operational moves that compress the cycle
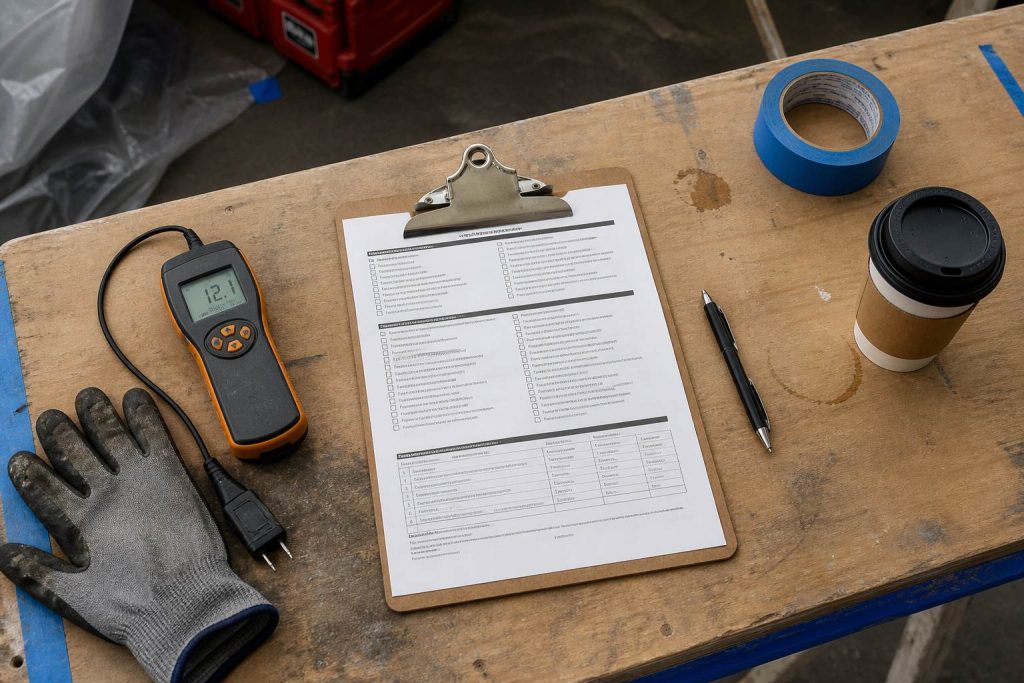
    Restoration SOP clipboard with checklist, moisture meter, and gloves on a jobsite table
    Operational moves that compress the AR cycle.

    The well-run shop runs a specific set of operational practices that compress the AR cycle. These are not novel and they are not glamorous. They are the practices that produce the difference between a 90-day cycle and a 45-60 day cycle.

    Document at the job level, in real time. Not at invoice time. Photos taken on day one, moisture logs updated daily, daily reports completed by the lead tech before leaving site, scope-of-loss documented progressively as the work develops. Documentation assembled at invoice time is documentation that has gaps. Documentation assembled in real time is documentation that is complete on day seven when the mitigation invoice is ready to go out.

    Use a documentation platform. Several industry-standard platforms — including CompanyCam for photos, MICA and ENCIRCLE for full documentation packages, and proprietary platforms from larger carriers’ preferred-vendor programs — automate documentation capture. Operators using these platforms submit cleaner invoices and submit them faster than operators relying on phone photos and paper logs.

    Build the Xactimate estimate as the work progresses, not after. The mitigation Xactimate estimate should be largely written by the time the drying is finished. The reconstruction Xactimate estimate should be developed during the mitigation phase, not after the customer authorizes the rebuild. Operators who treat Xactimate as a billing-time activity add days to the cycle that the operators who treat it as a project-execution activity do not.

    Submit the invoice on a schedule. The shop’s standard should be invoice within seven days of mitigation completion, with no exceptions for shop-side delays. Customers and adjusters pay invoices that arrive promptly faster than they pay invoices that arrive late, partly because the file is fresh and partly because prompt invoicing signals professional operations.

    Follow up on a schedule. Adjuster contact at day fourteen post-submission if not approved, day twenty-one with escalation request, day thirty with escalation to the carrier’s claims service line. Adjusters have hundreds of files. The files that get attention are the ones the contractor stays present on. The files that drift are the ones where the contractor submits and waits silently.

    Reconcile cash to invoices weekly, not monthly. The accounting team should know which invoices are open, by carrier and by adjuster, every week. Stale aging that is not reviewed is aging that gets older. Weekly review with explicit follow-up assignments produces faster collections than monthly review.

    Use a billing service when in-house capacity does not exist. Restoration-industry-specific billing services — companies like Restoration Insurance Billing, Blackwater Billing Services, NetClaimsNow, and others — exist specifically to handle Xactimate invoice assembly, submission, and follow-up. For shops that do not have in-house Xactimate competence or in-house collections discipline, outsourcing this function to a specialist often produces a faster cycle than handling it in-house at the shop’s current capability level. The fee is paid out of the cash-cycle compression.

    Working capital strategy

    Compressing the AR cycle reduces but does not eliminate working capital intensity. Even at a defensible 45-60 day cycle, a growing restoration company carries substantial cash in receivables. The well-run shop has a deliberate working capital strategy that funds this intensity without surprises.

    Cash reserve sized to the actual aging profile. A shop with a 60-day cycle should carry cash reserves sufficient to operate for at least 60 days at current burn rate, plus a buffer for delayed collections on specific files. Many operators size reserves to 30 days of operating cost, which is too thin for restoration’s cycle. Sizing reserves to 75-90 days of operating cost, with a clear policy on when reserves can be drawn down for growth investment versus when they must be held, gives the shop room to absorb a slow collection month without payroll stress.

    Line of credit as a flex tool, not a permanent funding source. Most growing restoration shops should have a working-capital line of credit with a commercial bank, sized to cover one to two months of operating cost. The line is a tool for absorbing month-to-month variation in collections, not a tool for funding ongoing operations. Shops that operate continuously on the line of credit are shops with a structural cash problem they have papered over with debt.

    Customer financing as a deliberate tool. On residential reconstruction work where insurance does not cover the full scope, customer financing can be offered through restoration-industry-specific finance partners or general home-improvement finance platforms. This converts a payment-cycle question into a marketing question and shifts the cycle off the shop’s balance sheet.

    Avoid AOB-driven cash flow models. Some restoration companies build their cash flow on aggressive use of assignments of benefits, where the carrier pays the contractor directly. AOBs solve the homeowner-endorsement step but do not address the underlying claim cycle, and several states have passed AOB reform that complicates or restricts the practice. Building working capital strategy around AOBs is fragile both legally and operationally.

    Factoring as last resort, not first option. Specialty receivables-factoring firms exist that will advance against restoration AR, but the cost is meaningful (often 2-4 percent per month effective rate) and using factoring routinely indicates that the underlying cycle problem has not been fixed. Use factoring only as a bridge while implementing the operational improvements that compress the cycle, not as a permanent solution.

    What the AR cycle reveals about the rest of the business

    The AR cycle is a diagnostic tool as much as it is an operational metric. Specific patterns in the AR aging report point to specific underlying issues elsewhere in the operation.

    Long cycle on a specific carrier. The carrier’s program structure may not fit the shop’s working-capital tolerance, or the shop’s documentation may not fit the carrier’s submission requirements. Either way, this is a focused intervention point.

    Long cycle on a specific service line. The Xactimate competence in that service line may be weaker, or the documentation discipline may be looser. Investigate the lead tech and project manager on that service line and compare practice to the better-performing service lines.

    Long cycle on a specific job size. Process gaps in the size band — possibly insufficient project-management attention on mid-size jobs or insufficient documentation rigor on small jobs that get treated casually. Address process at the size band rather than the job level.

    Long cycle on jobs led by a specific project manager. The PM’s documentation, communication, or follow-up practice may be substandard. Coachable, often quickly.

    Spike in cycle in a specific month. Look for upstream issues — was a billing person out, did a software change disrupt invoice generation, did a regulatory change affect a common scope item, did a carrier change its program. The cycle is the downstream symptom of upstream operations.

    The shop that uses AR aging as a diagnostic produces continuous improvement. The shop that uses AR aging only as a financial-statement input misses most of the management information the metric carries.

    How this article fits the cluster

    The AR cycle is the foundation. The next article in the cluster — gross margin by service line — depends on the AR cycle being defensible, because service-line economics that look good on margin but fail on cash conversion are not actually good economics. The articles that follow on equipment economics, crew structure, KPI dashboards, and the rest all assume the operator has working capital under control. An operator who works through the rest of the cluster without first fixing the AR cycle is building on sand.

    If you take only one operational improvement from this entire cluster, take this one. The investment is modest — documentation discipline, Xactimate competence, scheduled follow-up, weekly cash review. The return is direct, measurable, and recurring. Compressing days-to-cash from 90 to 60 frees roughly two months of revenue in working capital. For a $5 million shop, that is roughly $830,000 in cash. For a $20 million shop, it is roughly $3.3 million. Those are not theoretical numbers. They are sitting in your AR right now.

    Related on Tygart Media: gross margin mix · cash flow & profit · operations & finance.

    Frequently asked questions

    What is a realistic DSO target for a restoration company? For mitigation-heavy work with disciplined operations, 45-60 days is achievable. For mixed mitigation and reconstruction work, 60-75 days is realistic. For reconstruction-heavy work, 75-90 days is realistic. Operators running 90+ days have specific operational issues that should be diagnosable from the by-carrier, by-service-line, by-job-size view. Targeting under 30 days is unrealistic in this industry; targeting under 45 is achievable on the mitigation side but not the reconstruction side.

    Should I use a restoration-specific billing service or build in-house? Depends on shop size and current capability. Shops under $3 million with no in-house Xactimate-certified estimator typically benefit from a billing service — the cost is roughly offset by the cycle compression. Shops over $5 million should generally have in-house capability because the service fees become a real expense at scale and because in-house ownership of the cycle produces better discipline. Shops in between can go either way; the deciding factor is whether in-house capacity is genuinely competent or whether it is the owner-operator’s spouse doing it on weekends.

    How do I get my AR aging by carrier, service line, and job size if my accounting system doesn’t slice it that way? This is a one-time configuration project. Most accounting systems used by restoration companies (QuickBooks Online, QuickBooks Enterprise, Sage Intacct, NetSuite, restoration-specific platforms like Albi, KnowHow, and others) support custom fields or class tracking that can produce this slicing. The configuration takes a few days of accountant time and pays back permanently. If your current system genuinely cannot support this, the system is the bottleneck.

    What about retainage on commercial work? Commercial reconstruction often involves retainage (commonly 5-10 percent held until project completion) which extends the cycle on the retained portion well beyond the standard cycle. Build retainage into the AR aging view as a separate category so the operating cycle on the non-retained portion is visible cleanly. Retainage release is its own follow-up activity that should be treated as a managed process, not as something that happens automatically.

    What if a specific carrier program is producing a long cycle but represents a meaningful portion of revenue? This is a strategic decision, not just an operational one. The cycle math is real — if a carrier program produces revenue at acceptable margin but stretches AR by an extra 30 days, that’s a working-capital cost that the program revenue should justify. Quantify the cost (roughly the additional AR carried at the cost of capital), compare to the program’s contribution to gross profit, and decide whether the program is net positive on cash-adjusted economics. Many operators discover that programs they thought were valuable are actually drag once the cycle cost is accounted for.

    How do I handle homeowners who do not endorse the joint check from the mortgage company? This is a customer-service issue layered on a cash-cycle issue. Communicate the joint-check process to the homeowner before the loss is even mitigated, get them comfortable with the workflow, and follow up actively when the check is issued. Most customers cooperate; the few who do not usually have a deeper issue (dispute over scope, dispute over quality, financial distress) that needs to be addressed directly. Avoid letting these accounts age silently.

    Is a line of credit absolutely necessary, or can a shop run without one? Smaller shops under $1-2 million can sometimes run without one if reserves are healthy and growth is moderate. Shops over $3 million typically benefit from having one even if it sits unused most months — the optionality is worth the modest commitment fee. The decision is risk tolerance: a line of credit is insurance against a slow collection month, and like all insurance, it is most valuable when not needed.

    How do I know if my Xactimate practice is the bottleneck? Pull your most recent ten mitigation invoices and ten reconstruction invoices. For each, document the date submitted, the date approved, and any back-and-forth requests from the adjuster. If more than 30 percent of submissions trigger requests for revisions, your Xactimate practice has gaps. The specific gaps will be visible in the revision requests — line items used incorrectly, pricing outside standard with insufficient justification, scope items unsupported by documentation. Address those gaps directly, and the cycle compresses.

    Can compressing the AR cycle actually replace the need for outside capital on a growing shop? For most shops in the $1-30 million range, yes. The math works because each dollar of cycle compression frees a proportional dollar of working capital, and that capital recurs every cycle. Compressing cycle from 90 to 60 days on a $10 million shop frees roughly $830,000 in cash; on a $20 million shop, roughly $1.7 million. Those numbers fund meaningful growth without any external capital. Operators with cleaner AR cycles typically do not borrow for working capital because they do not need to.

    What is the single most important practice I can install this week? Daily documentation by the lead tech on every job, completed before the tech leaves site. Photos of pre-mitigation and post-mitigation conditions, moisture readings logged with timestamps, daily report covering work performed and conditions encountered, signed work authorization on file from day one. This single practice will compress your invoice submission time and reduce documentation-driven adjuster delays by more than any other change. Everything else in this article matters; this is where to start.
  • Restoration Company Operations: Finance & Scaling Guide

    Restoration Company Operations: Finance & Scaling Guide

    Direct answer: A restoration company is not just a service company. It is a working-capital-intensive, claims-cycle-dependent, equipment-rich, labor-leveraged business where gross margin varies from 70 percent on water mitigation to 10 percent on reconstruction, where net margin compresses as revenue grows, and where the gap between the average operator and the well-run operator is several multiples of profitability. The discipline that separates the two is not heroic effort; it is financial and operational rigor applied consistently to a small set of decisions about service mix, AR cycle, equipment leverage, crew structure, KPI hygiene, carrier-program exposure, multi-location structure, and exit posture. This pillar introduces those eight decisions and frames the cluster that explores each one in depth.

    The restoration industry sits in a strange place. Industry analysts cite a market range from $7.1 billion to $80 billion in U.S. revenue, depending on how the boundary is drawn — water mitigation only, all property restoration, all property and remediation including mold and biohazard, or the full disaster-recovery economy including reconstruction and contents. The Restoration Industry Association and Restoration & Remediation Magazine have referenced the wider range publicly, and the consensus growth rate sits at 4-6 percent CAGR. Within that aggregate market, the operator-level reality is that the industry is fragmented — thousands of independent shops in the $1M to $30M range, several hundred regional operators in the $30M to $200M range, and a small set of national consolidators with revenue over $200M. The fragmentation is the opportunity. It is also the trap.

    The opportunity is that no national brand has captured commodity property restoration the way ServiceMaster did in dry cleaning or Home Depot did in retail. Independent operators with discipline can build $5M to $50M businesses with strong margins and durable client relationships. The trap is that fragmentation lets bad businesses survive longer than they should. A restoration company can run for a decade with sloppy AR, undisciplined service mix, and informal operations and still pay the owner well in good years — until a CAT-event swing, a carrier-program change, or a key-employee departure exposes the underlying weakness and the business loses years of compounding to the cleanup. The well-run shop avoids this not by being smarter on the day of the event but by having installed financial and operational discipline before the event ever arrived.

    This article is the pillar for the cluster that follows. The cluster covers eight specific decisions where finance and operations rigor moves the needle the most: AR aging and the Xactimate-to-cash cycle, gross margin by service line, equipment economics, crew structure and labor cost, KPI dashboards, preferred-vendor program economics, multi-location growth, and M&A and exit dynamics. This pillar walks through each at altitude so an owner-operator can see how they connect before deciding which to attack first.

    The unit economics that actually drive a restoration company

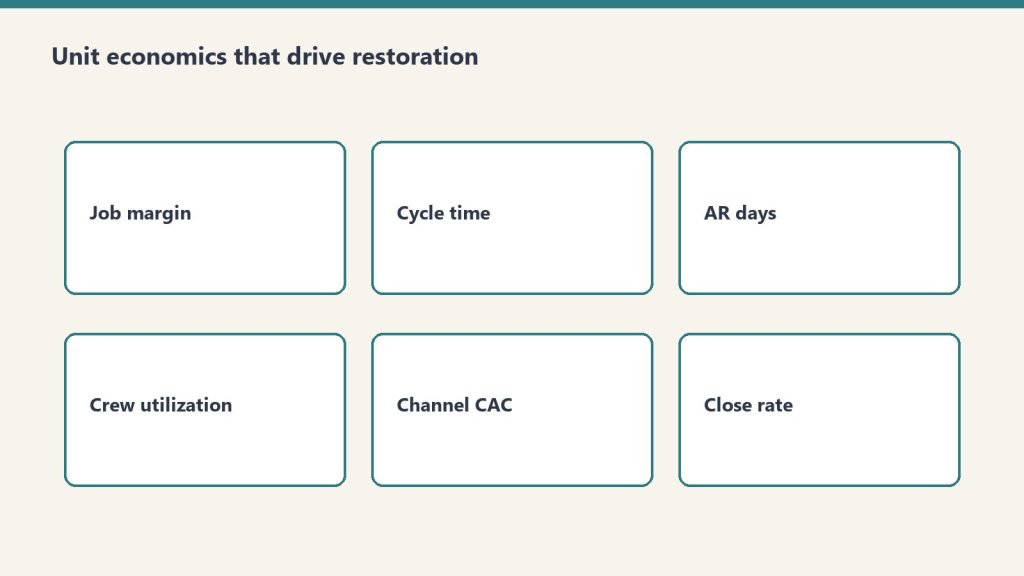
    Six cards covering job margin, cycle time, AR days, utilization, CAC, close rate
    Unit economics that actually drive a restoration company.

    The restoration industry’s unit economics are unusual in three specific ways that operators frequently miss until they are scaling and the math stops working.

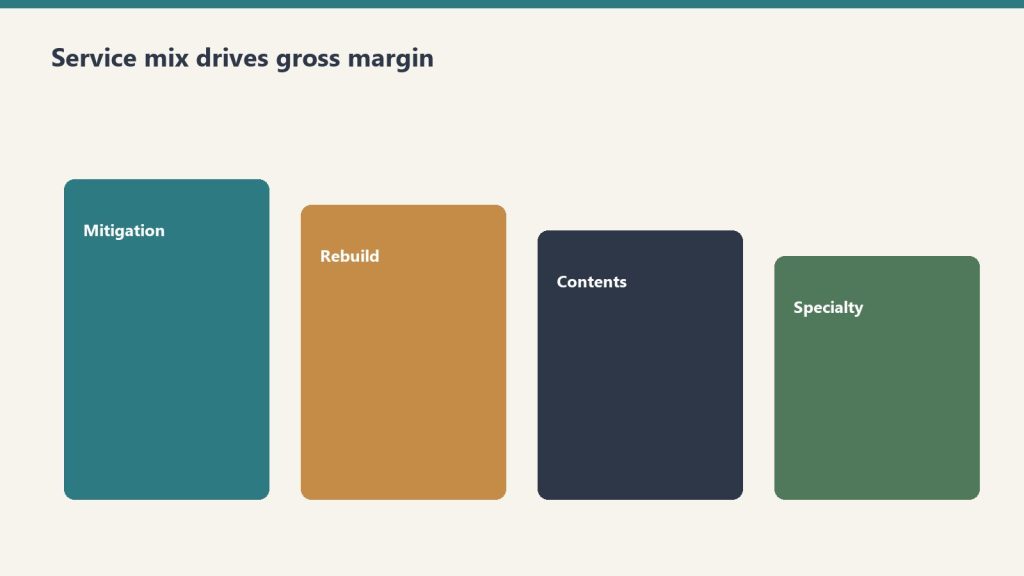
    Service-line gross margin is wildly different by line. Water mitigation typically runs 70-80 percent gross margin because equipment does most of the work — air movers and dehumidifiers run on 24-hour cycles with limited human labor — and the Xactimate price list rewards this with strong unit pricing. Mold remediation runs 40-50 percent gross margin because the labor content is heavier and the protective and disposal cost is real. Fire damage restoration runs 25-30 percent gross margin because the work is labor-intensive, slow, and contents-heavy. Reconstruction runs around 10 percent gross margin because it is a construction business with construction margins layered on top of the restoration relationship.

    That spread — 70 percent on the front of the loss to 10 percent on the back — means that two restoration companies with the same revenue can have radically different profitability depending on the mix. A $5 million shop with 60 percent water and mold and 40 percent reconstruction makes meaningfully more money than a $5 million shop with 30 percent water and mold and 70 percent reconstruction, even if both are running competent operations. Mix is the single most important financial decision an operator makes, and it is rarely an explicit decision — it tends to drift based on what comes through the door. Treating mix as a deliberate strategic choice is the first move a finance-aware operator makes.

    Net margin compresses as revenue grows. Independent industry references — including operator surveys cited by Restoration & Remediation Magazine and analysis from restoration-industry CFO advisors like Kiwi Cashflow — show that smaller restoration shops under $1M revenue can sustain gross margins near 70 percent, while shops over $50M typically run net margins in the 6 percent range and shops in the $30-50M band typically run net margins around 15 percent. The shape of the curve is consistent across multiple sources: the smaller the shop, the higher the gross margin and the more variable the net margin; the larger the shop, the more compressed the gross margin and the more stable but lower the net margin.

    Why? Three structural reasons. First, smaller shops do less reconstruction proportionally — they pass it off — which keeps gross margin high. Second, smaller shops carry less overhead because the owner is doing the management work; larger shops require professional management layers that show up in SG&A. Third, larger shops carry more carrier-program exposure, which compresses pricing through preferred-vendor program rate negotiation. The implication for an operator is that the path to higher absolute dollars is real but does not produce proportional margin gains, and the operator who thinks scale will solve a margin problem is usually wrong.

    Working capital intensity is brutal. Restoration is a cash-out, cash-in-much-later business. The work is performed in days or weeks; the cash is collected in months. The operator advances labor cost, equipment depreciation, materials, and subcontractor payments out of pocket and waits for the carrier to settle the claim. AR aging in the 60-120 day range is normal in commercial work and not unusual in residential work either. A shop growing 30 percent year over year is funding that growth with working capital — and a shop that grows faster than its working capital cycle can support runs out of cash even while showing strong P&L performance. This is the most common silent killer of growing restoration companies, and it is the subject of the first article in the cluster that follows.

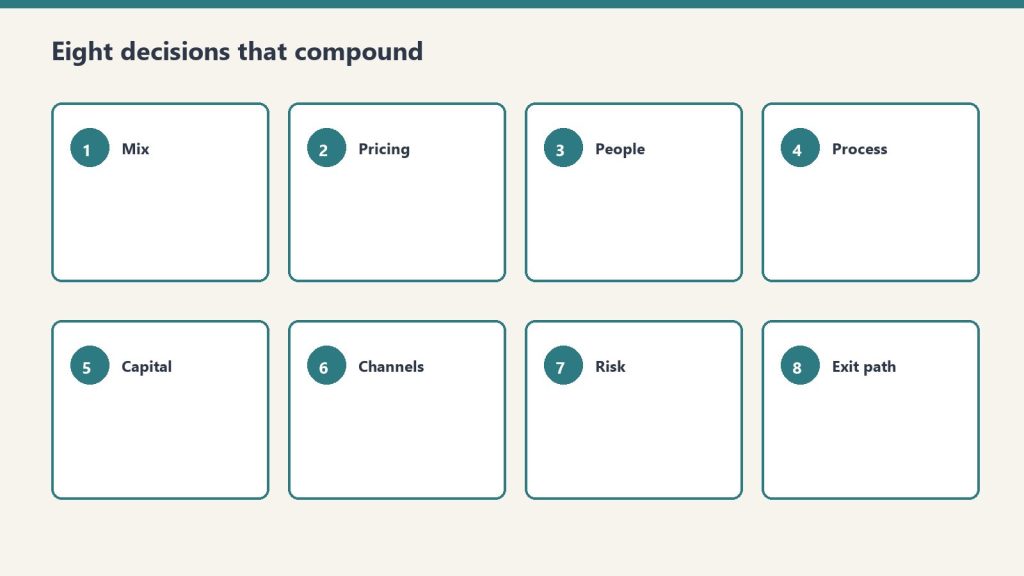
    The eight decisions that separate compounders from plateaued operators

    Eight decision cards from mix and pricing through exit path
    Eight decisions that separate compounders from plateaued operators.

    The cluster that follows takes each of these decisions in depth. Here is the at-altitude framing of each so the operator can see the system before drilling into the parts.

    AR aging and the Xactimate-to-cash cycle. The well-run shop measures Days Sales Outstanding by carrier, by service line, and by job size. It identifies the carrier programs whose AR cycle is acceptable and the ones that are not. It chooses to take or decline work based on cash-cycle math, not just margin math. It builds a working-capital reserve sized to the actual AR aging profile rather than the optimistic version. It treats AR as a strategic asset rather than a back-office annoyance.

    Gross margin by service line. The well-run shop knows its gross margin to within a few points on each service line and uses that knowledge to manage mix deliberately. It chooses which service lines to lead with, which to accept opportunistically, and which to refuse — and it makes those choices based on the gross margin profile and the overhead-absorption requirements of each line, not on which work happens to come through the phone today.

    Equipment economics. The well-run shop runs an equipment economic model that distinguishes between owning, leasing, and renting. It tracks equipment utilization, depreciation, and reinvestment cadence. It avoids both under-investment (forcing crews to wait for equipment that should already be on hand) and over-investment (carrying equipment that sits idle and burns capital). It treats the equipment fleet as a financial asset whose ROI is measurable rather than as a vague necessary cost.

    Crew structure and labor cost. The well-run shop has a deliberate org structure that includes lead-tech tracks, supervisor tracks, and project-management tracks with explicit progression criteria, compensation bands, and productivity targets. It measures revenue per technician hour by service line. It manages labor as the largest controllable cost and treats hiring, training, and retention as strategic activities rather than reactive ones.

    KPI dashboards. The well-run shop runs on a dashboard that includes job-level revenue, gross margin, AR aging, equipment utilization, labor productivity, customer acquisition cost by source, retention by source, and the small set of operational metrics that drive financial outcomes. The dashboard is simple, current, and reviewed weekly. It is the difference between an operator who is reacting to last quarter’s numbers and an operator who is steering against this week’s.

    Preferred-vendor program economics. The well-run shop knows the true economics of each carrier preferred-vendor program — the rate concessions, the volume commitments, the documentation overhead, the AR cycle, and the program’s strategic risk. It distinguishes programs that produce profitable revenue from programs that produce activity at margin levels that do not justify the operational overhead. It uses preferred-vendor work as one channel among several rather than as the foundation of the business, because the operator who is dependent on a single carrier’s program is one underwriting decision away from a revenue cliff.

    Multi-location growth. The well-run shop knows that the second location is structurally different from the first, the fifth is structurally different from the second, and the model that worked at $5 million breaks at $15 million and again at $50 million. It scales deliberately by building management depth ahead of revenue growth, by standardizing operations and financial reporting before geographic expansion, and by recognizing that multi-location restoration is a different business — a portfolio of operating businesses rather than a single business with multiple offices.

    M&A and the consolidator landscape. The well-run shop understands the consolidator landscape — the strategic acquirers including BluSky (Partners Group and Kohlberg), ATI Restoration (TSG Consumer Partners), BMS CAT (AEA Investors), BELFOR, First Onsite, ServiceMaster Restore, Paul Davis, PuroClean, DKI, and the broader set of more than fifty private-equity platforms that have entered restoration since 2018 — and the deal mechanics that drive valuations. It positions early so that when an exit makes sense, the company is sellable at a premium. Or it positions to acquire small competitors itself. Or it makes the deliberate choice to remain independent, with a clear understanding of what that choice means for the owner’s long-term wealth.

    These eight decisions are not equally important to every operator at every stage. An operator at $2 million revenue should focus on AR cycle, service mix, and labor cost — KPI dashboards and M&A are premature. An operator at $30 million revenue should focus on multi-location structure, preferred-vendor program economics, and exit positioning — basic AR discipline should already be in place. The cluster takes each decision in turn and explains the moves that matter most at each stage.

    What this pillar is not

    This pillar is not a financial-modeling primer. There are good resources for that — restoration-industry CFOs like Kiwi Cashflow publish accessible content for operators, and broader trade publications like Restoration & Remediation Magazine and Cleanfax run regular benchmarking surveys. The cluster references these where useful and does not duplicate them.

    This pillar is not a substitute for working with a CPA who understands the restoration industry. The tax structure of a restoration company — the choice of S-corp vs. C-corp, the equipment depreciation strategy, the inventory accounting for materials, the treatment of subcontractor versus W-2 labor — is jurisdiction-specific and operator-specific. An operator running a finance and operations discipline without a real CPA relationship is missing the most important piece of the system. Find one early.

    This pillar is not financial advice for any individual company. The numbers cited in the cluster are industry references, not specific recommendations. Every operator’s economics differ based on geography, mix, scale, carrier exposure, and dozens of other variables. Use the cluster as a framework to think with, not as a template to copy from.

    How to read the cluster

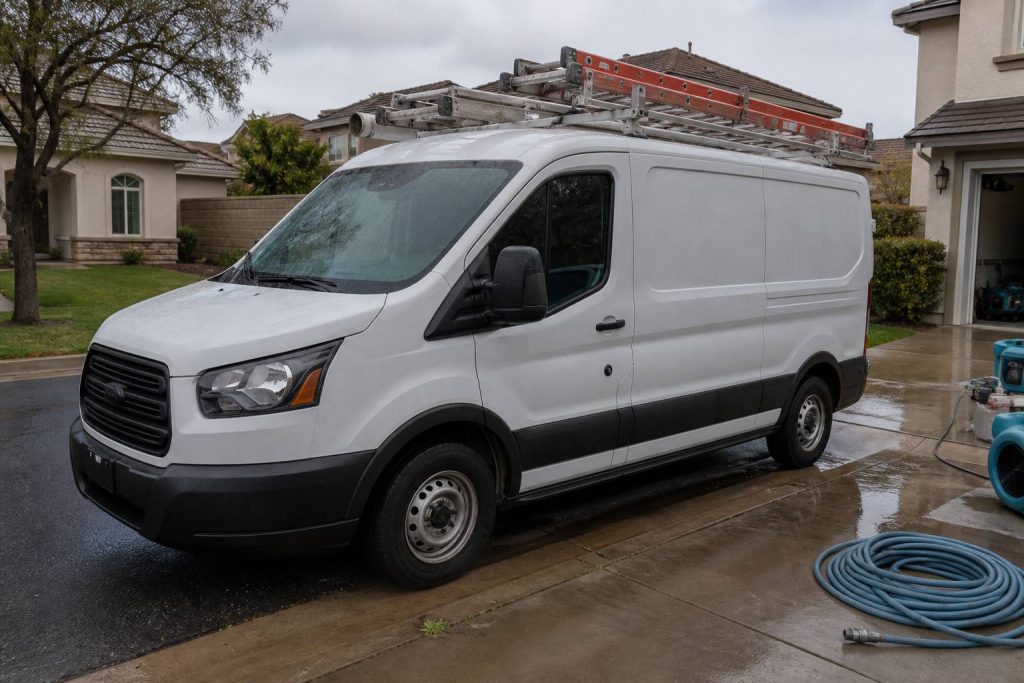
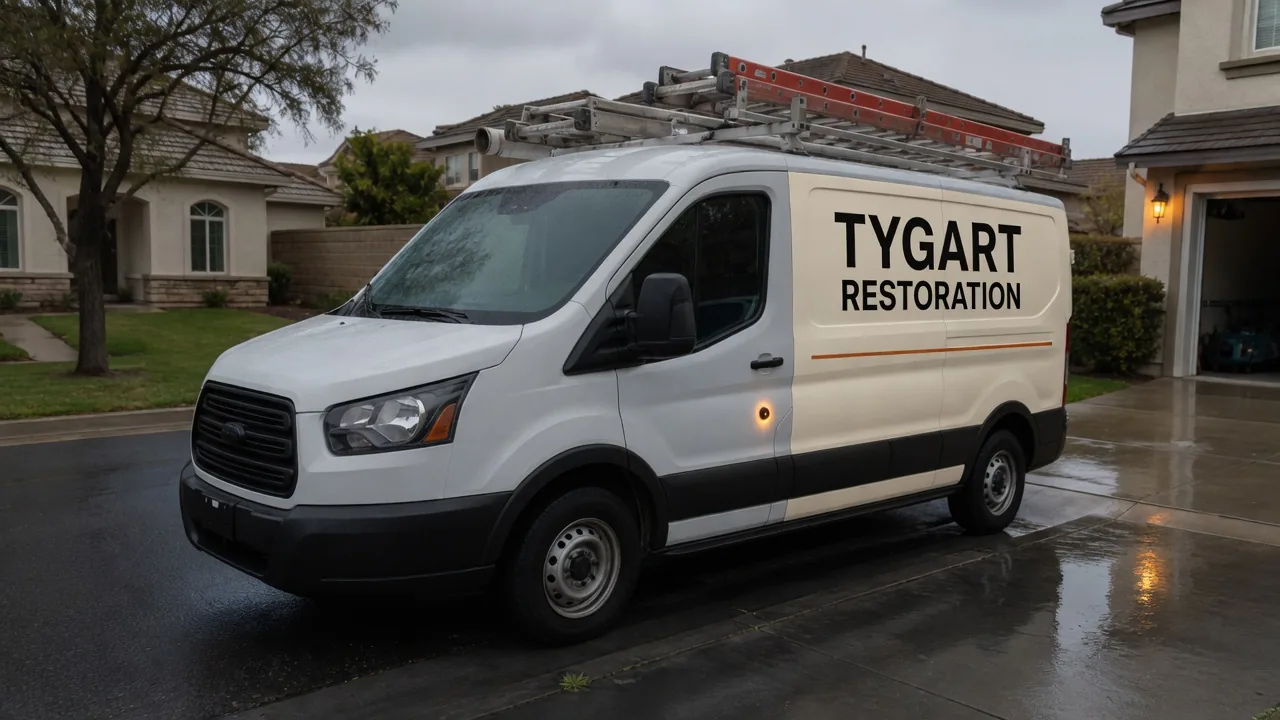
    White restoration work van with ladder rack parked at a suburban jobsite curb
    Read the cluster with the van in mind — field reality first.

    The cluster of eight articles that follows can be read in sequence — and there is some logic to reading it that way, since AR cycle and service-line economics are the foundation that the later articles build on. But it can also be read selectively. An operator who already has clean AR discipline can skip article one. An operator at $3 million revenue can skip the multi-location and M&A articles for now. An operator who is exit-curious can skip directly to the M&A piece and work backwards from there.

    The articles share a structural pattern. Each opens with the operator-level question the article answers. Each names the specific moves the well-run shop makes on the question. Each acknowledges where the answer is genuinely operator-specific and where the answer is industry-generalizable. Each ends with what to read next inside this cluster and what to read elsewhere on Tygart Media.

    The cluster is meant to function as the operator’s reference library on the financial and operational side of running a restoration company — the way the Marketing Stack cluster functions as the reference library on the demand side, and the way the Specialty Restoration cluster functions as the reference library on commercial wedge strategy. Together those three clusters cover the major operating axes of the restoration business: how you get work, how you do high-margin commercial work, and how you run the company you have built.

    Where the consolidator industry is going

    A note on the broader industry context that frames the entire cluster, and especially the M&A article at the end. The restoration industry is in the middle of a consolidation cycle. As referenced by Cleanfax in operator coverage, approximately three brands operate above the $2 billion revenue threshold today, and industry leaders predict that by 2030 the count of $2 billion-plus brands will roughly double. Private equity has been active in the space for several years; industry M&A coverage from sources like The Deal Sheet and Hyde Park Capital identifies more than fifty PE platforms acquiring restoration operators since 2018, with deals at platform-level transacting in the 4x-7x EBITDA range and smaller-company deals transacting in the 3-4x range. The strategic acquirers — BluSky, ATI, BELFOR, BMS CAT, First Onsite, ServiceMaster Restore, Paul Davis, PuroClean, DKI — are buyers across multiple deal sizes. Carrier preferred-vendor programs reward national footprints, which structurally favors the consolidators. Insurance program economics increasingly require the documentation, technology, and reporting capabilities that smaller shops struggle to maintain.

    For owner-operators, this trajectory matters in two ways. First, it raises the value of independent shops that have built defensible operations — clean financial reporting, defensible service-mix discipline, durable customer relationships that are not dependent on a single carrier program, professional management depth — because these are the targets the consolidators want to buy. Second, it raises the difficulty of staying independent in a commodity-restoration market position, because the consolidators have scale advantages on carrier-program economics, technology, and back-office cost. The defensible independent posture is to specialize, professionalize, and build differentiated capability — the specialty wedge from the prior cluster, plus the operational discipline this cluster discusses.

    The owner-operator who reads this cluster should be doing so with a clear strategic intent. Either build to scale, build to exit, or build to remain durably independent in a defensible niche. All three are legitimate. None of them happen by accident, and all of them require the financial and operational discipline this cluster describes.

    Related on Tygart Media: gross margin mix · accounts receivable · overhead allocation.

    Frequently asked questions

    What does this cluster cover that the marketing stack and partner industries clusters do not? The marketing stack covers demand generation — how a restoration company gets work in the door. The partner industries cluster covers referral relationships — how a restoration company gets work from adjacent service providers. The specialty restoration cluster covers the commercial-account wedge. This cluster covers what happens after work comes in: how the company is financed, how its operations are structured, how its profitability is managed, and how the owner positions the business for long-term value creation. All four clusters are needed to run a complete restoration business.

    What revenue range is this cluster aimed at? Primarily $2 million to $30 million in annual revenue — the owner-operator independent segment. The articles acknowledge what changes above $30 million and at $50-million-plus scale, particularly in the multi-location and M&A pieces, but the core advice is calibrated to operators who own the business they are running.

    Why are the gross margin numbers cited so different from what I see in my own books? Because every operator’s mix, geography, labor structure, and equipment posture is different. The numbers cited — water 70-80 percent, mold 40-50 percent, fire 25-30 percent, reconstruction around 10 percent — are industry directional ranges from public benchmarks and CFO commentary, not specific predictions for any individual company. Use them as a sanity check on your own numbers. If your water mitigation gross margin is 50 percent, that is a real signal worth investigating — likely a labor-cost issue, an Xactimate pricing issue, or an overhead-allocation issue. If your reconstruction margin is 25 percent, that is also a real signal worth investigating — likely a scoping or labor-attribution issue. The benchmarks are the start of a conversation, not the end of one.

    Should I be running this cluster’s discipline before pursuing the specialty wedge from the prior cluster? Yes, in most cases. The specialty wedge is a growth strategy for commercial accounts. The financial and operational discipline in this cluster is the foundation that lets a restoration company actually capture and sustain that growth. An operator who pursues commercial specialty work with sloppy AR, undisciplined service mix, and informal operations will win some accounts and then implode under the weight of work they cannot service profitably. The order is: get the operating system clean, then expand into commercial specialty. There are exceptions — operators who already have clean operations and are specifically growth-constrained should pursue the specialty wedge in parallel — but for most operators, the cluster sequencing is operations first, growth second.

    Do consolidators pay enough that an exit makes financial sense for an owner-operator? It depends on the company, the buyer, the structure, and the timing. Industry deal multiples in restoration vary widely — public references from Viking Mergers, Peak Business Valuation, and First Page Sage show small-shop SDE multiples typically in the 2.3x-3.5x range, smaller EBITDA deals in the 3x-4x range, and PE platform-level deals in the 4x-7x range, with the highest multiples reserved for differentiated, well-managed operators with national-scale appeal. The M&A article in this cluster covers what drives the spread and what an owner can do over a two-to-three-year horizon to position for the higher end. For most owner-operators, the answer is that exit is a real wealth-creation event when the company has been built deliberately for it, and a disappointment when the owner has run the business well operationally but never thought about exit value until they were ready to sell.

    What if my company is already at $50 million-plus revenue — is this cluster useful? The pillar and several articles still apply at any scale. The AR cycle, service-line economics, and KPI dashboard articles are scale-agnostic. The labor and crew article scales with adaptation. The equipment article scales with adaptation. The multi-location and M&A articles are written specifically for the upper end. The cluster is calibrated to the owner-operator segment but does not pretend that the lessons stop there.

    Why is this published on Tygart Media rather than packaged as a paid product? Because Tygart Media’s content thesis is that the most valuable operator-level intelligence in the restoration industry is given away to readers who become long-term operating partners with Tygart. The companies that read this cluster, find it useful, and hire Tygart for managed marketing operations are the ones who become five-year clients. The economics work. The cluster is free for the same reason the prior three clusters are free.

    What should I read after this pillar? Start with the AR aging and Xactimate-to-cash cycle article — it is the single highest-leverage operational improvement most restoration companies can make. From there, the gross margin by service line article naturally follows. After those two, sequencing is operator-dependent. An operator at $5 million should pick crew structure or KPI dashboards next. An operator at $25 million should pick multi-location growth or preferred-vendor program economics next. The cluster works in any order after the first two articles.

    Is this cluster going to be updated as industry conditions change? Yes. The restoration industry is in active consolidation, carrier-program economics are shifting, and the technology stack available to operators is changing rapidly. Tygart Media revisits the cluster on roughly an annual basis to update industry references, refresh the consolidator landscape, and incorporate new operator intelligence. Readers who subscribe via the email list at the bottom of any Tygart Media page will be notified when major updates occur.

    What is the single most important takeaway from this pillar? That a restoration company is a real business, not a service shop, and the operators who treat it as a real business — with deliberate financial discipline, deliberate operational structure, deliberate growth strategy, and deliberate exit positioning — compound their wealth at multiples of the operators who treat it as a service shop. The work is not glamorous. The discipline is not optional. The cluster that follows describes the work in detail.

  • Restoration Carbon Protocol Guide for Facility Managers

    Restoration Carbon Protocol Guide for Facility Managers

    If you manage facilities for a corporate occupier and you have been trying to figure out how to get Scope 3 emissions data from your restoration contractors, the Restoration Carbon Protocol (RCP) exists to answer that question. This article explains what the RCP is, how it works, and what IFMA members specifically need to know about using it as a procurement and compliance tool.

    What the Restoration Carbon Protocol Is

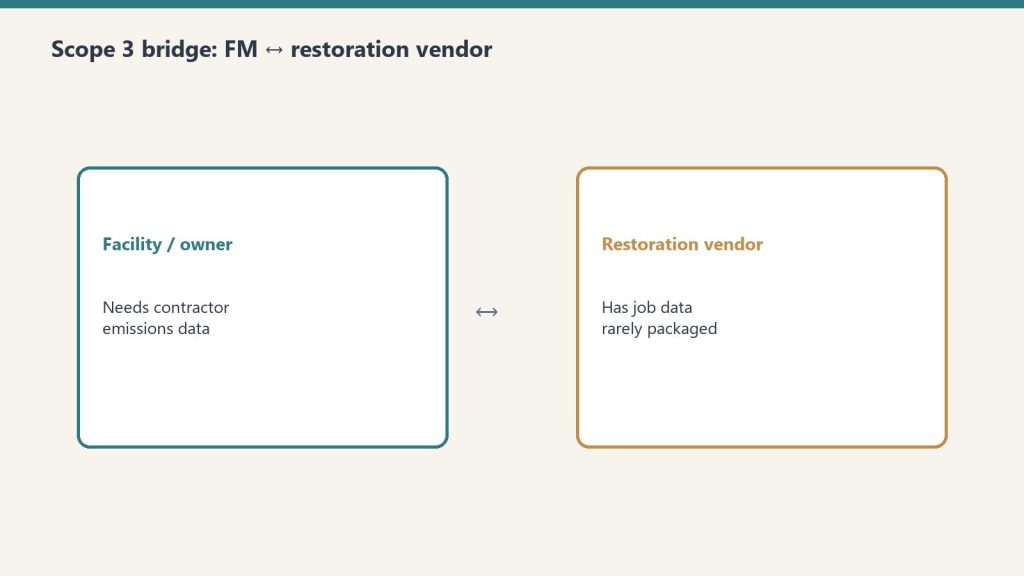
    Bridge diagram between facility owners and restoration vendors for Scope 3 data
    What the Restoration Carbon Protocol is.

    The RCP is an industry self-standard published by Tygart Media that defines how restoration contractors should calculate, document, and report the greenhouse gas emissions associated with each project they complete. It is built on the GHG Protocol’s Corporate Value Chain (Scope 3) Standard — the same framework used by most corporate ESG reporting programs and required by SB 253 and CSRD.

    The RCP fills a specific void: no restoration industry body — not IICRC, not RIA, not any trade association — had previously published a Scope 3 reporting methodology for restoration work. Commercial property managers and corporate FM teams asking their restoration vendors for emissions data were getting blank stares. The RCP gives contractors the methodology and gives FM procurement teams the standard to reference.

    The Five Core Restoration Job Types and Their Scope 3 Mapping

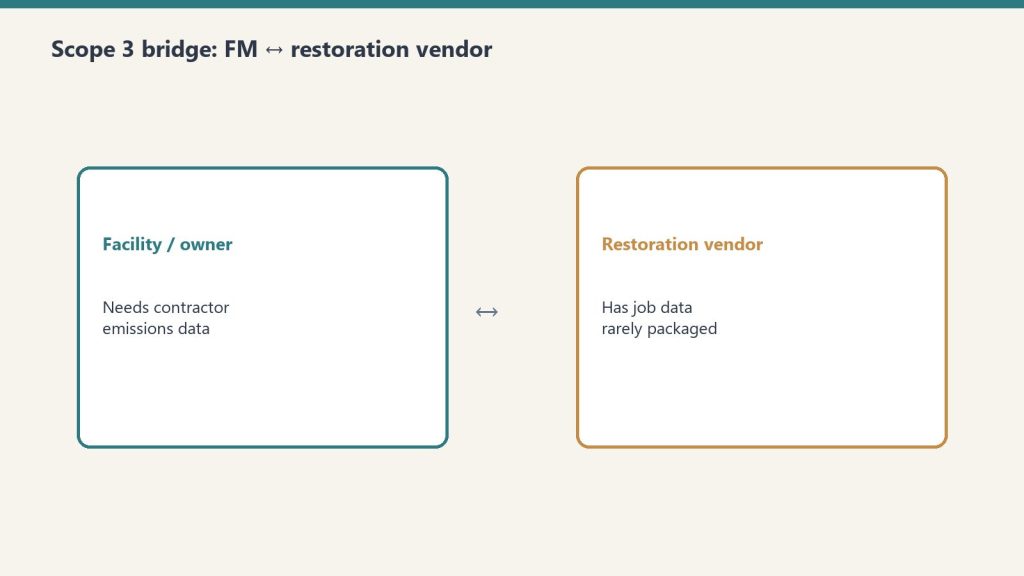
    Bridge between facility owners and restoration vendors for Scope 3 data
    Five core job types and their Scope 3 mapping.

    The RCP maps each of the five primary restoration job types to the relevant GHG Protocol Scope 3 categories:

    • Water damage restoration: Category 1 (services purchased), Category 5 (waste from extracted water and contaminated materials)
    • Fire and smoke restoration: Category 1 (services), Category 5 (soot, char, and demolition debris waste streams)
    • Mold remediation: Category 1 (services), Category 5 (contaminated building materials removed)
    • Asbestos and hazmat abatement: Category 1 (services), Category 5 (regulated waste disposal), Category 4 (specialized transport)
    • Biohazard cleanup: Category 1 (services), Category 5 (medical and biological waste streams)

    In all five cases, the primary Scope 3 category for the FM client is Category 1 — Purchased Goods and Services. The emissions are generated by the contractor performing work on your behalf at your facility.

    The 12 Data Points: What to Ask Your Contractor to Track

    Restoration SOP clipboard with checklist, moisture meter, and gloves on a jobsite table
    Twelve data points to ask your contractor to track.

    The RCP defines 12 data points that a restoration contractor should capture on each job to enable a complete Scope 3 calculation. As an FM procurement professional, these are the data fields you should be requiring in your vendor agreements:

    1. Total diesel consumed by drying and dehumidification equipment (gallons)
    2. Total propane or natural gas consumed by heat drying equipment (cubic feet or gallons)
    3. Total vehicle miles traveled to and from the site by all crew vehicles
    4. Number of crew vehicle trips and vehicle types (van, pickup, box truck)
    5. Total equipment operating hours (by equipment category)
    6. Weight of water extracted and removed from the site (gallons or pounds)
    7. Weight and type of contaminated materials removed (drywall, insulation, flooring, etc.)
    8. Disposal method for each waste stream (landfill, recycling, hazardous waste facility)
    9. Refrigerants used, recovered, or vented (for HVAC-adjacent work)
    10. Materials installed by type and weight (for reconstruction phases)
    11. Cleaning agents and chemical products used by product category
    12. Total project duration in days

    Not every data point is relevant to every job type. The RCP provides job-type-specific templates that pre-populate the relevant fields for water, fire, mold, hazmat, and biohazard jobs respectively.

    How FM Teams Can Use the RCP Framework

    There are three practical ways IFMA members can incorporate the RCP into their FM operations:

    1. Vendor Qualification

    Add RCP awareness to your restoration vendor qualification checklist. Ask prospective vendors whether they have adopted the RCP framework. Vendors who can demonstrate RCP familiarity are already capturing the data you need; vendors who cannot are a data gap risk for every job they complete.

    2. Contract Language

    Include a Scope 3 data provision clause in restoration vendor agreements referencing the RCP as the accepted methodology standard. This gives vendors a concrete deliverable (the RCP Job Carbon Report) rather than an open-ended “emissions data” request they have no idea how to fulfill.

    3. Scope 3 Inventory Integration

    Route the per-job RCP carbon reports from your restoration vendors into your Scope 3 Category 1 data collection system. Most ESG reporting platforms (Watershed, Persefoni, Salesforce Net Zero Cloud, etc.) accept Category 1 supplier data in standardized formats. The RCP report is designed to map directly to these platforms’ input requirements.

    The RCP Is Free to Use

    The Restoration Carbon Protocol is published as an open industry standard. There is no licensing fee, no certification requirement, and no vendor lock-in. FM teams can share the RCP framework directly with their restoration vendors at no cost. Contractors can adopt the RCP’s data capture templates and calculation methodology without purchasing anything.

    The goal is adoption — the more restoration contractors who begin tracking RCP-compliant data, the more complete FM Scope 3 inventories become across the industry.

    Frequently Asked Questions

    Is the RCP recognized by IICRC or RIA?

    The RCP is an independent industry self-standard published by Tygart Media. It is not currently endorsed by IICRC or RIA, as neither body has published a competing ESG standard. The RCP fills the void those bodies have not addressed. FM teams and restoration contractors can adopt it independently without waiting for official industry body endorsement.

    How does a restoration contractor become RCP-certified?

    The RCP v1.0 includes a self-certification checklist. Contractors complete the checklist to demonstrate they have implemented the required data capture processes and calculation methodology. Third-party verification is available for organizations that require audited certification. Details are published at tygartmedia.com/category/esg-restoration/.

    Part of the IFMA Scope 3 series. The full RCP framework is available at tygartmedia.com.

  • Restoration Marketing: The Complete 2026 Strategy Guide

    Restoration Marketing: The Complete 2026 Strategy Guide

    Restoration marketing is not home services marketing. The buying cycle is broken — most homeowners don’t shop until water is on the floor, and most commercial accounts don’t buy a restorer until they need one at 2 a.m. Generic marketing playbooks designed for HVAC, roofing, or landscaping fall apart when applied to a category where 80% of demand is reactive emergency work and the other 20% is relationship-driven preferred-vendor placement.

    This guide is the complete restoration marketing playbook for 2026: every channel that matters, the math behind each one, and the prioritization framework that separates restoration companies that grow from the ones stuck at the same revenue line for five years running.

    What restoration marketing actually has to accomplish

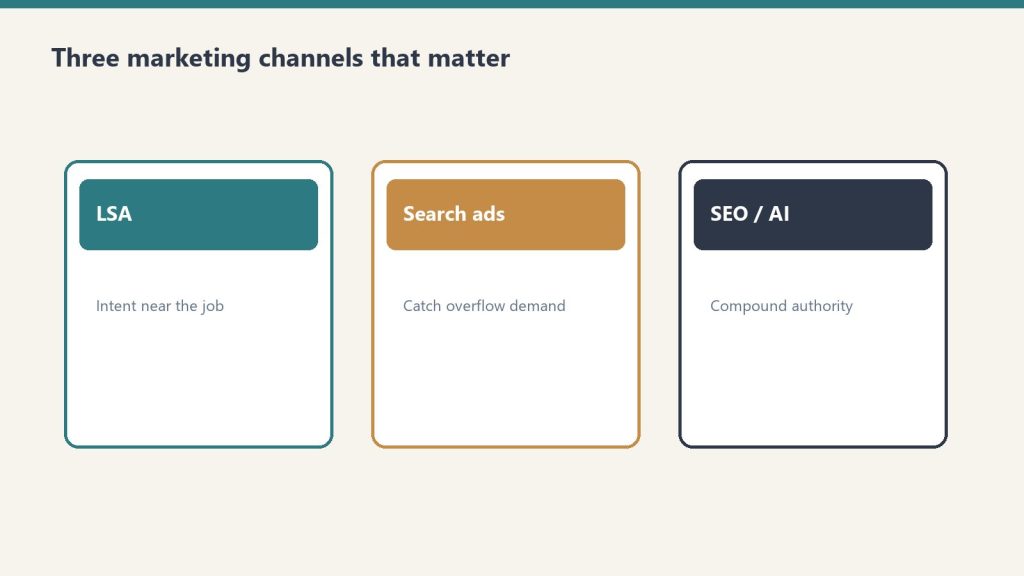
    Three cards for LSA, search ads, and SEO/AI authority channels
    What restoration marketing has to accomplish.

    Most marketing strategies aim for one job: generate leads. Restoration marketing has to do four things simultaneously, and most companies only get one or two right.

    The four jobs are capture emergency demand (be the first call when a pipe bursts), build commercial preferred-vendor pipeline (get on lists at facilities, property management firms, and TPAs), maintain referral momentum (stay top of mind with plumbers, agents, adjusters, and past customers), and build the brand asset (so when an insurance carrier or commercial buyer Googles you, what they find sells the relationship). A program that generates emergency leads but ignores commercial pipeline gets stuck at residential ceiling. A program that builds a great brand but ignores Local Service Ads loses the late-night calls that pay the rent.

    The restoration marketing channel stack

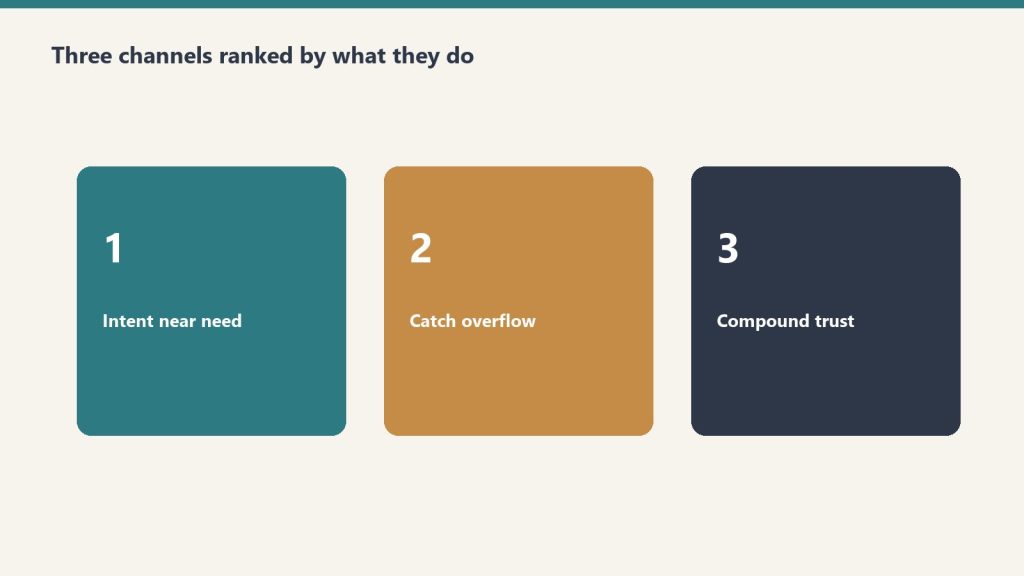
    Three ranked panels: intent near need, catch overflow, compound trust
    The restoration marketing channel stack.

    Here is the complete channel inventory for a modern restoration company, ranked by typical contribution to revenue for an established multi-truck operation.

    1. Local Service Ads (LSAs)

    LSAs are pay-per-lead Google products that appear above the map pack on local emergency searches. For restoration, this is the single most ROI-positive channel that exists. A “water damage near me” lead from LSAs typically costs between $35 and $85 in most US markets, and converted jobs run $3,000 to $15,000+ in revenue. Setup requires Google Guarantee verification, license uploads, insurance documentation, and review velocity. Most restoration companies underinvest in LSAs because the dashboard is unfamiliar — that’s the opportunity.

    2. Local SEO and Google Business Profile

    The map pack is where emergency restoration searches convert. Optimizing your Google Business Profile, building genuine review velocity (target 4.7+ stars with 100+ reviews per location), publishing service-area landing pages with city-level intent, and earning local citations is the second pillar. Local SEO compounds — a company that builds it for two years has a moat competitors can’t buy.

    3. Google Ads (paid search)

    Outside LSAs, paid search on terms like “water damage restoration [city],” “mold remediation,” and “fire damage cleanup” remains a workhorse. Tight match-type discipline, location targeting at the ZIP level, call extensions, and aggressive negative keyword lists are non-negotiable. Without those, Google will happily spend $200 a day on irrelevant queries.

    4. Content marketing and SEO

    Long-form content does two things at once: it captures top-of-funnel research traffic (“what to do after water damage,” “how to dry out a wet basement”) and it builds the authority signals that move your map pack rankings. The mistake most restorers make is publishing thin 400-word service pages and calling it SEO. Real content marketing means 1,500+ word answers, expert-reviewed posts, original photos, and a publishing cadence the operator can actually sustain.

    5. Commercial business development

    Commercial restoration is a relationship business that masquerades as a marketing problem. The “marketing” here is structured outreach to property managers, facility directors, REITs, healthcare facilities, and commercial insurance brokers — combined with branded sales collateral, capabilities decks, and a website that looks like a commercial vendor rather than a residential carpet cleaner.

    6. Referral programs (plumbers, agents, adjusters)

    The classic restoration referral playbook is alive and well. Structured plumber programs (with co-branded marketing, fast response promises, and clear referral tracking), insurance agent breakfast meetings, and independent adjuster relationships still produce 20-40% of revenue at most established restoration shops.

    7. TPA and carrier preferred vendor programs

    Joining programs like Contractor Connection, Code Blue, Sedgwick, Crawford, and Allstate’s preferred vendor lists is its own marketing channel — applications, audits, performance metrics, and ongoing scorecard management. The work is high-volume but margin-compressed, so this channel needs to be planned, not stumbled into.

    8. Social media and brand content

    Social is mostly a brand and recruiting channel for restoration, not a direct lead channel. LinkedIn for commercial business development, Facebook for community presence and reviews, and Instagram for technician recruiting and culture content. Don’t expect TikTok to fill your truck.

    9. Email marketing

    Often ignored, email is the cheapest way to stay top of mind with referral partners and past customers. Quarterly newsletter to plumber partners, monthly tips to agents, and seasonal reminders to past customers keep the referral engine warm.

    How to allocate the marketing budget

    For a restoration company doing $1M to $5M in annual revenue, the typical healthy budget allocation looks like: 35-45% LSAs and Google Ads, 15-20% local SEO and content, 15-20% commercial business development (sales rep cost, collateral, events), 10-15% referral program maintenance, and the rest to brand and recruiting. Companies under $1M should weight more heavily into LSAs and direct response — brand spending before you have the operational base to handle volume is wasted budget.

    The KPIs that actually matter

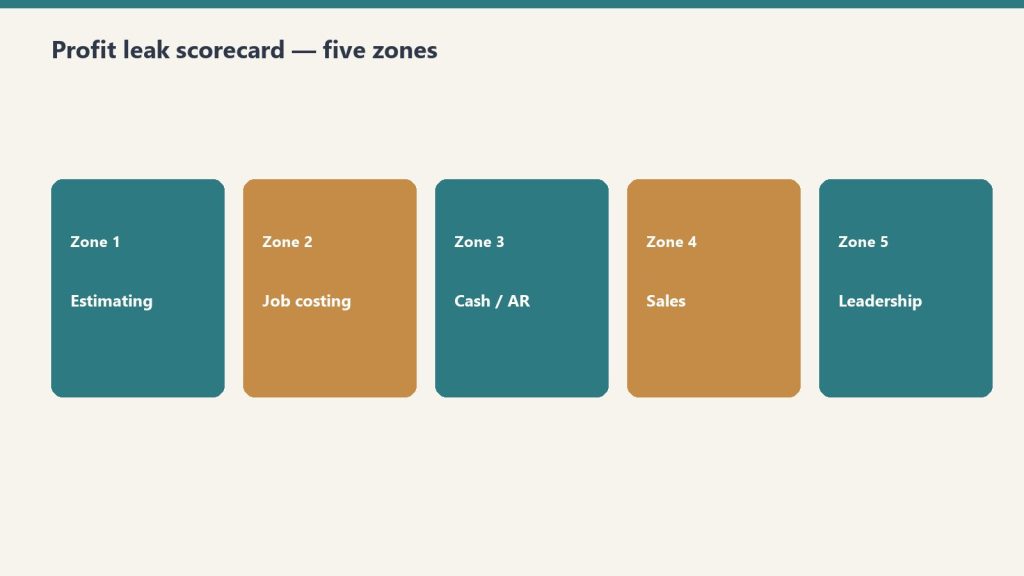
    Five zone panels: estimating, job costing, cash/AR, sales, leadership
    KPIs that actually matter.

    Most restoration marketing dashboards track vanity metrics. The numbers that predict whether a marketing program is working are cost per qualified lead (not raw lead — qualified means the customer answered the call and the job has insurance or out-of-pocket budget), lead-to-job conversion rate (industry healthy range is 35-55% for residential, 15-30% for commercial), average ticket by source (LSAs and Google Ads jobs typically run smaller than referral or commercial jobs), and marketing ROI by channel (revenue divided by marketing spend, calculated quarterly).

    The 90-day restoration marketing audit

    If you inherited a restoration marketing program or you’re not sure where you stand, here’s the audit framework. Pull your last 90 days of leads. Tag each by source. Calculate cost per qualified lead by channel. Calculate revenue produced by channel. Identify the single best-performing channel and the single worst. Cut the worst, double down on the best, and pick one new channel to test for the next quarter. That’s the entire program.

    Related on Tygart Media: Starlink on a water job · S500 in the van · local SEO for restoration.

    Frequently Asked Questions

    How much should a restoration company spend on marketing?

    Healthy restoration marketing spend ranges from 6% to 12% of revenue, depending on growth stage and market competitiveness. Companies in startup or rapid-growth mode often spend 10-15%; mature operators with strong referral pipelines may run as low as 4-6% because referral and TPA channels carry more of the load.

    What is the best marketing channel for restoration companies?

    For emergency residential work, Local Service Ads typically deliver the best cost per acquired job. For commercial restoration, structured business development to property managers and facility directors outperforms any digital channel. The right answer depends on which side of the business you’re trying to grow.

    How long does restoration SEO take to work?

    Local SEO and Google Business Profile optimization can move map pack rankings within 60-120 days for less competitive markets. Organic blog content takes 6-12 months to mature and produce consistent traffic. Companies expecting immediate organic results will be disappointed; companies that commit to a 12-month horizon usually see meaningful results.

    Are Local Service Ads worth it for restoration?

    Yes, in most markets. LSAs typically deliver the lowest cost per acquired customer of any digital channel for emergency restoration services. The exceptions are extremely competitive metros where lead pricing has been bid up significantly, or service areas where Google Guarantee verification is delayed.

    Should I hire a restoration marketing agency or do it in-house?

    Companies under $2M in revenue typically benefit from a specialized restoration marketing agency that already knows the channels and pitfalls. Companies above $5M often hire an in-house marketing director and use agencies tactically for SEO, paid media, or content. The middle range is the hardest — that’s where most restoration marketing money gets wasted.

    What does a restoration marketing plan look like?

    A real plan has four components: a channel mix and budget allocation, a 12-month content and publishing calendar, a quarterly business development plan for commercial pipeline, and a measurement framework that tracks cost per qualified lead and revenue per channel. Anything less is a wish list.

  • Restoration Lead Generation: The Complete 2026 Guide

    Restoration Lead Generation: The Complete 2026 Guide

    Every restoration owner in America is looking for the same thing: more qualified water, fire, and mold leads at a cost that lets them stay profitable. The market is flooded with promises — buy these exclusive leads, run these ads, sign up for this network — and most of them don’t survive contact with reality.

    This is the complete operator’s guide to restoration lead generation: the honest economics of every channel, what cost per acquired job looks like in real markets, and the framework for building a lead engine that compounds instead of one that has to be re-fed every Monday morning.

    The five categories of restoration leads

    Three ranked panels: intent near need, catch overflow, compound trust
    Five categories of restoration leads.

    Every restoration lead, no matter how it’s marketed, falls into one of five categories. Understanding which category a lead source belongs to is the first step to evaluating whether it deserves your money.

    The five categories are direct organic (someone Googles you and calls), paid search and LSAs (you pay Google for a click or a lead), third-party lead aggregators (Networx, HomeAdvisor, Thumbtack, restoration-specific platforms), preferred vendor programs and TPAs (insurance carriers and third-party administrators send you work), and referrals (plumbers, agents, adjusters, past customers). Each has a different economic profile, conversion rate, and durability.

    Organic and direct leads: the gold standard

    A direct call from someone who Googled your name or got referred by a neighbor is the most valuable lead in restoration. There’s no middleman cost, the trust signal is high, and the conversion rate from call to job typically runs 50-70%. The catch: building enough brand and SEO presence to generate this volume reliably takes years. Restoration companies that are 5+ years old in their market with strong reviews and SEO often see 30-50% of their leads come direct.

    Local Service Ads (LSAs)

    Three cards: verify business facts, respond to disputes fast, protect with job quality
    Local Service Ads — overflow and intent.

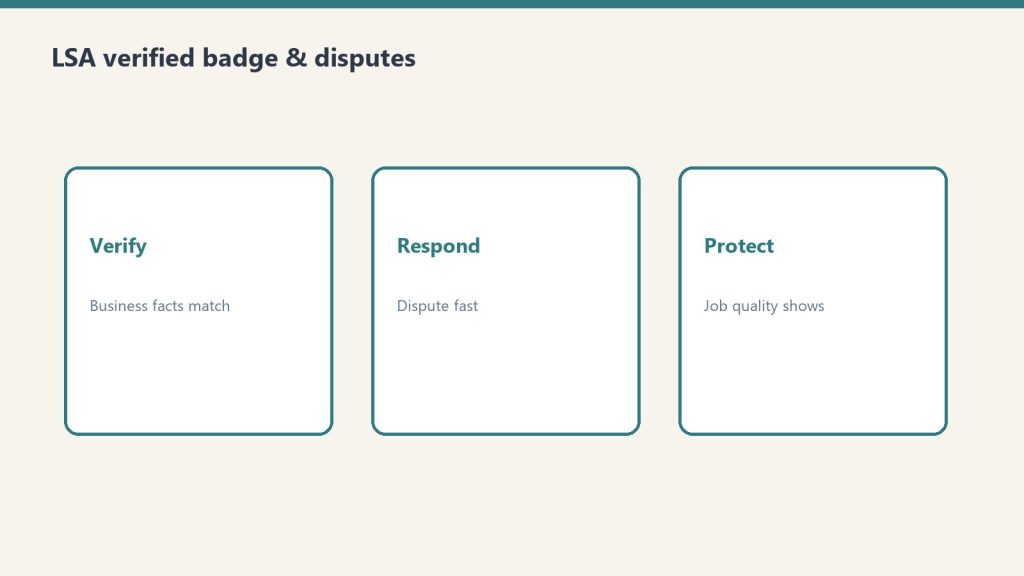
    LSAs are Google’s pay-per-lead product that sits above the map pack on emergency searches. For restoration, this is typically the highest-ROI paid channel available. Cost per lead in most US markets ranges $35-$85, with conversion rates from lead to job running 40-60%. Acquiring a $5,000 water mitigation job for a $150-200 marketing cost is normal here. Setup requires Google Guarantee verification, ongoing review generation, and active dispute management for unqualified leads.

    Google Ads (paid search)

    Red checklist of five reasons restoration Google Ads waste budget
    Google Ads bleed money without structure.

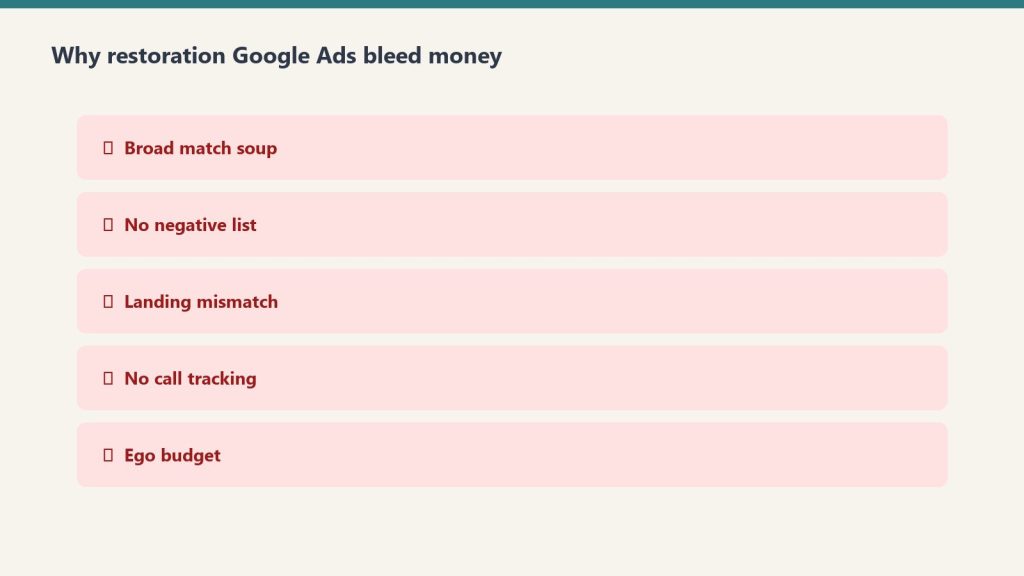
    Standard PPC on terms like “water damage restoration [city],” “mold remediation near me,” and “fire damage cleanup” still works, but only with disciplined campaign management. Cost per click in competitive metros runs $20-$80 for top emergency terms. Without aggressive negative keywords, location targeting, and call-only or call-extension setups, Google will happily incinerate the budget on irrelevant traffic.

    Lead aggregators and lead-buying platforms

    HomeAdvisor, Networx, Angi, Thumbtack, and restoration-specific platforms (33 Mile Radius, Lead PPC, Restoration Marketing Pros lead programs, etc.) sell leads on a per-lead or per-month basis. The economics here vary wildly. Shared leads (sold to 3-5 contractors) typically run $35-$90 with conversion rates of 5-15%, making real cost per acquired job $300-$1,500. Exclusive leads (sold only to you) run $150-$500 with higher conversion rates. Most restoration operators who buy leads either love them or hate them — the dividing line is usually how disciplined the company is about speed-to-call (under 2 minutes is the bar) and qualification scripting.

    TPA and carrier preferred vendor programs

    Contractor Connection, Code Blue Restoration, Sedgwick CCMSI, Crawford & Company, Allstate, State Farm Premier Service, USAA, and the dozens of regional TPAs all run vendor networks that send work to qualified contractors. The economics are different — you’re not paying per lead, you’re paying in margin compression (typically 10-20% off retail Xactimate pricing), program audit overhead, and required SLAs (24-hour response, daily updates, photo documentation, etc.). A well-run TPA program can fill 30-60% of a residential mitigation truck’s calendar; a poorly managed one will burn margin and goodwill simultaneously.

    Plumber and trade referral programs

    The classic restoration lead source. Plumbers see water damage first — when they pull a P-trap and find a slow leak that’s been running for months, the homeowner needs a restorer. A formal plumber referral program (with co-branded marketing, fast-response promises, lead tracking, and quarterly thank-yous — gift cards, dinners, branded swag) routinely produces 100-300 leads per year per major plumbing partner. Three to five strong plumber partners can fill a substantial portion of a small operator’s calendar.

    Insurance agent and adjuster referrals

    Local independent insurance agents who write homeowners policies are referral gold. They want a contractor they can trust to handle their insureds’ losses well so policies don’t churn. Independent adjusters working catastrophe and daily claims also refer. Building these relationships takes time — agent breakfast meetings, monthly tips emails, claim co-presentation, and consistent customer satisfaction reports back to the agent.

    What “exclusive restoration leads” actually means

    “Exclusive” is the most abused word in the lead generation industry. Some platforms genuinely sell each lead to only one contractor; many “exclusive” programs are actually just shared leads with extra steps. Before paying for any exclusive lead program, get the answers in writing: how is exclusivity defined geographically (ZIP, city, county)? How is it defined temporally (exclusive for one hour, one day, forever)? What happens if the customer also fills out a form on a competing platform? How are disputes handled?

    The lead generation economics framework

    To compare any two lead sources fairly, you need four numbers per channel: cost per lead, lead-to-job conversion rate, average job revenue, and gross margin on jobs from that source. The math: cost per lead divided by conversion rate equals cost per acquired job. Cost per acquired job divided by average job revenue equals customer acquisition cost as percent of revenue. A healthy restoration program runs CAC in the 5-15% of revenue range for residential and 2-8% for commercial.

    The 30-day lead generation diagnostic

    If your phone isn’t ringing enough, here’s the 30-day diagnostic. Pull every lead from the last 90 days. Tag each by source. Calculate cost per acquired job by source. Identify the bottom two sources by ROI and cut them. Take that budget and split it: 50% goes to doubling down on your best performing channel, 50% goes to testing one new channel. Run for 90 days. Repeat the diagnostic. This is how high-performing restoration companies build channel discipline over time.

    Related on Tygart Media: Starlink on a water job · S500 in the van · local SEO for restoration.

    Frequently Asked Questions

    What is the best source of restoration leads?

    For emergency residential work, Local Service Ads typically deliver the best ROI in most US markets. For commercial work, structured business development to property managers and facilities directors outperforms any paid lead source. For sustained organic volume, Google Business Profile optimization and review velocity drive direct calls that compound over time.

    How much do restoration leads cost?

    Costs vary widely by source: Local Service Ads run $35-$85 per lead in most markets; Google Ads CPCs for emergency restoration terms range $20-$80; shared leads from aggregators cost $35-$90; exclusive leads from third-party platforms run $150-$500; preferred vendor programs charge no per-lead cost but compress margin 10-20%.

    Are restoration lead-buying platforms worth it?

    It depends on the platform and your operational discipline. Companies that answer leads in under two minutes, run a tight qualification script, and track ROI by source can profitably buy leads. Companies that let leads sit for hours or skip qualification will lose money on almost any lead-buying platform.

    How do I get more commercial restoration leads?

    Commercial leads come from relationships, not digital channels. The proven plays are direct outreach to property managers and facility directors, attending IFMA and BOMA chapter events, joining commercial insurance broker referral networks, and building case studies that prove you can handle large losses. Digital marketing supports these activities but rarely originates commercial leads on its own.

    What is a good lead-to-job conversion rate for restoration?

    Healthy benchmarks: residential emergency leads from LSAs and Google Ads should convert at 40-60%; shared leads from aggregators 5-15%; exclusive leads 30-50%; referral leads 60-80%; commercial RFP leads 15-30%. Companies under these benchmarks usually have a speed-to-call problem or a script problem, not a lead quality problem.

    How fast do I need to respond to restoration leads?

    Under two minutes is the modern bar for emergency restoration leads. Conversion rates drop sharply after five minutes and collapse after thirty. The best operators have a 24/7 trained answering service or in-house call center, not a voicemail and a callback system.

  • Restoration Sales Playbook: Commercial & Residential

    Restoration Sales Playbook: Commercial & Residential

    Most restoration companies don’t have a sales process. They have an owner who answers the phone, gives a verbal estimate, and hopes the customer says yes. That works until it doesn’t — usually around the $1.5M revenue line, when the owner can no longer touch every job and the company plateaus.

    This is the complete restoration sales playbook for both commercial and residential. The processes, the scripts, the objections, the comp plans, the metrics, and the org structure that turn restoration sales from “the owner’s gut” into a scalable engine.

    Why restoration sales is different from other home services

    Side-by-side comparing a pitch dump with value-first contact habits
    Why restoration sales is different from other home services.

    Three things make restoration sales unique. First, most customers don’t want to be there — water on the floor, fire damage, mold smell — and the buying experience is emotional, not transactional. Second, insurance is usually the third party in the room, which means the sale has both a customer-facing dimension and a carrier-facing scope-and-pricing dimension. Third, the urgency window is short — a homeowner with three inches of water in the basement is making a decision in the next sixty minutes, not the next sixty days. A sales process built for HVAC replacement or kitchen remodels doesn’t work in this environment.

    The residential restoration sales process

    The clean residential process has six steps. First, the inbound call or arrival — set the customer at ease, gather the basics, dispatch the truck. Second, the on-site walk and assessment — physically inspect the loss, document with photos and a moisture map, identify scope. Third, the trust-building conversation — explain what’s happening, what the company will do, what the timeline looks like, what the insurance process will involve. Fourth, the work authorization — get the signature on the work authorization form and the AOB (assignment of benefits) where used, with clear scope language. Fifth, the daily progress update — text or call the customer every day with what was done and what’s next. Sixth, the close-out and review request — final walkthrough, signed completion certificate, immediate ask for the Google review.

    The commercial restoration sales process

    Five-step commercial sales system from list to first-job audition
    The commercial restoration sales process.

    Commercial is fundamentally different — longer sales cycle, multiple stakeholders, RFP and master service agreement structures. The commercial process has eight steps. First, identify and qualify the target (property managers, facility directors, REIT operations teams, healthcare facility managers, hotel chains). Second, cold outreach via email, phone, LinkedIn, or in-person drop-bys. Third, discovery meeting to understand current vendor situation, pain points, and decision criteria. Fourth, capabilities presentation — branded deck, case studies, references, certifications. Fifth, RFP response or vendor application — formal pricing schedules, COI, W-9, MSA negotiation. Sixth, onboarding and first job — usually a small loss to prove the relationship works. Seventh, account management — quarterly business reviews, scorecard tracking, expansion within the account. Eighth, renewal and reference development — turn happy commercial accounts into case studies and references for the next prospect.

    The five most common restoration sales objections (and how to handle them)

    “I need to call my insurance company first.” This is the most common objection on residential. The honest answer: yes, they should call insurance, but they don’t need to wait for insurance to authorize emergency mitigation. Mitigation is a duty owed by the homeowner under almost every policy, and delaying mitigation usually causes more damage and more denials, not fewer. Explain this calmly, point them to their policy language, and offer to be on the call when they reach the carrier.

    “How much is this going to cost?” The wrong answer is a number. The right answer is “it depends on what we find when we open up the affected areas, but I can walk you through how Xactimate pricing works, what your policy typically covers, and what your out-of-pocket exposure is likely to be.” Rebuild trust with transparency, not with an unreliable estimate that you’ll have to retract later.

    “My uncle/cousin/neighbor does this kind of work.” Don’t fight it. Acknowledge it, then differentiate: “If they’re certified IICRC and carry the right insurance, that’s great — we’re happy to be the second opinion. If you’d prefer to use them, we still recommend you start mitigation in the next few hours either way.” Sometimes you’ll lose the job. Often the customer will quietly reconsider when they realize what’s actually involved.

    “Your competitor quoted me less.” The hidden answer to this objection is almost always scope, not rate. Walk through the scope item by item with the customer. Identify what’s missing in the competitor’s proposal. Explain what gets denied or supplemented later when the carrier reviews. Most price objections in restoration are scope-comparison failures, not pricing failures.

    “I want to think about it.” Time is not a luxury in restoration. The honest, professional response: “I understand. The challenge is that every hour we wait, the loss usually gets worse and the carrier may push back on damage that could have been prevented. Can we start emergency mitigation now and you finalize the rest of the scope tomorrow?”

    Sales rep compensation: the models that work

    Three compensation structures dominate in restoration. Salary plus bonus works for inside sales reps and commercial business development, where the sales cycle is long and the rep needs predictable income. Typical structure: $60K-$90K base plus 1-3% of revenue from accounts they bring in, capped or uncapped depending on territory size. Commission-only works for outside residential sales reps in markets with high enough volume to support it. Typical structure: 5-10% of gross revenue or 10-15% of gross profit, with a draw against commission for the first 90 days. Salary plus team bonus works for production-side sales (project managers who upsell during jobs). Typical structure: production manager salary plus a small percentage of completed job revenue tied to customer satisfaction scores.

    The metrics that predict restoration sales performance

    Three panels showing one problem, three options, one recommendation
    The metrics that predict restoration sales performance.

    Forget revenue as the primary metric — it’s a lagging indicator. The leading indicators that predict next quarter’s revenue are activity volume (calls made, meetings held, proposals sent), pipeline value (sum of qualified opportunities × probability), conversion rates by stage (lead to qualified, qualified to proposal, proposal to close), average deal size by source, and sales cycle length by deal type. A weekly pipeline review using these five metrics will tell you what’s coming three months out.

    When to hire your first sales rep

    Most restoration owners hire too late. The right trigger is when you can confidently answer two questions: “do I have a documented sales process I can hand to someone else?” and “do I have enough lead flow to keep a sales rep at 70%+ capacity?” If both are yes and you’re at $1.5M+ in revenue, it’s time. The first sales hire should usually be a residential closer or commercial business development rep, depending on which side of the business has the bigger growth ceiling.

    Related on Tygart Media: sales training · commercial sales · CRM pipeline.

    Frequently Asked Questions

    What does a restoration sales rep actually do?

    Residential sales reps respond to inbound emergency calls, conduct on-site walks, write scopes, present pricing, secure work authorizations, and manage the customer relationship through completion. Commercial sales reps prospect property managers and facility directors, conduct discovery meetings, deliver capabilities presentations, respond to RFPs, negotiate MSAs, and manage assigned accounts long-term.

    How much does a restoration sales rep make?

    Residential outside sales reps in restoration typically earn $60K-$120K total compensation, depending on market, lead flow, and commission structure. Commercial business development reps with established books of business often earn $90K-$200K. New hires in their first year usually fall into the $50K-$80K range while building pipeline.

    How do you sell commercial restoration services?

    Commercial restoration sales is relationship-based business development, not transactional sales. The process: identify target accounts (property managers, facility directors, REITs, healthcare, hospitality), build relationships through outreach and industry events, present capabilities through branded decks and case studies, win small jobs first to prove competence, then expand to MSA-level relationships and preferred vendor status.

    What is the close rate for restoration sales?

    Healthy close rates by segment: residential emergency leads 40-60% from lead to job; residential planned/estimated work 25-40%; commercial RFPs 15-30%; commercial referral-based opportunities 35-55%. Companies significantly below these ranges usually have a process or speed problem, not a market problem.

    Should I hire a restoration sales coach or consultant?

    Restoration sales coaching has matured into a real category — there are several specialists who focus exclusively on this industry. Coaching tends to deliver the best ROI for owners who already have lead flow but are struggling with conversion, or for sales reps in their first 12-24 months who need scaffolding on process and objection handling. It’s less useful for foundational issues like lead generation or operational capacity.

    How do you train a restoration sales rep?

    Effective restoration sales training has four pillars: technical knowledge (water categories, drying science, restoration process, IICRC standards), insurance literacy (policy language, claims process, Xactimate basics, supplements), sales process and scripts (call handling, on-site discovery, scope presentation, objection handling, close), and ride-alongs with the owner or senior rep for the first 60-90 days before independent calls.

  • Restoration Pricing & Profit Margins: Operator’s Guide

    Restoration Pricing & Profit Margins: Operator’s Guide

    Restoration pricing is the most misunderstood part of running a restoration company. Owners argue about Xactimate rates, complain about insurance carriers, and chase competitor pricing — while quietly losing money on jobs they think are profitable. The problem isn’t usually the rates. It’s that most restoration companies don’t actually know what their work costs them.

    This guide walks through how restoration pricing actually works in 2026: Xactimate fundamentals, when to use time and material versus fixed bids, where margin leaks happen, what healthy profit margins look like, and the financial math that separates the operators who scale from the ones who stay stuck.

    The two pricing systems restoration uses

    Gloved hands using a pin-type moisture meter on wet drywall during inspection
    The two pricing systems restoration actually uses.

    Almost all restoration work is priced one of two ways. Xactimate pricing dominates insurance work — line items at published unit rates, with regional pricing that updates quarterly, plus overhead and profit added on top. Time and material (T&M) is used for non-insurance work, certain commercial losses, and emergency mitigation where scope is unknown — billed by labor hour and materials at marked-up cost.

    Most restoration companies use both depending on the job. Residential insurance mitigation and reconstruction is almost always Xactimate. Commercial losses with sophisticated buyers often allow T&M or hybrid pricing. Out-of-pocket residential work (mold remediation that isn’t covered, biohazard cleanup, certain reconstruction) is typically T&M or fixed-bid.

    How Xactimate pricing actually works

    Xactimate is a software platform owned by Verisk that contains a database of construction line items priced by region. Each line item has a labor component, a material component, and an equipment component. Pricing updates quarterly and is based on regional cost surveys. The pricing the carrier sees and the pricing you see should be identical — Xactimate is “single price database” for both sides.

    The actual price of a job is the sum of all line items, plus overhead and profit (O&P), typically 10% and 10% (for 21% combined when multiplied), added on top when the job involves three or more trades or specific complexity criteria carriers recognize. Whether O&P is approved is one of the most contested issues in restoration pricing — many carriers and TPAs push back hard, and operators need to know the documentation to defend it.

    Time and material pricing

    T&M pricing bills labor at an hourly rate and materials at a marked-up cost. Healthy restoration T&M rates in 2026 run $75-$110/hour for technicians, $95-$140/hour for lead technicians, and $135-$195/hour for project managers, depending on market and certification level. Material markup typically runs 25-50% over cost. Equipment rental (dehumidifiers, air movers, HEPA filtration) is billed by day at established rates.

    The advantage of T&M is no price disputes — you bill what it actually took. The disadvantage is the customer needs to trust your hours, and you need rigorous time tracking. Without disciplined timekeeping, T&M jobs become arguments about “what could it have possibly taken that long for?”

    The two big places margin gets lost

    Four ascending service-line bars for mitigation, rebuild, contents, specialty
    Where margin gets lost — without sticky dollar stickers.

    Restoration companies don’t lose margin on the rates — they lose it in two specific places. First, missed scope. The job estimate doesn’t capture all the affected materials. The carrier pays the original estimate. The actual work takes longer and uses more material than estimated. Loss.

    Second, weak supplements. When additional damage is discovered (almost always the case in restoration), supplements need to be written, documented, and submitted. Companies with weak estimating and slow supplement processes leave 5-15% of revenue on the table on every insurance job. Companies with disciplined supplement processes capture every dollar of legitimate scope.

    Healthy profit margin benchmarks

    Industry-healthy gross margins by service line: water mitigation 45-60%, reconstruction 25-40%, mold remediation 50-65%, fire and smoke restoration 35-50%, contents cleaning and pack-out 40-55%, commercial large loss highly variable but generally 20-35%. Net margin (after overhead) for a healthy restoration company runs 8-15% of revenue. Companies under 5% net are usually one bad month away from cash crisis. Companies above 18% are either very small, very specialized, or under-investing in growth.

    The job costing discipline most restorers skip

    Six cards covering job margin, cycle time, AR days, utilization, CAC, close rate
    Job costing discipline most restorers skip.

    You cannot manage profit margins you can’t measure. Real job costing means tracking, per job: estimated revenue, actual revenue (including supplements), labor hours and dollars actually spent, material costs actually incurred, equipment days and rental cost, subcontractor cost, and overhead allocation. The output is a per-job gross margin number. Pulling this report monthly and identifying jobs that lost money — and why — is how operators improve pricing over time.

    Most restoration companies skip this because the data is messy and the spreadsheets are painful. The companies that automate it (with restoration-specific software like Restoration Manager, Xactimate, Encircle, or DASH) have a structural advantage that compounds.

    How to handle the “your competitor charges less” objection

    This objection appears constantly. The honest answer: most price differences in restoration are scope differences, not rate differences. Xactimate rates are the same across all contractors in a region — your competitor isn’t using a cheaper Xactimate. They’re either writing less scope, missing items that you’d catch, or planning to supplement aggressively later. Walk the customer through the scope comparison line by line. Often the price gap closes or reverses.

    Pricing strategy by service line

    Water mitigation is almost always Xactimate. The leverage is in writing complete drying chamber configurations, accurate equipment days, and complete demolition scope. Reconstruction is Xactimate with discipline around overhead and profit, change orders, and supplements. Mold remediation can be Xactimate when insurance covers it, T&M or fixed bid when it doesn’t — pricing requires careful scope documentation due to liability. Fire and smoke is Xactimate, with significant supplement opportunity around contents, deodorization, and structural cleaning. Biohazard and trauma cleanup is typically T&M or fixed bid with hazard premiums.

    Related on Tygart Media: Starlink on a water job · S500 in the van · local SEO for restoration.

    Frequently Asked Questions

    How much does water damage restoration cost?

    The national average for residential water damage restoration in 2026 ranges from $1,500 for a small Category 1 (clean water) loss to $40,000+ for a large Category 3 (sewage) loss requiring extensive demolition and reconstruction. Most insurance-covered water mitigation jobs fall in the $3,000-$8,000 range. Pricing is calculated using Xactimate line items based on affected square footage, equipment days, demolition scope, and reconstruction needs.

    What profit margin should a restoration company make?

    Healthy gross margin benchmarks: water mitigation 45-60%, reconstruction 25-40%, mold remediation 50-65%, fire restoration 35-50%, commercial large loss 20-35%. Net margin (after overhead) for a profitable restoration company typically runs 8-15% of revenue. Companies below 5% net margin are at financial risk; companies above 18% are usually small, specialized, or under-investing in growth.

    What is overhead and profit in restoration?

    Overhead and profit (O&P) is typically a 10% + 10% addition on top of the line-item subtotal in Xactimate, applied when a job involves three or more trades or meets carrier complexity criteria. The 10% overhead covers indirect costs like supervision, office, and equipment depreciation; the 10% profit is the contractor’s profit margin. Whether O&P is approved is frequently disputed by carriers and TPAs, and proper documentation is required to defend it.

    Should restoration jobs be priced T&M or Xactimate?

    Insurance work is almost always Xactimate because that’s what carriers will adjust to. Out-of-pocket residential work, certain commercial losses, and unscoped emergency mitigation are often better priced as time and material. The dividing line is typically whether a third-party payer (insurance carrier or TPA) is involved.

    What is the labor rate for restoration technicians?

    Healthy 2026 T&M billing rates: technicians $75-$110/hour, lead technicians $95-$140/hour, project managers $135-$195/hour. These vary by region and certification level. Insurance work uses Xactimate’s regional labor rates rather than billed hourly rates, with the labor component embedded in each line item.

    How do restoration companies make more money on jobs?

    The two highest-leverage activities are complete initial scoping (capturing every affected material in the original estimate) and disciplined supplementing (writing and submitting supplements promptly when additional damage is discovered). Companies with rigorous estimating and supplement processes capture 5-15% more revenue per insurance job than companies that don’t.

  • Xactimate Strategy for Restoration Contractors: 2026 Guide

    Xactimate Strategy for Restoration Contractors: 2026 Guide

    Xactimate is the operating system of insurance restoration in North America. Every major insurance carrier, almost every TPA, and the majority of preferred vendor programs require it. If you can’t write a defensible Xactimate estimate, you can’t run a serious insurance restoration business.

    This guide is the operator-level Xactimate strategy for 2026: how the pricing actually works, the sketch discipline that produces approvable estimates, the supplement workflow that captures the 5-15% of revenue most companies leave on the table, and how to defend your scope when carriers push back.

    What Xactimate actually is

    Gloved hands using a pin-type moisture meter on wet drywall during inspection
    What Xactimate actually is in the claim workflow.

    Xactimate is a software platform owned by Verisk that combines a regional pricing database, a sketch-based scope builder, and an estimating workflow. The pricing database contains line items priced by metropolitan statistical area, updated quarterly based on labor and material cost surveys. Carriers, adjusters, contractors, and TPAs all use the same database, which means there’s no negotiation over rates — only over scope and applicability of line items.

    The product comes in three editions: Xactimate online (X1), the modern web-based version most contractors use today; Xactimate desktop (X28), the legacy desktop client still used in some workflows; and Xactimate mobile, for on-site sketching and photo capture. Most active restoration contractors today work primarily in X1 with mobile capture in the field.

    The Xactimate pricing logic

    Each Xactimate line item has three components: a labor component (the labor cost to perform the task), a material component (the material cost), and an equipment component (rental or use cost). Every line item is priced for a specific region using current local labor rates, material costs from supplier surveys, and equipment rental data. Because the carrier sees the same prices the contractor sees, the rates themselves aren’t disputed — disputes are about scope.

    On top of the line item subtotal, contractors add overhead and profit (typically 10% + 10%) when the job qualifies — historically defined as work involving three or more trades or meeting other complexity criteria. O&P is one of the most contested elements in restoration estimating. Carriers and TPAs frequently push back on it, especially on smaller jobs. Documenting the trade count, complexity, and supervisory burden is how restorers defend it.

    Sketch discipline: the foundation of approvable estimates

    Four steps: phone capture, sketch in Xactimate, review, supplement
    Sketch discipline — the foundation of approvable estimates.

    The single biggest predictor of estimate approval is sketch quality. A clean sketch with accurate room dimensions, properly labeled rooms, correct ceiling heights, openings (doors, windows, cased openings) drawn to scale, and labeled affected materials is approved with minimal questions. A messy sketch — wrong dimensions, missing rooms, unlabeled openings, no notes — generates rejection cycles and supplements.

    The sketch discipline that produces clean estimates: measure every room (laser measurer, then verify), draw to scale at the loss site (don’t sketch from memory back at the office), label every room with its purpose (kitchen, bathroom, master bedroom — not just “Room 1”), draw all openings with width and height, label affected materials room by room (drywall, flooring type, baseboards, ceiling), and capture matching photo documentation tied to each room.

    The estimating workflow that produces complete scope

    Most missed scope in restoration comes from a rushed initial estimate. The disciplined workflow: walk the entire affected area first (don’t start writing scope until you’ve seen everything), photograph every affected room from every corner, identify and document all hidden damage (pull baseboards, lift carpet corners, check behind cabinets, scope the floor structure), document moisture readings on a moisture map, write the scope room by room with photos referenced, then review the estimate against the photo set before submitting.

    This takes longer on the front end. It saves significant time and revenue on the back end because the supplement burden is dramatically lower.

    Supplements: the 5-15% revenue most companies leave on the table

    Clipboard and tablet on a kitchen counter during an insurance adjuster walkthrough after water loss
    Supplements — revenue most companies leave on the table.

    Supplements are revisions to the original estimate when additional damage is discovered, scope changes, or items were missed. In legitimate restoration work, supplements are normal — almost every job will have at least one. Companies with weak supplement processes leave 5-15% of revenue on the table on every insurance job. Companies with disciplined supplement workflows capture every dollar of legitimate scope.

    The supplement workflow that works: document the additional damage with photos and notes immediately upon discovery, write the supplement in Xactimate within 48 hours, submit through the proper channel (carrier portal, adjuster email, TPA system), follow up on approval status weekly, and track every supplement to closure. Supplement revenue should appear on the job costing report alongside original revenue so you can measure the discipline.

    Defending scope against pushback

    Adjusters and TPAs push back on scope routinely — sometimes legitimately, sometimes reflexively. The defense is documentation. For each contested line item: photo evidence of the affected material, moisture readings or other measurable damage indicators, IICRC standard reference (S500 for water, S520 for mold, S700 for fire, S800 for HVAC), and clear notes about why the scope is necessary. A line item with photos and a standard reference is hard to dismiss. A line item with no documentation is dismissed routinely.

    The Xactimate certifications that matter

    Xactimate offers user certification at three levels: Level 1 (basic functionality), Level 2 (advanced sketch and estimating), and Level 3 (advanced supplements, complex scope, dispute resolution). Level 1 should be a minimum requirement for any estimator at a restoration company. Level 2 is appropriate for senior estimators and project managers. Level 3 is the standard for owners, lead estimators, and anyone who handles disputed scope.

    Common Xactimate mistakes that cost real money

    The most common margin-killing mistakes: using regional default rates instead of pulling current quarterly pricing, missing equipment days on water mitigation jobs, failing to add proper drying chamber configuration, forgetting matching where required by IICRC standard, missing demolition scope on Cat 3 losses, not adding cleaning of unaffected areas where smoke or odor migrated, missing contents pack-out and cleaning, and submitting estimates without overhead and profit when they qualify.

    Related on Tygart Media: Starlink on a water job · S500 in the van · local SEO for restoration.

    Frequently Asked Questions

    How does Xactimate pricing work?

    Xactimate pricing is built from a regional database of line items, each containing labor, material, and equipment cost components. Pricing updates quarterly based on local cost surveys. Both contractors and carriers use the same pricing database, so disputes are about scope (which line items apply) rather than rates (what each line item costs).

    How much does Xactimate cost?

    Xactimate online (X1) subscription costs vary based on tier and seat count, with most restoration contractors paying $200-$500/month per seat. Xactimate mobile is typically included or available as an add-on. Pricing changed significantly with the move to X1 — contractors should request a current quote directly from Verisk.

    What is overhead and profit in Xactimate?

    Overhead and profit (O&P) is typically a 10% + 10% addition applied on top of the line-item subtotal when a job involves three or more trades or meets other complexity criteria. The 10% overhead covers indirect costs like supervision and office burden; the 10% profit is the contractor’s profit on the work. O&P is frequently disputed by carriers and requires documentation to defend.

    How do you write a Xactimate supplement?

    The disciplined supplement workflow: document additional damage with photos and notes upon discovery, write the supplement in Xactimate within 48 hours, submit through the proper channel (carrier portal, adjuster email, TPA system), follow up on approval status weekly, and track every supplement to closure. Companies with disciplined supplement processes capture 5-15% more revenue per insurance job.

    Do I need Xactimate certification to be a restoration contractor?

    You don’t need certification to use Xactimate, but most TPAs and many carriers require certified users on the account, and certification is increasingly the norm for any serious estimating role. Level 1 is a baseline; Level 2 or 3 is appropriate for owners, lead estimators, and dispute handlers.

    How do I dispute a Xactimate estimate?

    Disputes are won with documentation: photo evidence of the affected material, moisture readings or measurable damage indicators, IICRC standard references (S500, S520, S700, S800), and clear notes explaining why the scope is necessary. The most common adjustment requests succeed when supported by IICRC standards and visual evidence; unsupported requests are dismissed routinely.

  • IICRC Certification: 2026 Restoration Training Guide

    IICRC Certification: 2026 Restoration Training Guide

    Updated October 2026.

    Certification matters more in restoration than in most trades. Insurance carriers, TPAs, commercial buyers, and many state regulators look for IICRC credentials as the baseline trust signal. A restoration company with no certifications can do residential cash work; a company with a credentialed team can win commercial accounts, qualify for preferred vendor programs, and defend scope against challenge. The stakes keep rising: Mordor Intelligence puts the global disaster restoration services market at $45.2 billion in 2026, growing toward $60 billion by 2031 — and carriers increasingly channel that work to credentialed firms.

    This is the complete guide to IICRC certifications and restoration training in 2026: which certifications actually matter for which roles, the realistic path for a new technician, what each course costs and covers, and how to build an in-house training program that turns new hires into productive technicians in 90 days instead of nine months.

    How to get IICRC certified: the exact steps

    IICRC certification is the industry’s credential for individual technicians and firms — earned by completing an approved course and passing a standardized exam. There are no formal prerequisites for entry-level courses: you register, take the course, and sit the exam.

    1. Pick your certification. WRT (Water Damage Restoration Technician) first if you touch water losses — it’s the baseline everything else stacks on.
    2. Take an IICRC-approved course. Most run three days. Two exceptions: ASD (Applied Structural Drying) and AMRT (Applied Microbial Remediation Technician) must be taken in person — the IICRC hasn’t approved them for online delivery because of the hands-on elements. Everything else is available in person or live-stream.
    3. Register for the exam and pass it. The exam is multiple-choice and closed book; question count and time limit vary by course. The passing score is 75%. The IICRC exam fee is $80 ($150 for AMRT and inspection exams), paid before you sit. If you take a live-stream course, you complete the exam online through the IICRC exam portal within 45 days of the class ending; in-person students take it on the last day of class. Fail it and you get two more attempts (each costs another exam fee) — fail three times total and you have to retake the course before testing again.
    4. Get your credentials. After you pass, the IICRC takes 4–6 weeks to process and issue the certification, then mails your certificate, wallet card, and patch (allow another 7–10 business days for delivery).
    5. Stay current. Certification stays valid as long as you maintain it: an annual renewal fee to the IICRC plus 14 Continuing Education Credits (CECs) every four years for technicians. (Inspectors and master-designation holders need 14 CECs every two years.) Renewal fees run roughly $46–$70/year depending on how many certifications you hold — AMRT is $72/year, a master designation adds $12/year, and certified firms pay $199/year. The IICRC sets these fees and adjusts them, so confirm current numbers at iicrc.org before you budget.

    What the IICRC actually is

    Five-step van pocket flow: category, class, extract, dry, document
    What the IICRC actually is.

    The Institute of Inspection, Cleaning and Restoration Certification (IICRC) is the standards-setting and certification body for the cleaning, inspection, and restoration industry. Founded in 1972, it publishes the technical standards that govern the industry — most notably S500 (water damage), S520 (mold), S540 (trauma and crime scene), S700 (fire and smoke), and S800 (HVAC) — and certifies individuals and firms in specific competencies.

    IICRC certifies individual technicians through course completion and exam, and certifies firms through documentation of insurance, technician credentials, and adherence to standards. Firm certification is what most insurance carriers and commercial buyers actually look for on vendor applications.

    The IICRC certifications that matter for restoration

    The certifications that should be on every restoration company’s checklist:

    WRT (Water Damage Restoration Technician) — the foundational water mitigation certification. Three-day course covering water categories, drying science, equipment use, and the S500 standard. This is the absolute minimum for any technician handling water losses. Most companies require WRT within 60-90 days of hire.

    ASD (Applied Structural Drying) — the advanced drying certification. Builds on WRT with deeper coverage of psychrometry, drying chamber configuration, equipment sizing, and complex drying scenarios. Standard for lead technicians and project managers.

    AMRT (Applied Microbial Remediation Technician) — the mold remediation certification. Covers S520 standard, containment design, PPE, work practices, and post-remediation verification. Required for any contractor performing mold remediation work; often required by state regulators in mold-licensed states.

    FSRT (Fire and Smoke Restoration Technician) — fire and smoke damage certification. Covers smoke types, deodorization, contents cleaning, and structural restoration after fire losses. Important for any contractor handling fire work.

    OCT (Odor Control Technician) — focused certification on odor identification and removal techniques. Useful for technicians and project managers handling fire, sewage, biohazard, and HVAC remediation.

    HST (Health and Safety Technician) — covers OSHA compliance, PPE selection, hazard assessment, and crew safety practices. Recommended for project managers and crew leaders.

    UFT (Upholstery and Fabric Cleaning Technician) and CCT (Carpet Cleaning Technician) — for contents cleaning and carpet cleaning operations. Standard for contents departments.

    CCMT (Commercial Carpet Maintenance Technician) — relevant for commercial restoration operations with maintenance contract work.

    TCST (Trauma and Crime Scene Cleanup Technician) — for biohazard and trauma cleanup divisions. Required by some state regulators.

    WRT-Master, ASD-Master, AMRT-Master designations — the highest individual certifications, requiring multiple credentials, hours of field experience, and additional examination.

    The certifications at a glance:

    CertificationWhat it coversWho needs itCourse lengthExam fee
    WRTWater mitigation, drying science, S500Every water tech — the baseline3 days$80
    ASDAdvanced drying, psychrometry, drying chambersLead techs, project managers3 days, in-person only$80
    AMRTMold remediation, containment, S520Mold contractors; required in mold-licensed states3 days, in-person only$150
    FSRTFire/smoke damage, deodorization, contentsFire restoration crews3 days$80
    OCTOdor identification and removalFire, trauma, contents techs3 days$80
    HSTOSHA compliance, PPE, crew safetyProject managers, crew leaders3 days$80
    CCT / UFTCarpet, upholstery and fabric cleaningContents departments3 days$80
    TCSTTrauma and crime scene cleanupBiohazard divisions3 days$80

    Which certifications does your technician actually need?

    Pick the role. Get the exact certification sequence, timeline, and budget — no guesswork.

    Costs are typical 2026 all-in figures (course + exam + travel). IICRC exam fees: $80 standard, $150 AMRT. Confirm current pricing with your training provider and at iicrc.org.

    The path from new hire to credentialed technician

    Restoration technicians training in a shop bay with equipment demo and whiteboard
    Path from new hire to credentialed technician.

    A realistic 12-month path for a new restoration technician: Days 1-30 — shadow experienced technicians, complete OSHA 10 and basic safety orientation, learn equipment handling. Days 31-90 — complete IICRC WRT certification (three-day course plus exam), begin running mitigation jobs as second tech under supervision. Days 91-180 — complete ASD or FSRT depending on focus area, begin running smaller jobs as lead. Days 181-365 — complete AMRT (if mold work), additional specialty certifications based on role, eligibility for lead technician promotion.

    Companies that compress this timeline (six-month path to fully certified lead tech) usually do it by combining IICRC courses with rigorous in-house training, structured ride-alongs, and weekly skill assessments.

    The Certification Roadmap: Basic Technician to Commercial Large-Loss Specialist

    Residential work starts with one certificate. Commercial large-loss work — the kind property managers and TPAs hand to credentialed firms — sits at the far end of this road. Here is the whole journey.

    1
    Foundation · Months 0–3
    WRT
    Unlocks: legal water-mitigation work, residential jobs, the prerequisite for everything above.
    2
    Lead Technician · Months 3–12
    ASDFSRTHST
    Unlocks: running jobs unsupervised, the fire division, crew safety leadership.
    3
    Specialist · Year 1–2
    AMRTOCTCCT / UFT
    Unlocks: mold remediation, high-margin contents and odor work.
    4
    Commercial · Year 2–3
    CDS
    IICRC Commercial Drying Specialist — 4–5 day advanced course (prerequisite: active WRT). Commercial construction, project management, mechanical systems, large-project administration.
    Unlocks: commercial, industrial, and institutional work — the jobs residential-only shops cannot bid.
    5
    Authority · Year 3+
    RIA Certified Restorer (CR)
    The Restoration Industry Association’s highest designation — pillar designations, prep course and exam, plus a peer-reviewed formal report. Fewer than 600 people have earned it since 1976.
    Unlocks: large-loss program work, TPA national accounts, expert-witness credibility. (IICRC Master designations are the parallel pinnacle on the IICRC track.)

    CDS is an IICRC certification; the Certified Restorer (CR) is awarded by the Restoration Industry Association (RIA). Confirm current prerequisites and pricing at iicrc.org and restorationindustry.org.

    In-house training programs: building beyond IICRC

    Restoration SOP clipboard with checklist, moisture meter, and gloves on a jobsite table
    In-house training beyond IICRC.

    IICRC certification is the baseline. The companies that consistently outperform have in-house training programs that fill the gaps. The components of a real in-house program:

    Onboarding curriculum — week one orientation covering company processes, equipment handling, safety, and customer interaction expectations. Weekly skills training — 30-60 minute sessions on specific topics: drying chamber setup, content pack-out procedures, moisture mapping, customer communication scripts. Quarterly cross-training — rotating technicians across service lines so the team has bench depth. Annual recertification — refresher training on IICRC standards updates, new equipment, and procedural changes. Mentor pairing — every new technician paired with an experienced lead for the first 90 days.

    Training cost: what to budget

    Realistic 2026 cost per new restoration technician: WRT certification $700-$1,000 (course + exam + travel), ASD $700-$1,000, AMRT $800-$1,200, FSRT $700-$1,000, plus 40-80 hours of paid in-house training time. Total first-year investment per technician: $3,000-$8,000 depending on path. Companies often recoup this within a few months through improved productivity and reduced supervision burden.

    Training providers worth knowing

    Restoration training providers fall into three categories. IICRC-approved training schools deliver the certification courses themselves — Restoration Sciences Academy, IICRC-approved regional providers, and online options through providers like KEY Restoration. Industry consultants and coaches deliver advanced training in estimating, sales, operations, and leadership — Violand Management, GrowthWerks, Performance Restoration, and several others. Manufacturer training from equipment vendors like Phoenix Restoration Equipment, Drieaz, and chemical suppliers covers product-specific operations.

    Related on Tygart Media: Starlink on a water job · S500 in the van · local SEO for restoration.

    Frequently Asked Questions

    What is IICRC certification?

    IICRC (Institute of Inspection, Cleaning and Restoration Certification) is the industry standards-setting and certification body. It publishes the technical standards (S500 for water, S520 for mold, S700 for fire) and certifies both individual technicians and restoration firms in specific competencies. Insurance carriers, TPAs, and commercial buyers commonly require IICRC credentials.

    How much does IICRC certification cost?

    Individual IICRC certification courses typically run $700-$1,200 each, including course materials, the exam, and exam administration. Travel and lodging (when courses are in-person) add to the total. Online and hybrid options are increasingly available at lower cost. Annual maintenance fees apply to keep credentials active.

    What IICRC certifications do restoration technicians need?

    The baseline for any water mitigation technician is WRT (Water Damage Restoration Technician). Lead technicians typically add ASD (Applied Structural Drying). Companies handling mold work require AMRT (Applied Microbial Remediation Technician). Fire restoration adds FSRT (Fire and Smoke Restoration Technician). Specialty roles add OCT, HST, TCST, and others as needed.

    How long does IICRC certification take?

    Most individual IICRC courses are three days of in-class instruction followed by a written exam. Some courses are available in compressed two-day or hybrid formats. From start to certified takes one to four weeks depending on exam scheduling. The full certification path (multiple credentials) for a senior technician usually spans 6-18 months.

    What is the difference between IICRC certification for individuals and firms?

    Individual IICRC certification is earned by a single technician completing a course and exam. Firm certification is earned by a company that documents insurance coverage, employs a minimum number of certified technicians, agrees to abide by the IICRC code of ethics, and participates in customer complaint resolution. Firm certification is what most carriers and commercial buyers look for on vendor applications.

    Where can I take IICRC courses?

    IICRC courses are delivered by approved training schools across the US and internationally. Major providers include Restoration Sciences Academy and various regional IICRC-approved schools. Many manufacturers and equipment vendors also offer IICRC-approved training. The IICRC website maintains an updated list of approved providers.

    What is the passing score for the IICRC exam?

    75%. IICRC exams are multiple-choice and closed book. If you don’t pass, you can retake the exam up to two more times (each attempt costs another exam fee) — after three failed attempts you must retake the course before testing again.

    How do I keep my IICRC certification active?

    Pay the annual IICRC renewal fee and earn 14 Continuing Education Credits (CECs) every four years (technicians) or every two years (inspectors and master-designation holders). CECs come from IICRC-approved courses, industry events, or earning an additional certification. If your certification lapsed less than 24 months ago, contact IICRC renewals to reinstate it; beyond 24 months goes through a separate reinstatement process.

    How can I verify someone’s IICRC certification?

    Ask for their certification number and check it against the IICRC’s public “Locate a Certified Professional” directory. For firms, ask for proof of current Certified Firm status — that’s the credential carriers and commercial buyers actually check on vendor applications.

    THE RESIDENTIAL-TO-COMMERCIAL BRIDGE · PART 1 OF 3

    Training: earn the certifications commercial work demands

    Commercial property managers don’t hire uncertified firms. This page mapped the road from WRT to the CDS and the RIA Certified Restorer — the credentials that open commercial and large-loss work. Next step: make sure your back office can survive program work.

    Part 2: Compliance — the TPA Readiness Checklist →

    Part 3: Marketing — from residential clicks to commercial networking →

  • Restoration Software 2026: Choosing ERPs, CRMs & Tools

    Restoration Software 2026: Choosing ERPs, CRMs & Tools

    The restoration software landscape in 2026 has consolidated into four recognizable categories. The wrong choice will cost a restoration operator three to five years of integration debt. The right one will quietly compound margin and visibility for the same period.

    This is a buyer’s framework, not a vendor ranking. Vendor names move quickly in this market through acquisition and rebranding. The categories below are stable, and the selection criteria are durable.

    The Four Categories of Restoration Software in 2026

    Three cards for field SOPs, owner prompts, and KPI rhythm in an operations kit
    The four categories of restoration software in 2026.

    When operators talk about “restoration ERP” or “restoration sales software,” they are usually referring to one of four distinct categories that solve different problems:

    • End-to-end restoration ERPs — single platforms covering CRM, job management, scheduling, estimating, photo documentation, accounting integration, and reporting. The dominant choice for shops above roughly $5M revenue that want one system of record.
    • Sales-focused CRMs — platforms purpose-built for the commercial cultivation cycle, account mapping, and sales-pipeline management. Often paired with a separate job-management tool.
    • Job-management platforms — systems focused on the production side: dispatch, technician documentation, customer signatures, estimating, photo capture. The dominant choice for shops where production discipline drives the business.
    • Best-of-breed point tools — moisture mapping, photo documentation, equipment tracking, communication, scheduling — each from a separate vendor, integrated through APIs or middleware.

    The first selection question is which category fits the shop, not which vendor. Most software regret in the restoration industry comes from buying a vendor in the wrong category for the operating model.

    How to Choose the Right Category

    The right category is a function of revenue scale, operating model, and growth direction. A working framework:

    • Under $2M revenue, residential-led: a job-management platform plus a basic CRM is usually sufficient. Full ERP is overhead the shop cannot absorb.
    • $2M to $5M revenue, mixed residential and commercial: a job-management platform with a strong sales module, or an ERP with a clear sales workflow. The decision tilts on commercial growth ambition.
    • Above $5M revenue, multi-location or commercial-led: end-to-end ERP becomes the practical choice. The cost of stitching point tools together exceeds the cost of the ERP.
    • Heavy commercial sales motion: a dedicated sales CRM is often added regardless of the production platform, because commercial cultivation requires functionality production-led platforms do not prioritize.

    The Six Selection Criteria That Actually Matter

    Three panels showing one problem, three options, one recommendation
    The six selection criteria that actually matter.

    Vendor demos make every platform look comparable. The differentiators show up in production. The six criteria that separate platforms operators stay on from platforms operators leave within 24 months:

    1. Documentation discipline. Does the platform enforce the documentation standard your insurance work requires, or does it allow technicians to skip critical fields? The IICRC S500 2026 documentation expectations make this non-negotiable.
    2. Estimating integration. Does the platform connect to the estimating tool your shop uses (Xactimate, Symbility, or alternatives) without a manual re-key? A re-key step is where margin leaks.
    3. Accounting integration. Does the platform write clean records into QuickBooks, Sage, or NetSuite? Without this, your controller is rebuilding the books every month.
    4. Mobile reliability. Does the technician-facing app work on a job site with intermittent connectivity? Field-side reliability is the most common reason adoption stalls.
    5. Sales pipeline depth. If you have a commercial sales motion, does the platform support named accounts, multi-contact account mapping, and stage-based cultivation? Most production-led platforms do not.
    6. Reporting and forecasting. Can ownership see revenue forecast, gross margin by job type, and sales pipeline in one view, or are these stitched together in spreadsheets?

    The Hidden Cost: Implementation

    The license fee is rarely the largest cost of restoration software. Implementation, data migration, and the productivity dip during the cutover typically run 1.5x to 3x the first-year subscription cost. Operators who underestimate this number end up on the platform without ever fully implementing it, which produces the worst possible outcome — paying for software no one trusts.

    The mitigations are well known: dedicate an internal champion who owns the rollout, plan for a 90-day cutover with parallel operation, and stage the implementation by department rather than going live everywhere at once.

    The AI Question

    Three stacked layers: chat UI, tools, agent runtime
    The AI question.

    Every restoration software vendor in 2026 is shipping AI features — automated photo tagging, voice-to-documentation, sketch generation from job photos, and project estimation assistance. The honest assessment is that the AI features that hold up in production are the ones that automate documentation entry, not the ones that promise to “do estimating for you.” Operators evaluating platforms in 2026 should weight the AI features by their effect on technician documentation discipline, not by demo polish.

    Switching Costs Are Real

    The cost of switching restoration platforms after 18 months on one is high — historical job data, customer records, and team training all get disrupted. This argues for thorough selection, not for paralysis. Most operators who report regretting their software choice cite either rushing the decision or buying for a future state of the business that never arrived. A platform that fits the next 18 months and is extensible into the next 36 is a better choice than the perfect platform for a future that may not happen.

    Related on Tygart Media: Xactimate integrations · Xactimate pricing · marketing stack.

    Frequently Asked Questions

    What is the difference between a restoration ERP and a job-management platform?

    An ERP covers the full operating system of the business — CRM, sales, job management, accounting integration, reporting — in one platform. A job-management platform focuses on the production side — dispatch, technician documentation, estimating, photo capture — and typically pairs with a separate CRM and accounting system.

    When should a restoration company invest in a dedicated sales CRM?

    When the commercial sales motion requires named-account cultivation, multi-contact account mapping, and stage-based pipeline management at a depth that production-led platforms do not support. Shops with serious commercial growth ambition typically run a dedicated sales CRM regardless of their production platform.

    How much should I budget for restoration software in 2026?

    License fees vary widely, but a working budget for a mid-sized restoration operation is 1% to 3% of revenue for software, with implementation and training adding 1.5x to 3x the first-year subscription cost in year one. The total software stack typically replaces a measurable amount of administrative labor, so the net cost is usually lower than the gross spend.

    Should I integrate AI tools into my restoration software stack?

    The AI features that hold up in production in 2026 are the ones that automate documentation entry — photo tagging, voice-to-documentation, sketch generation. AI features that promise to replace estimating or scoping judgment are not yet reliable enough to depend on. Evaluate AI by its effect on technician discipline, not demo polish.

    How long does a restoration software implementation take?

    A realistic implementation runs 90 days for a mid-sized restoration operation, with parallel operation against the legacy system for the first 30 to 60 days. Compressing the timeline below 60 days typically produces an incomplete implementation that erodes platform trust within the first year.

    For more on the technology layer of running a restoration business, see Restoration Tech Playbooks.