Tag: Commercial Restoration

  • When to Exit a TPA Program: The Restoration Operator’s Decision Framework

    When to Exit a TPA Program: The Restoration Operator’s Decision Framework

    Exiting a TPA program is one of the highest-stakes decisions a restoration company makes. Done well, it frees capacity for higher-margin work and reduces concentration risk. Done badly, it creates a 6-12 month revenue valley that’s hard to recover from. This is the operator’s decision framework.

    The four signals that say “exit”
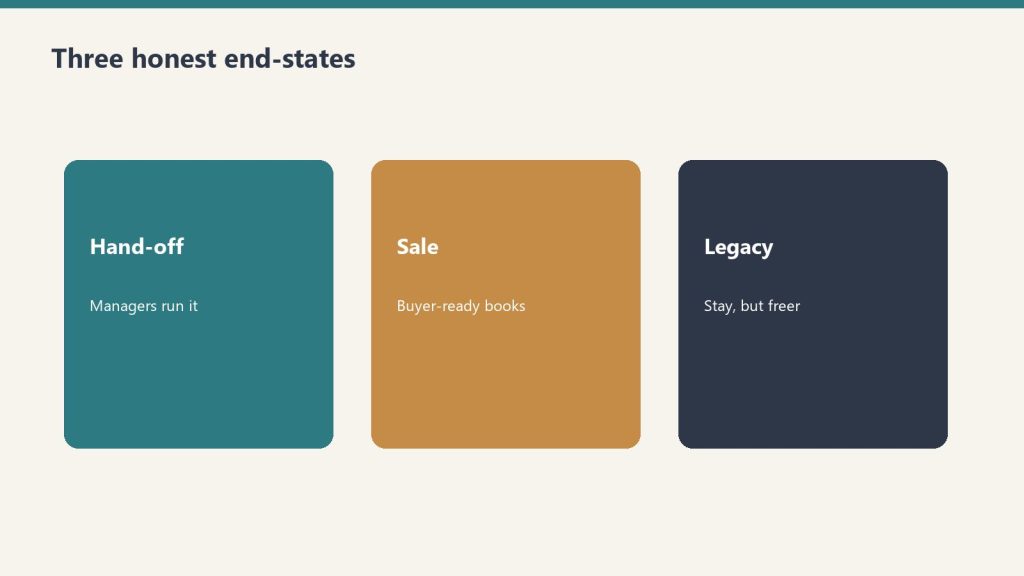
    1. Financial signal: the math doesn’t work anymore

    Run the unit economics on the TPA channel honestly. Total program revenue ÷ true gross margin (after equipment rental haircuts, supplement rejections, and program fees) ÷ time spent. If the effective margin is below 25% gross or the operating cost is materially higher than your other channels, the program is subsidized work.

    A common pattern: contractors stay in marginally-profitable programs because the volume feels reassuring — even when that volume is consuming capacity that could be deployed at 40%+ gross elsewhere.

    2. Performance signal: scores you can’t recover

    Every TPA scores contractors on cycle time, customer satisfaction, scope adherence, documentation, and re-open rate. If your scores are sustained low for 2-3 consecutive quarters and you’ve already invested in the obvious fixes (training, software, dispatcher), the program is no longer a fit operationally. Continuing to take throttled assignments at degraded scores is a slow exit anyway — better to make it intentional.

    3. Strategic signal: concentration risk over 40%

    If a single TPA represents over 40% of total revenue, the program owns your business — not the other way around. Exit doesn’t have to be immediate; intentional dilution over 12-18 months as other channels grow is usually the better playbook. But the strategic decision to reduce dependency should be made consciously.

    4. Relationship signal: the relationship has soured

    Sometimes the program team changes, the rules tighten without compensation, or the carrier relationships you cared about leave the program. If the relationship feels adversarial across multiple touchpoints for multiple months, the program is an unhappy fit and exit is usually right.

    The honest cost of exit
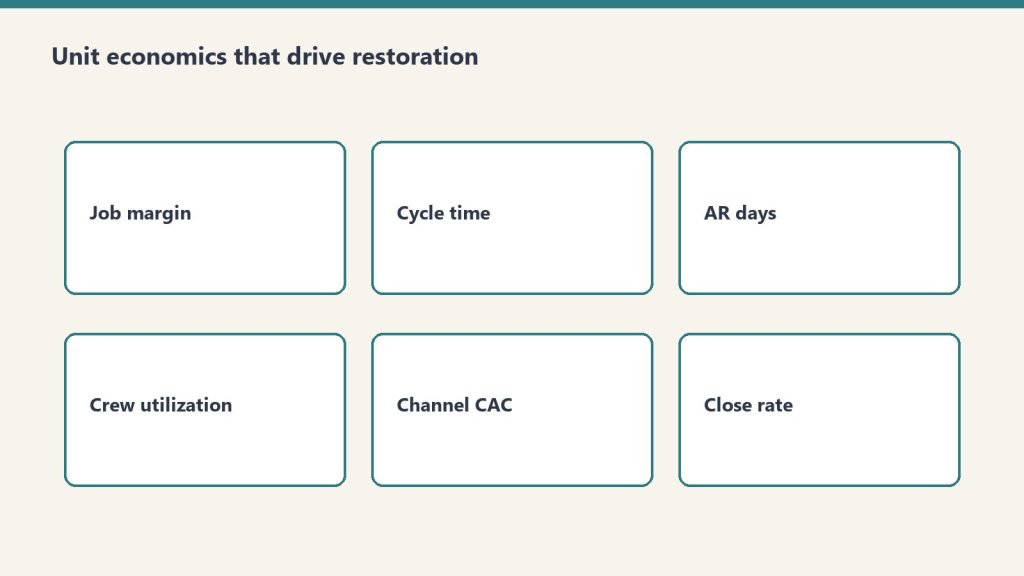
    Most operators underestimate the revenue valley that follows a TPA exit:

    • Months 1-3 post-exit: Existing assignments wind down. Revenue from the program drops to near zero by month 3.
    • Months 3-9: Other channels (direct, cash, plumber, commercial) have to fill the gap. They will, but slower than expected.
    • Months 9-18: Net revenue typically recovers to pre-exit level, often at higher margin.

    If you cannot survive a 30-40% revenue dip for 4-6 months, do not exit yet. Build the replacement channels first.

    The transition plan
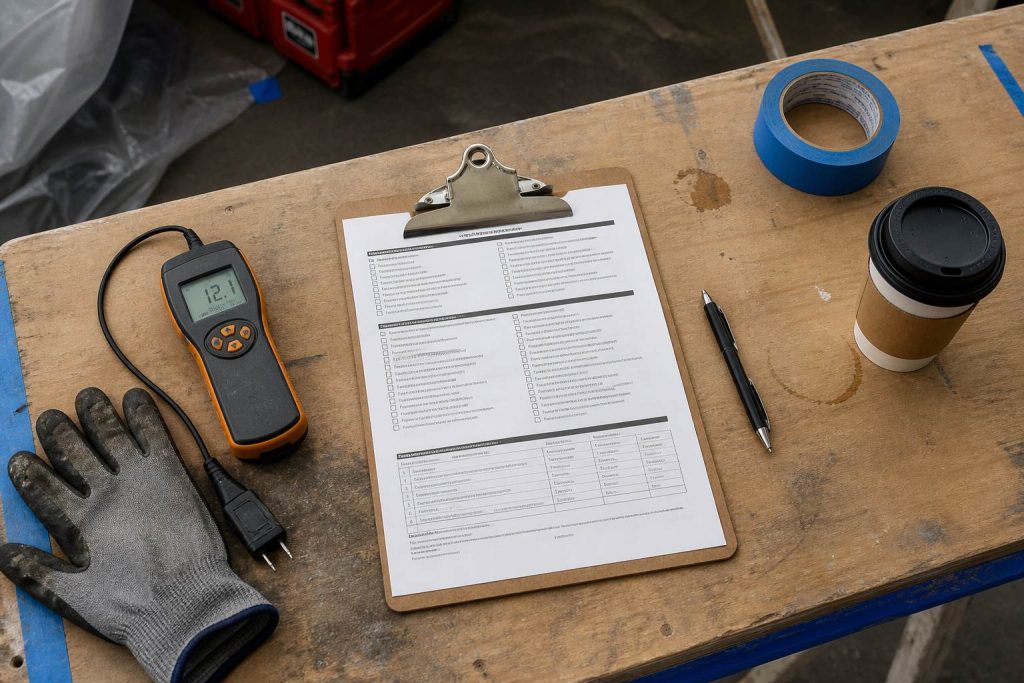
    1. Months -12 to -6: Aggressively grow non-TPA channels. Plumber referral push. Property management contract pursuit. Direct carrier vendor outreach. Cash channel marketing.
    2. Months -6 to -3: Tighten what you accept from the TPA — only the highest-margin assignments. Let scores naturally throttle volume.
    3. Month 0: Send formal exit notice per program contract terms. Do not burn the relationship — exit professionally.
    4. Months 1-6: Execute on the channels you built. Track weekly revenue by channel. Adjust marketing spend toward whatever’s working.
    5. Months 6-12: Stabilize the new mix. Document what worked. Update the org chart and capacity plan to the new revenue shape.

    Re-enrollment realities

    Exiting and re-enrolling later is harder than staying. Most TPAs require a fresh application process for re-enrolling contractors, including financial review, insurance re-verification, and capacity assessment. Plus, the program team remembers contractors who left — sometimes positively, sometimes not. Treat exit as a 3-5 year decision, not a 6-month one.

    Partial exit is also an option

    You don’t always have to exit fully. Many TPAs let you reduce service area, restrict service types, or pause specific carrier programs. A partial exit can preserve optionality while reducing exposure.

    FAQs about exiting TPA programs

    How do I know if a TPA is actually unprofitable?

    Pull 12 months of program revenue. Subtract direct labor, materials, equipment cost (real, not Xactimate-priced), supplement losses, and an allocated share of overhead and admin time spent on program-specific tasks. If the result is below 20% gross profit or your operating cost is higher than your other channels, the program is subsidized.

    What’s the right notice period for exit?

    Whatever your contractor agreement specifies — usually 30-90 days. Honor it precisely. Sloppy exits damage your reputation across the broader TPA and carrier industry, which is smaller than it looks.

    Can I keep some carriers within the program but drop others?

    Sometimes. Some TPAs allow carrier-specific opt-outs; others treat program enrollment as all-or-nothing. Ask explicitly during your exit conversation — you may have more flexibility than the contract suggests.

    How do I tell my team we’re exiting?

    Be direct about why and what changes operationally. The honest version: “We’ve decided this program isn’t a fit anymore — here’s what we’re replacing it with and how the next 6-12 months will look.” Anxiety on the production team kills morale faster than the actual revenue impact.

    What if I exit and revenue doesn’t recover?

    That outcome usually means the replacement channels weren’t built before exit. The fix is rarely re-enrolling in the program you left — it’s doubling down on plumber referrals, direct carrier outreach, property management contracts, and cash channel marketing. Six months of focused channel building usually closes the gap.

    Full insurance programs framework: Restoration Insurance Programs Master Guide.


  • Restoration Leadership Development: Building Crew Leads, PMs, and Operations Managers Internally

    Restoration Leadership Development: Building Crew Leads, PMs, and Operations Managers Internally

    Restoration is a difficult industry to recruit leaders into from outside. The combination of technical depth, customer-facing pressure, insurance navigation, and operational complexity is hard to teach, and the candidates who can do all four are rarely on the job market. The companies that scale successfully build their crew leads, project managers, and operations managers from inside the team — and the companies that try to hire those roles externally typically learn this the expensive way.

    This guide is part of our broader restoration training and certification master guide.

    The Three Internal Leadership Levels

    Restoration leadership progression generally moves through three layers:

    • Crew Lead — leads a 2-3 person crew on a specific job, accountable for execution quality and documentation
    • Project Manager — owns multiple jobs at once, manages customer relationships, signs off on estimates and scope
    • Operations Manager — owns the production function across all jobs, manages PMs, sets standards, drives metrics

    Each layer has different skill requirements, and promoting a strong crew lead directly to PM (skipping the development steps) is one of the most common reasons internal leadership pipelines fail.

    Identifying Leadership Candidates Early

    The leading indicators of leadership potential in restoration techs are not the obvious ones. They are: communication clarity with customers under stress, willingness to slow down for documentation, comfort with ambiguity in scope decisions, ability to coach less-experienced techs without ego, and ownership of the outcome on jobs they did not start. Technicians who consistently demonstrate these behaviors are the right development pool.

    Identification should happen by month 6-12 of tenure. Owners who wait until they need a leader to start identifying candidates always end up either hiring externally (expensive, slow) or promoting too quickly (sets the candidate up to fail).

    The Crew Lead Development Path

    Moving a strong technician to crew lead requires explicit skill development beyond technical capability. Core curriculum areas: leading a brief and debrief on every job, customer communication frameworks, conflict resolution with crew members, documentation standards as a checklist owner rather than a participant, and basic scope decision authority within defined boundaries.

    Most companies underspend on this development step. The right investment is structured: weekly check-ins with the operations manager during the first 90 days as crew lead, mentor pairing with an experienced PM, and explicit scope-of-authority documentation so the new crew lead knows what they can decide without escalating.

    The Project Manager Development Path

    Project manager is the role where most internal promotions break down, because the skill jump from crew lead to PM is larger than it appears. PMs manage multiple concurrent jobs, own customer relationships across job types, sign off on estimates with real dollar consequences, and coordinate across crews.

    The development curriculum needs to cover: estimating literacy beyond field execution (this is where Xactimate certification matters), insurance and TPA program navigation, multi-job time management and prioritization, financial literacy on margin and gross profit, and team-leadership skills that scale beyond a single crew.

    The realistic timeline from crew lead to capable PM is 12 to 24 months of structured development. Compressing below 12 months produces PMs who can manage the schedule but cannot defend pricing or coach their crews.

    The Operations Manager Development Path

    Operations manager is the role that almost has to be developed internally, because the role requires deep knowledge of how the specific company operates. The development curriculum at this level shifts toward systems thinking, financial accountability for the production function, vendor and program management, hiring and retention strategy, and strategic planning alongside ownership.

    This level typically requires 2-4 years of PM experience as a foundation, plus structured executive development through industry programs, peer groups, or formal coaching.

    Leadership Development Programs to Consider

    Several restoration industry organizations offer formal leadership development: RIA (Restoration Industry Association) offers leadership programming through its conferences and CCT-level certifications, RTI (Restoration Training Institute) and others run multi-day leadership programs, and several private coaches and mastermind groups serve restoration owners and PMs specifically. Combining internal development with external programs accelerates the trajectory.

    What to Pay Internal Leadership

    Compensation for internal leadership should reflect both the skill premium and the difficulty of replacement. Crew leads typically earn 15-25 percent above lead tech base, PMs typically earn 30-50 percent above crew lead base, and operations managers typically earn 50-100 percent above PM base. Bonus structures tied to gross margin and customer satisfaction reinforce the right behaviors at each level.

    Frequently Asked Questions

    How long does it take to develop a restoration crew lead from a strong technician?

    The realistic timeline is 6 to 12 months of structured development beyond the technical skills the technician already has. Faster promotions consistently produce crew leads who default back to technician behaviors when the leadership demands intensify.

    Should I hire a project manager from outside or develop one internally?

    Develop internally whenever possible. External PM hires from inside the restoration industry are rare and expensive; external hires from outside the industry almost universally fail because the technical and insurance literacy cannot be learned fast enough. The 12-24 month internal development path is more reliable than the external hiring path.

    What is the most common reason internal leadership development fails?

    Promoting too fast. A strong technician promoted directly to PM without the structured development steps fails not because the candidate lacks potential but because the role demands skills they have not yet been taught. The fix is structured development with explicit milestones rather than ad hoc promotions.

    What metrics should I use to evaluate leadership readiness?

    For crew leads: customer satisfaction scores on jobs they led, callback rate, documentation completeness. For PMs: gross margin on managed jobs, customer retention, crew retention under their leadership. For operations managers: production function gross margin, crew retention rate, capacity utilization. Quantitative metrics protect against subjective bias in promotion decisions.

    Should leadership development be funded from the training budget or treated as overhead?

    It should be a deliberate line item in the training budget, with a target spend per leader per year. Treating leadership development as overhead almost guarantees it will be cut during slow periods, which is exactly when the investment matters most.


  • Water Damage Restoration Pricing: How Smart Operators Build Estimates That Get Paid

    Water Damage Restoration Pricing: How Smart Operators Build Estimates That Get Paid

    Water damage restoration pricing is where most operators bleed the most money — not because they charge too little on the headline number, but because they miss line items, mis-categorize equipment, and accept reductions they could have defended. This guide walks through the pricing framework profitable restoration companies use for both insurance and cash water jobs.

    If you have not worked through the full pricing playbook yet, start with our restoration pricing and estimating master guide to understand how water pricing fits into the larger estimating system.

    Why Water Damage Pricing Is Different

    Water damage is the highest-volume and highest-frequency loss type for most restoration companies, which makes it the line where pricing discipline pays the biggest compounding return. Unlike fire or mold, water jobs are highly repeatable, which means small per-job pricing improvements multiply across hundreds of jobs per year.

    Three things make water pricing distinct: equipment scaling drives a meaningful portion of the invoice, the daily monitoring schedule has to be defensible, and TPA programs scrutinize water claims more aggressively than any other category. Get any one of those three wrong and you are giving away gross profit.

    The Core Water Damage Line Item Stack

    Every water damage estimate should be built from the same core stack so nothing gets missed:

    • Emergency service charge — after-hours response, mobilization, initial assessment
    • Water extraction — by category and class, with documented affected square footage
    • Content manipulation — pack-out, block-up, content cleaning where applicable
    • Demolition and removal — wet drywall, baseboard, flooring, insulation, debris haul
    • Antimicrobial application — by area and method (spray, fog, wipe-down)
    • Drying equipment — air movers, dehumidifiers, air scrubbers, with daily monitoring
    • Containment — poly barriers, negative air, zipper doors when warranted
    • Daily monitoring — moisture readings, equipment adjustment, documentation
    • Equipment removal — final demob and post-dry verification

    Operators who win on water pricing have a checklist that runs through this stack on every estimate. Operators who lose pick and choose, miss line items, and discover the gap on the back-end when the job is closed out.

    Equipment Pricing: The Single Biggest Margin Lever

    Drying equipment is where the largest pricing gap exists between operators who know the rules and operators who guess. Insurance pricing for air movers and dehumidifiers is daily, but the daily count must reflect actual on-site days, not contract days. Documenting equipment placement with photos, equipment counts on the daily monitoring sheet, and removal dates protects every dollar.

    The other equipment trap is dehumidifier sizing. Pricing matrices reimburse based on dehumidifier class (LGR, conventional, desiccant), so misidentifying equipment in the estimate creates either a write-off or an invoice dispute. Always document model numbers and class on the equipment log.

    Category and Class: The Foundation Most Estimates Skip

    Water loss category (1, 2, or 3) and water loss class (1 through 4) drive the pricing for almost every line item on the estimate. Operators who skip the category and class documentation in favor of “just running the numbers” leave money on every job because TPA reviewers will downgrade ambiguous loss types.

    The fix is operational: document category and class on the initial moisture map, photograph contamination evidence for Cat 2 and Cat 3 losses, and reference the IICRC S500 standard in the scope notes. This single practice closes the most common gap between estimated and approved invoices.

    Cash vs Insurance Water Pricing

    Cash water jobs let you price for value rather than against a matrix, but they also expose you to objections you do not get on insurance work. The right cash pricing strategy is a tiered estimate: a “complete dry-out” option, a “structural-only” option, and a “you handle the contents” option. This converts more leads at higher margin than a single take-it-or-leave-it number.

    For insurance work, the discipline is different: build to the matrix, document everything, and never accept a reduction without a written explanation referencing a specific line item. Most reductions are habit; they evaporate when challenged.

    Common Pricing Mistakes That Cost Real Money

    Across hundreds of restoration audits, the same mistakes appear repeatedly. Under-counting affected square footage on the moisture map. Forgetting antimicrobial on Cat 1 losses where it is still warranted. Missing the second floor when water migrated up. Pricing a single air scrubber for a multi-room job. Skipping the daily monitoring line on quick-dry jobs. Each of these costs $200 to $2,000 per job, and they happen on most estimates that are not built from a checklist.

    Frequently Asked Questions

    What is the average price of a water damage restoration job?

    Average residential water damage jobs in the U.S. fall between $3,000 and $7,500 depending on category, class, and affected square footage. Commercial jobs average $8,000 to $40,000+. National averages are useful as a sanity check but should never be used as a pricing target — every estimate should be built line by line from the actual scope.

    Should I use Xactimate pricing for cash water jobs?

    You can use Xactimate pricing as a baseline reference for cash jobs, but cash work should be priced for value, not against a TPA matrix. Most operators find that using Xactimate as a floor and then layering in tiered options produces 20 to 35 percent higher gross margin on cash work than pure matrix pricing.

    How do I defend my water damage pricing to insurance adjusters?

    Defensible water pricing rests on three documents: a labeled moisture map, daily monitoring sheets with equipment counts and moisture readings, and category/class documentation tied to IICRC S500. With those three documents, almost every line item is defensible, and reductions are rare.

    What line items get cut most often on insurance water claims?

    The most commonly reduced items are equipment days (cut to “industry standard”), antimicrobial application (challenged on Cat 1), content manipulation (cut as overhead), and after-hours service charges. Each can be defended with documentation, and most reductions are reversed when the operator pushes back with specifics.

    How often should I update my water damage pricing?

    Pricing matrices update quarterly, so any operator pulling from Xactimate or Symbility should refresh their estimating templates four times a year. Cash pricing should be reviewed at least twice a year against local labor and material costs. Operators who do not update pricing routinely find themselves losing margin to inflation they never adjusted for.


  • Fire and Smoke Restoration Pricing: A Line-Item Playbook for High-Margin Estimates

    Fire and Smoke Restoration Pricing: A Line-Item Playbook for High-Margin Estimates

    Fire and smoke restoration jobs are the highest-margin work in residential restoration, but only when priced correctly. The estimating mistakes that cost a few hundred dollars on a water job will cost five figures on a fire job, because the scope is broader, the equipment is more specialized, and the deodorization process has more legitimate billable hours than most operators capture.

    This guide assumes you have read the restoration pricing master guide and understand the fundamentals of estimate construction. Here we focus on what makes fire pricing different.

    Structure, Contents, and Deodorization Are Three Separate Estimates

    The single biggest pricing improvement most restoration companies can make on fire jobs is treating structure cleanup, contents cleaning, and deodorization as three discrete scopes with three discrete estimates. Operators who roll everything into one estimate consistently under-price the contents and deodorization portions because the structure work feels like the visible deliverable.

    The right model is three sequential workstreams: structure cleaning and demolition, pack-out and contents processing at your facility, and final deodorization with verification testing. Each gets its own estimate, its own crew, and its own milestone billing.

    Structure Pricing for Fire Damage

    Structure pricing on fire jobs starts with smoke and soot category (light, medium, heavy, or “wet smoke” from synthetic combustion). Each category drives a different cleaning approach and a different price per square foot. Documenting the category with photos at intake protects pricing throughout the job.

    Core structure line items include: HEPA vacuuming, dry-sponge cleaning, wet cleaning with chemical sponges, drywall and texture removal, char removal, framing brushing, and seal-coating with shellac-based primer. Most fire estimates miss the seal-coating line, which alone is often a $1,500 to $5,000 omission on a residential job.

    Contents Pricing: The Highest-Margin Line on the Job

    Contents cleaning is where the best restoration companies generate a disproportionate share of their fire job profit. The discipline is treating contents as a per-room or per-cubic-foot line, not a flat fee. Pack-out, transport, processing, storage, and pack-back each have their own unit pricing, and each must be on the estimate.

    Specialty contents — electronics, art, textiles, leather, soft goods — should always be flagged as separate line items priced at specialty rates. Operators who lump these into general contents cleaning consistently lose money on the highest-touch items in the home.

    Deodorization: Five Stages, Five Line Items

    Deodorization is not “ozone for three days.” Proper fire deodorization is a five-stage process, and each stage is billable: source removal, surface cleaning, sealing of porous materials, atmospheric treatment (ozone, hydroxyl, thermal fogging), and verification with re-occupancy testing. An estimate that shows one line for “deodorization” is leaving 60 to 80 percent of the legitimate billable work off the document.

    Operators who break out the five stages typically see deodorization revenue per job double versus operators who roll it into a single line.

    Equipment-Heavy Line Items

    Fire jobs require more specialized equipment than water jobs: HEPA negative air machines, hydroxyl generators, ozone generators, ULV foggers, thermal foggers, and ultrasonic content cleaners. Each piece of equipment has its own daily rate, and each daily rate must be on the estimate when the equipment is on the job.

    Cash Fire Jobs vs Insurance Fire Jobs

    Cash fire jobs are rare but high-margin when they appear. The pricing strategy mirrors cash water work: tiered options, value framing, and walk-away discipline. Insurance fire jobs are about scope completeness and documentation. The largest fire job reductions come from missing scope items on the original estimate, not from line-item haggling.

    Frequently Asked Questions

    What is the average price of a fire damage restoration job?

    Residential fire jobs average $12,000 to $50,000 for partial losses, with major fire losses ranging from $50,000 to $200,000+ when full structure cleanup is involved. Commercial fire jobs commonly exceed $100,000. The wide range reflects the variation in smoke category, contents value, and structural damage.

    Should fire damage estimates be itemized or lump-sum?

    Always itemized. Lump-sum fire estimates are nearly always under-priced because they hide line items the estimator forgot to include. Itemized estimates also defend better to TPA review and give the homeowner clarity on what they are paying for.

    How do I price contents pack-out for fire jobs?

    Contents pack-out should be priced per cubic foot with separate line items for transport, processing labor, storage time, and pack-back. The Xactimate pack-out matrix is a starting point; most operators find they need to layer specialty handling charges on top for electronics, art, and textiles.

    Is ozone treatment enough for smoke deodorization?

    No. Ozone is one of five legitimate deodorization stages. Source removal, surface cleaning, sealing of porous materials, atmospheric treatment, and verification testing are the full process. Operators relying only on ozone consistently see callbacks and re-treatment requests.

    What gets cut most often from fire damage estimates?

    The most commonly reduced fire line items are HEPA equipment days, seal-coating after demolition, contents specialty cleaning charges, and multi-stage deodorization beyond a single ozone treatment. Each can be defended with proper documentation of scope and method.


  • Mold Remediation Pricing Guide: Containment, PPE, and Clearance Line Items That Get Paid

    Mold Remediation Pricing Guide: Containment, PPE, and Clearance Line Items That Get Paid

    Mold remediation pricing differs from water and fire pricing in one crucial way: the work is governed by a written remediation protocol from a third-party assessor, which means every line item on the estimate has to map to a specific protocol requirement. Operators who price mold like a water job consistently under-bill, take on liability they did not price for, or get reductions because the protocol does not match the estimate.

    For broader pricing context, see our restoration pricing master guide. Here we focus on the specific line-item structure that wins on mold work.

    Start with the Protocol, Not the Estimate

    The remediation protocol from the Indoor Environmental Professional (IEP) is the source document for the entire estimate. Every line item — containment level, PPE class, antimicrobial type, equipment count, demolition extent, clearance criteria — must reference the protocol. Estimates that deviate from the protocol either lose work to a more compliant competitor or fail clearance and require costly re-work.

    The first thing to do with any mold job is read the protocol and build the estimate against it line by line.

    Containment Is the Largest Single Cost on Most Jobs

    Containment is where most mold estimates either succeed or fail. The IICRC S520 standard defines four containment levels: limited, source, full, and full with decontamination chamber. Each level has dramatically different labor and material costs, and each must be priced for the actual containment built, not the easiest one to install.

    Core containment line items include: poly sheeting (6-mil minimum), zipper doors, negative air machine setup, decontamination chamber framing, HVAC isolation, and signage. Each of these has its own labor and material line.

    PPE Is a Real Line Item, Not Overhead

    PPE for mold work is consumable, single-use, and required by protocol. Estimates that bury PPE in overhead lose 5 to 10 percent of the legitimate billable work per job. The right approach is per-technician, per-day PPE pricing for tyvek suits, full-face respirators with HEPA cartridges, gloves, and boot covers. Document the technician count and day count, and PPE flows naturally from the labor schedule.

    Antimicrobial and HEPA Vacuuming

    Antimicrobial application has three legitimate billable variants: spray-applied, fog-applied, and wipe-down. Each is a different rate per square foot. HEPA vacuuming of all surfaces in the affected area is a separate line, billed per square foot of surface area (not floor area, which is the most common pricing mistake).

    Demolition and Disposal

    Mold demolition is more aggressive than water demolition because the protocol typically requires removal of all visibly contaminated materials plus a buffer zone (often 12 to 24 inches beyond visible growth). Pricing must reflect the protocol’s demolition extent. Disposal is also more expensive: contaminated materials must be double-bagged in 6-mil poly and disposed of as Category III contamination.

    Equipment: HEPA Air Scrubbers and Negative Air

    HEPA air scrubbers run for the duration of containment plus typically 24 to 48 hours after demolition is complete. Negative air machines maintain pressure differential during containment. Both are billed daily, and both must be documented on the daily log to support invoicing.

    Clearance Testing and Re-Occupancy

    Clearance testing is performed by the IEP, not the remediator, but the remediator must price for re-cleaning if the initial clearance fails. Building this contingency into the estimate as a separate line item — “clearance failure re-cleaning, billable if required” — protects margin and sets expectations with the homeowner.

    Frequently Asked Questions

    What is the average price of a mold remediation job?

    Residential mold jobs average $2,500 to $15,000 depending on containment level and affected area. Severe contamination involving HVAC systems or whole-home remediation can exceed $30,000. Commercial mold projects routinely run $10,000 to $100,000+.

    Why is mold remediation so much more expensive than water damage?

    Mold work requires full PPE, more aggressive demolition, full containment, HEPA equipment, third-party protocol compliance, and clearance testing — none of which are required on standard water damage. The labor and disposal costs are roughly 2 to 3 times higher per affected square foot than equivalent water work.

    Should mold pricing be tied to Xactimate?

    Mold work performed for insurance carriers typically uses Xactimate or Symbility pricing. Cash mold work should be priced for value with tiered options. Operators doing significant cash mold volume often build their own internal pricing matrix referenced against current Xactimate values.

    What gets reduced most often on mold estimates?

    The most commonly reduced items are containment labor (cut as overhead), PPE charges (rolled into labor), HEPA equipment days, and antimicrobial application area. Each is defensible when the estimate ties back to the protocol and the daily log documents the actual work performed.

    Do I need an Indoor Environmental Professional for every mold job?

    Not legally in every state, but the best practice — and the only way to avoid liability — is to require an IEP-written protocol for any mold job exceeding 10 square feet of contamination. The IEP also performs the clearance test, which protects the remediator from re-call disputes.


  • Restoration Pricing Strategy and Margin: How Profitable Operators Avoid Racing to the Bottom

    Restoration Pricing Strategy and Margin: How Profitable Operators Avoid Racing to the Bottom

    Most restoration owners think their pricing problem is the matrix. It is not. The pricing problem is strategy: choosing which jobs to take, which programs to participate in, which markets to compete in, and what gross margin target to defend. Operators who get strategy right consistently produce 35 to 45 percent gross margins. Operators who do not consistently produce 12 to 18 percent gross margins on the same matrix.

    This article complements our restoration pricing master guide by focusing on the strategic choices that surround the line-item work.

    The Three Restoration Pricing Models

    Every restoration company runs on one of three pricing models, and the choice has more impact on profitability than any line-item decision:

    • Pure TPA / matrix pricing — high volume, lower margin, predictable referral flow, heavy paperwork burden
    • Hybrid TPA + cash — diversified revenue, higher blended margin, requires sales capability
    • Cash-only / direct-to-consumer — highest margin per job, requires marketing investment, more sensitive to local economy

    Each model has a different cost structure, a different sales motion, and a different capital requirement. The strategic mistake is trying to run all three with the same operations.

    Setting a Gross Margin Target

    Healthy restoration companies target 35 to 45 percent gross margin on the blended business. TPA-only operators trend toward the lower end; cash-heavy operators trend toward the higher end. Setting a target margin and walking away from jobs that do not meet it is the single most important strategic discipline in the business.

    The math works like this: if your overhead absorption requires 35 percent gross margin to break even, every job below that target consumes capacity that should go to better work. Saying yes to those jobs feels like growth but is actually destruction.

    Pricing for Value, Not Cost

    The most expensive mistake in restoration pricing is the cost-plus mindset: figure out your cost, add a margin, send the estimate. Cost-plus pricing leaves money on the table on every cash job and ignores the value the customer is actually receiving (immediate response, displacement avoidance, professional handling of insurance).

    Value-based pricing on cash work uses tiered options, value-anchoring (presenting the most expensive option first), and outcome framing (“we save you the displacement, the insurance battle, and the risk of secondary damage”).

    Defending Pricing Without Discounting

    Discounting is the gateway drug of restoration pricing. Once an operator starts discounting to win jobs, the local market remembers, and every future job comes in at the discounted rate. The discipline is to defend price without discounting: re-scope the work, drop optional line items, offer payment terms, but never cut the unit prices.

    The reps who close at full price are the reps who can articulate why the work costs what it costs and what happens if it is not done correctly. Training the sales conversation matters more than the price itself.

    Programs to Avoid

    Some TPA programs are not worth participating in at any margin level. The signals that a program is destructive: required participation in third-party billing platforms with high transaction fees, mandatory upfront deductible collection, slow pay (90+ days), excessive audit reductions, or volume requirements that consume more capacity than the revenue justifies.

    Walking away from bad programs is harder than joining them — but it is what separates 35 percent margin operators from 12 percent margin operators.

    Frequently Asked Questions

    What gross margin should a restoration company target?

    Healthy restoration companies target 35 to 45 percent gross margin. TPA-only operators commonly run 25 to 35 percent. Cash-only or premium-cash operators commonly run 45 to 60 percent. Below 25 percent gross margin, the business cannot absorb overhead and grow simultaneously.

    Should I price the same for cash and insurance jobs?

    No. Insurance jobs should be priced to the matrix with disciplined documentation. Cash jobs should be priced for value with tiered options. Pricing identically across both channels means under-charging on cash work or over-pricing insurance work that never gets approved.

    How do I compete with low-priced restoration companies in my market?

    You do not compete on price. You compete on response speed, scope clarity, communication, warranty, and outcome. Low-priced competitors win the customers who shop on price; you want the customers who shop on confidence. Marketing, sales training, and reputation are the real defenses against low pricing.

    When should I walk away from a TPA program?

    Walk away when the program requires capacity that would generate more gross profit elsewhere, when transaction fees and audit reductions push the effective margin below your target, or when payment terms exceed 60 days consistently. Calculate the true cost of participation, not just the headline volume.

    What is the right gross margin to target on cash jobs specifically?

    50 to 60 percent gross margin is the right target for cash work in most markets. Cash jobs carry more sales effort, more collection risk, and no TPA referral funnel — so the margin must compensate. Operators consistently producing 30 percent margin on cash work are leaving substantial profit on the table.


  • Cash vs Insurance Restoration Pricing: When to Use Which and How to Convert at Higher Margin

    Cash vs Insurance Restoration Pricing: When to Use Which and How to Convert at Higher Margin

    Cash and insurance restoration jobs look identical in the field but require completely different pricing strategies. Operators who use the same approach for both consistently under-price cash work and lose money to scope reductions on insurance work. The good news: separating the two pricing motions is one of the highest-impact changes a restoration company can make.

    This article builds on the foundation laid in our restoration pricing master guide.

    How to Tell the Difference at Intake

    Every job intake should answer one question early: is this an insurance job, a cash job, or undetermined? The answer drives every subsequent decision — sales process, estimate format, scope of work, payment terms, and pricing.

    Signals that a job will be cash: customer has no intention of filing a claim, deductible is high relative to job size, damage is below deductible, customer is uninsured, customer is sensitive to claim impact on premium. Signals that a job will be insurance: claim is already filed, adjuster is already assigned, TPA program is involved, large loss requiring carrier coverage.

    Insurance Pricing Discipline

    Insurance jobs should be priced to the matrix with full scope documentation. The discipline is completeness: every line item that should be on the estimate must be on the estimate, and every line item must be defensible with on-site documentation.

    Insurance pricing is a documentation game, not a negotiation game. The reps who get paid in full are the reps who photograph everything, log moisture readings daily, document equipment placement, and reference IICRC standards in the scope notes.

    Cash Pricing Strategy: Tiered Options Win

    Cash pricing should never be a single number. The conversion-rate-winning approach is a three-tier estimate:

    • Premium tier — full-service, highest scope, white-glove handling, longest warranty
    • Standard tier — recommended scope, normal warranty, structure plus contents
    • Budget tier — minimum to address the immediate problem, structure-only or critical-area-only

    This works because most customers want to feel like they are making a choice, not accepting a price. Tiered pricing converts more leads, lifts average ticket, and surfaces the actual customer budget faster than a single-price approach.

    Value Anchoring on Cash Work

    The order in which options are presented matters as much as the options themselves. Always present the premium tier first. The standard tier then feels reasonable, and the budget tier feels like a compromise. Reverse the order and the standard tier feels expensive while the budget tier becomes the default choice.

    Value-anchoring is not manipulation; it is helping the customer understand the full scope of what good restoration work looks like before they pick the level they want.

    Converting Cash Leads That Hesitate

    Cash leads who hesitate after seeing the estimate are usually responding to one of three concerns: the price feels high (compared to what?), the scope feels excessive (do I really need all this?), or the payment timing feels difficult (can I afford this now?).

    The right responses, in order: re-frame the comparison (“here is what happens if it is not done correctly”), explain each line item (“this is required because of contamination class”), and offer payment terms (“we can split this into three payments tied to milestones”). Never respond with a discount.

    Hybrid Cash + Insurance Scenarios

    Some jobs are partially insurance-covered and partially out of pocket. The pricing approach: build one comprehensive estimate at insurance pricing for the covered portion, then a separate cash estimate for additional work the customer wants. Mixing the two in a single estimate creates billing chaos and lost margin.

    Frequently Asked Questions

    Should I always recommend filing an insurance claim?

    No. For damage below or near the deductible, filing a claim costs the customer more than the cash estimate would. The right ethical position is to share the math and let the customer decide. Operators who push every job to claim status develop a reputation for opportunism that hurts long-term referrals.

    How much higher should cash pricing be than insurance pricing?

    Cash work typically prices 15 to 30 percent above the equivalent Xactimate estimate, reflecting the value of immediate response, no claim involvement, and the operator’s higher sales effort. The premium is justified by what the customer is actually buying — which is more than just the labor.

    What is the best way to present a cash estimate?

    In person, on a tablet, with three tiered options visible simultaneously. Walk through each option’s scope, warranty, and timeline. Let the customer ask questions. Never email a cash estimate cold and hope for a yes — that is the lowest-converting approach available.

    How do I handle a customer who says my cash price is higher than another quote?

    Ask to see the other quote. Most “lower” quotes are missing scope items, are quoting a different remediation level, or are from operators without IICRC credentials. Walking through the comparison line by line either justifies your pricing or surfaces a real scope gap to address.

    What payment terms should I offer on cash jobs?

    Standard terms: 50 percent deposit, 50 percent on substantial completion. For larger jobs: 25 percent deposit, 50 percent at midpoint, 25 percent on completion. Never start work without a deposit; collection becomes nearly impossible after the work is done.


  • Restoration Pricing Objections and Discounts: How to Defend Price Without Caving

    Restoration Pricing Objections and Discounts: How to Defend Price Without Caving

    Pricing objections are not a problem to solve; they are a normal part of the restoration sales conversation. The difference between reps who close at full price and reps who discount their way to a yes is not the words they use — it is the framework they use to think about objections in the first place.

    This article builds on the strategic foundation laid out in our restoration pricing master guide.

    The Three Objection Types

    Every pricing objection in restoration falls into one of three categories, and each requires a different response:

    • “It feels expensive” — comparison-based objection (compared to what?)
    • “I cannot afford this” — capacity-based objection (timing or amount?)
    • “You are higher than the other quote” — competitive objection (apples-to-apples?)

    Mis-diagnosing the objection type is what causes reps to discount when they should re-frame, or re-frame when they should offer payment terms.

    Responding to “It Feels Expensive”

    The “expensive” objection is almost always a comparison problem. The customer has a frame of reference (a kitchen renovation, a service call, a previous loss) that does not match restoration work. The right response is to expand the frame.

    “Expensive compared to what? When you think about the cost of secondary damage if this is not addressed properly, or the cost of mold remediation if drying is incomplete, our estimate represents the lower-cost outcome — not the higher-cost one.”

    Responding to “I Cannot Afford This”

    This objection is about timing or amount, and the right response depends on which. If timing, offer milestone payments. If amount, re-scope to a tiered alternative — never discount the original scope. Discounting the full scope teaches the customer that your prices are negotiable, which destroys margin on every future job.

    “I hear you — let me show you a tiered approach. We can address the immediate critical issues now and phase the rest as your budget allows. Same per-line pricing, smaller scope at each step.”

    Responding to “Other Quote Was Lower”

    Always ask to see the competing estimate. The honest answer to “lower quotes” is that they are usually missing scope, missing equipment days, missing required line items, or being submitted by operators without proper credentials. Walking through the comparison line by line either justifies your price or reveals a real gap.

    “Can I take a look? I want to make sure we are comparing the same scope. If they are doing the same work for less, that is information I need. If their estimate is missing scope, that is information you need.”

    Walk-Away Discipline

    The single most powerful pricing tool a restoration rep has is the willingness to walk away. Customers can sense when a rep needs the deal, and they will negotiate harder. Customers can also sense when a rep is genuinely indifferent to whether the job closes at full price or does not close at all.

    The reps who project walk-away energy close more jobs at full price than the reps who chase every deal. The math is counterintuitive but durable.

    When Discounting Is Appropriate

    Discounting is appropriate in exactly three situations: military or first-responder discounts (predictable, advertised, capped), bundled multi-property work (volume justifies it), and end-of-month margin trades on jobs that fit a slow week. Every other discount is a habit, not a strategy.

    Scripts That Hold the Line

    The right scripts for holding the line do not feel adversarial. They feel like a problem-solving conversation:

    “I want to make sure we get this right for you. The pricing reflects the IICRC-standard work this loss requires. If we can adjust the scope to fit your situation better, let me know what is most important — but I cannot reduce the unit pricing on what we do agree to do, because that would mean cutting corners on the work itself.”

    Frequently Asked Questions

    Should I ever discount restoration work?

    Rarely. Discounting on a single job teaches the local market that your pricing is negotiable. The better tools are tiered scope, payment terms, and walk-away discipline. Discount only when it fits a structured policy (military discount, multi-property volume, end-of-month margin trade).

    How do I respond when a customer says they will go with a cheaper competitor?

    Wish them well, leave the door open, and move on. “I understand — if their estimate covers the full scope, that is the right call for you. If you find later that something was missed, please call us. We are happy to come back out.” That response wins long-term reputation and frequently wins the job back when the cheaper estimate proves incomplete.

    What is the most common pricing objection in restoration?

    “It feels expensive” — almost always a comparison problem rather than a real budget issue. The customer is comparing the estimate to a frame of reference that does not match restoration work. Re-framing the comparison resolves most of these objections without any pricing change.

    How do I train new sales reps to defend pricing?

    Role-play the three objection types weekly. Train reps to ask diagnostic questions before responding. Audit closed-lost deals for the actual reason and feedback patterns. The reps who get good at defending pricing are the reps who get the most repetitions on the conversation.

    What is the right pricing posture during a slow market?

    Hold the line on unit pricing and adjust scope or payment terms as needed. Cutting unit pricing during a slow market makes the slow market permanent in the customer’s mind. The operators who emerge from slow markets strongest are the ones who held pricing through them.


  • The Complete Restoration Marketing Guide for 2026

    The Complete Restoration Marketing Guide for 2026

    Restoration marketing is not home services marketing. The buying cycle is broken — most homeowners don’t shop until water is on the floor, and most commercial accounts don’t buy a restorer until they need one at 2 a.m. Generic marketing playbooks designed for HVAC, roofing, or landscaping fall apart when applied to a category where 80% of demand is reactive emergency work and the other 20% is relationship-driven preferred-vendor placement.

    This guide is the complete restoration marketing playbook for 2026: every channel that matters, the math behind each one, and the prioritization framework that separates restoration companies that grow from the ones stuck at the same revenue line for five years running.

    What restoration marketing actually has to accomplish

    Most marketing strategies aim for one job: generate leads. Restoration marketing has to do four things simultaneously, and most companies only get one or two right.

    The four jobs are capture emergency demand (be the first call when a pipe bursts), build commercial preferred-vendor pipeline (get on lists at facilities, property management firms, and TPAs), maintain referral momentum (stay top of mind with plumbers, agents, adjusters, and past customers), and build the brand asset (so when an insurance carrier or commercial buyer Googles you, what they find sells the relationship). A program that generates emergency leads but ignores commercial pipeline gets stuck at residential ceiling. A program that builds a great brand but ignores Local Service Ads loses the late-night calls that pay the rent.

    The restoration marketing channel stack

    Here is the complete channel inventory for a modern restoration company, ranked by typical contribution to revenue for an established multi-truck operation.

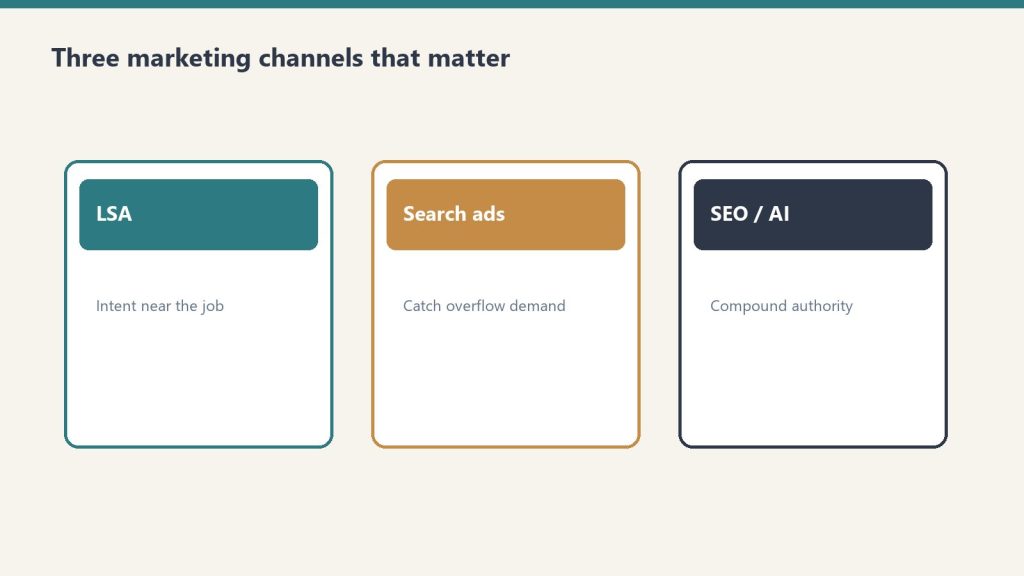
    1. Local Service Ads (LSAs)

    LSAs are pay-per-lead Google products that appear above the map pack on local emergency searches. For restoration, this is the single most ROI-positive channel that exists. A “water damage near me” lead from LSAs typically costs between $35 and $85 in most US markets, and converted jobs run $3,000 to $15,000+ in revenue. Setup requires Google Guarantee verification, license uploads, insurance documentation, and review velocity. Most restoration companies underinvest in LSAs because the dashboard is unfamiliar — that’s the opportunity.

    2. Local SEO and Google Business Profile

    The map pack is where emergency restoration searches convert. Optimizing your Google Business Profile, building genuine review velocity (target 4.7+ stars with 100+ reviews per location), publishing service-area landing pages with city-level intent, and earning local citations is the second pillar. Local SEO compounds — a company that builds it for two years has a moat competitors can’t buy.

    3. Google Ads (paid search)

    Outside LSAs, paid search on terms like “water damage restoration [city],” “mold remediation,” and “fire damage cleanup” remains a workhorse. Tight match-type discipline, location targeting at the ZIP level, call extensions, and aggressive negative keyword lists are non-negotiable. Without those, Google will happily spend $200 a day on irrelevant queries.

    4. Content marketing and SEO

    Long-form content does two things at once: it captures top-of-funnel research traffic (“what to do after water damage,” “how to dry out a wet basement”) and it builds the authority signals that move your map pack rankings. The mistake most restorers make is publishing thin 400-word service pages and calling it SEO. Real content marketing means 1,500+ word answers, expert-reviewed posts, original photos, and a publishing cadence the operator can actually sustain.

    5. Commercial business development

    Commercial restoration is a relationship business that masquerades as a marketing problem. The “marketing” here is structured outreach to property managers, facility directors, REITs, healthcare facilities, and commercial insurance brokers — combined with branded sales collateral, capabilities decks, and a website that looks like a commercial vendor rather than a residential carpet cleaner.

    6. Referral programs (plumbers, agents, adjusters)

    The classic restoration referral playbook is alive and well. Structured plumber programs (with co-branded marketing, fast response promises, and clear referral tracking), insurance agent breakfast meetings, and independent adjuster relationships still produce 20-40% of revenue at most established restoration shops.

    7. TPA and carrier preferred vendor programs

    Joining programs like Contractor Connection, Code Blue, Sedgwick, Crawford, and Allstate’s preferred vendor lists is its own marketing channel — applications, audits, performance metrics, and ongoing scorecard management. The work is high-volume but margin-compressed, so this channel needs to be planned, not stumbled into.

    8. Social media and brand content

    Social is mostly a brand and recruiting channel for restoration, not a direct lead channel. LinkedIn for commercial business development, Facebook for community presence and reviews, and Instagram for technician recruiting and culture content. Don’t expect TikTok to fill your truck.

    9. Email marketing

    Often ignored, email is the cheapest way to stay top of mind with referral partners and past customers. Quarterly newsletter to plumber partners, monthly tips to agents, and seasonal reminders to past customers keep the referral engine warm.

    How to allocate the marketing budget

    For a restoration company doing $1M to $5M in annual revenue, the typical healthy budget allocation looks like: 35-45% LSAs and Google Ads, 15-20% local SEO and content, 15-20% commercial business development (sales rep cost, collateral, events), 10-15% referral program maintenance, and the rest to brand and recruiting. Companies under $1M should weight more heavily into LSAs and direct response — brand spending before you have the operational base to handle volume is wasted budget.

    The KPIs that actually matter

    Most restoration marketing dashboards track vanity metrics. The numbers that predict whether a marketing program is working are cost per qualified lead (not raw lead — qualified means the customer answered the call and the job has insurance or out-of-pocket budget), lead-to-job conversion rate (industry healthy range is 35-55% for residential, 15-30% for commercial), average ticket by source (LSAs and Google Ads jobs typically run smaller than referral or commercial jobs), and marketing ROI by channel (revenue divided by marketing spend, calculated quarterly).

    The 90-day restoration marketing audit

    If you inherited a restoration marketing program or you’re not sure where you stand, here’s the audit framework. Pull your last 90 days of leads. Tag each by source. Calculate cost per qualified lead by channel. Calculate revenue produced by channel. Identify the single best-performing channel and the single worst. Cut the worst, double down on the best, and pick one new channel to test for the next quarter. That’s the entire program.

    Frequently Asked Questions

    How much should a restoration company spend on marketing?

    Healthy restoration marketing spend ranges from 6% to 12% of revenue, depending on growth stage and market competitiveness. Companies in startup or rapid-growth mode often spend 10-15%; mature operators with strong referral pipelines may run as low as 4-6% because referral and TPA channels carry more of the load.

    What is the best marketing channel for restoration companies?

    For emergency residential work, Local Service Ads typically deliver the best cost per acquired job. For commercial restoration, structured business development to property managers and facility directors outperforms any digital channel. The right answer depends on which side of the business you’re trying to grow.

    How long does restoration SEO take to work?

    Local SEO and Google Business Profile optimization can move map pack rankings within 60-120 days for less competitive markets. Organic blog content takes 6-12 months to mature and produce consistent traffic. Companies expecting immediate organic results will be disappointed; companies that commit to a 12-month horizon usually see meaningful results.

    Are Local Service Ads worth it for restoration?

    Yes, in most markets. LSAs typically deliver the lowest cost per acquired customer of any digital channel for emergency restoration services. The exceptions are extremely competitive metros where lead pricing has been bid up significantly, or service areas where Google Guarantee verification is delayed.

    Should I hire a restoration marketing agency or do it in-house?

    Companies under $2M in revenue typically benefit from a specialized restoration marketing agency that already knows the channels and pitfalls. Companies above $5M often hire an in-house marketing director and use agencies tactically for SEO, paid media, or content. The middle range is the hardest — that’s where most restoration marketing money gets wasted.

    What does a restoration marketing plan look like?

    A real plan has four components: a channel mix and budget allocation, a 12-month content and publishing calendar, a quarterly business development plan for commercial pipeline, and a measurement framework that tracks cost per qualified lead and revenue per channel. Anything less is a wish list.


  • The Complete Restoration Sales Playbook (Commercial and Residential)

    The Complete Restoration Sales Playbook (Commercial and Residential)

    Most restoration companies don’t have a sales process. They have an owner who answers the phone, gives a verbal estimate, and hopes the customer says yes. That works until it doesn’t — usually around the $1.5M revenue line, when the owner can no longer touch every job and the company plateaus.

    This is the complete restoration sales playbook for both commercial and residential. The processes, the scripts, the objections, the comp plans, the metrics, and the org structure that turn restoration sales from “the owner’s gut” into a scalable engine.

    Why restoration sales is different from other home services

    Three things make restoration sales unique. First, most customers don’t want to be there — water on the floor, fire damage, mold smell — and the buying experience is emotional, not transactional. Second, insurance is usually the third party in the room, which means the sale has both a customer-facing dimension and a carrier-facing scope-and-pricing dimension. Third, the urgency window is short — a homeowner with three inches of water in the basement is making a decision in the next sixty minutes, not the next sixty days. A sales process built for HVAC replacement or kitchen remodels doesn’t work in this environment.

    The residential restoration sales process

    The clean residential process has six steps. First, the inbound call or arrival — set the customer at ease, gather the basics, dispatch the truck. Second, the on-site walk and assessment — physically inspect the loss, document with photos and a moisture map, identify scope. Third, the trust-building conversation — explain what’s happening, what the company will do, what the timeline looks like, what the insurance process will involve. Fourth, the work authorization — get the signature on the work authorization form and the AOB (assignment of benefits) where used, with clear scope language. Fifth, the daily progress update — text or call the customer every day with what was done and what’s next. Sixth, the close-out and review request — final walkthrough, signed completion certificate, immediate ask for the Google review.

    The commercial restoration sales process

    Commercial is fundamentally different — longer sales cycle, multiple stakeholders, RFP and master service agreement structures. The commercial process has eight steps. First, identify and qualify the target (property managers, facility directors, REIT operations teams, healthcare facility managers, hotel chains). Second, cold outreach via email, phone, LinkedIn, or in-person drop-bys. Third, discovery meeting to understand current vendor situation, pain points, and decision criteria. Fourth, capabilities presentation — branded deck, case studies, references, certifications. Fifth, RFP response or vendor application — formal pricing schedules, COI, W-9, MSA negotiation. Sixth, onboarding and first job — usually a small loss to prove the relationship works. Seventh, account management — quarterly business reviews, scorecard tracking, expansion within the account. Eighth, renewal and reference development — turn happy commercial accounts into case studies and references for the next prospect.

    The five most common restoration sales objections (and how to handle them)

    “I need to call my insurance company first.” This is the most common objection on residential. The honest answer: yes, they should call insurance, but they don’t need to wait for insurance to authorize emergency mitigation. Mitigation is a duty owed by the homeowner under almost every policy, and delaying mitigation usually causes more damage and more denials, not fewer. Explain this calmly, point them to their policy language, and offer to be on the call when they reach the carrier.

    “How much is this going to cost?” The wrong answer is a number. The right answer is “it depends on what we find when we open up the affected areas, but I can walk you through how Xactimate pricing works, what your policy typically covers, and what your out-of-pocket exposure is likely to be.” Rebuild trust with transparency, not with an unreliable estimate that you’ll have to retract later.

    “My uncle/cousin/neighbor does this kind of work.” Don’t fight it. Acknowledge it, then differentiate: “If they’re certified IICRC and carry the right insurance, that’s great — we’re happy to be the second opinion. If you’d prefer to use them, we still recommend you start mitigation in the next few hours either way.” Sometimes you’ll lose the job. Often the customer will quietly reconsider when they realize what’s actually involved.

    “Your competitor quoted me less.” The hidden answer to this objection is almost always scope, not rate. Walk through the scope item by item with the customer. Identify what’s missing in the competitor’s proposal. Explain what gets denied or supplemented later when the carrier reviews. Most price objections in restoration are scope-comparison failures, not pricing failures.

    “I want to think about it.” Time is not a luxury in restoration. The honest, professional response: “I understand. The challenge is that every hour we wait, the loss usually gets worse and the carrier may push back on damage that could have been prevented. Can we start emergency mitigation now and you finalize the rest of the scope tomorrow?”

    Sales rep compensation: the models that work

    Three compensation structures dominate in restoration. Salary plus bonus works for inside sales reps and commercial business development, where the sales cycle is long and the rep needs predictable income. Typical structure: $60K-$90K base plus 1-3% of revenue from accounts they bring in, capped or uncapped depending on territory size. Commission-only works for outside residential sales reps in markets with high enough volume to support it. Typical structure: 5-10% of gross revenue or 10-15% of gross profit, with a draw against commission for the first 90 days. Salary plus team bonus works for production-side sales (project managers who upsell during jobs). Typical structure: production manager salary plus a small percentage of completed job revenue tied to customer satisfaction scores.

    The metrics that predict restoration sales performance

    Forget revenue as the primary metric — it’s a lagging indicator. The leading indicators that predict next quarter’s revenue are activity volume (calls made, meetings held, proposals sent), pipeline value (sum of qualified opportunities × probability), conversion rates by stage (lead to qualified, qualified to proposal, proposal to close), average deal size by source, and sales cycle length by deal type. A weekly pipeline review using these five metrics will tell you what’s coming three months out.

    When to hire your first sales rep

    Most restoration owners hire too late. The right trigger is when you can confidently answer two questions: “do I have a documented sales process I can hand to someone else?” and “do I have enough lead flow to keep a sales rep at 70%+ capacity?” If both are yes and you’re at $1.5M+ in revenue, it’s time. The first sales hire should usually be a residential closer or commercial business development rep, depending on which side of the business has the bigger growth ceiling.

    Frequently Asked Questions

    What does a restoration sales rep actually do?

    Residential sales reps respond to inbound emergency calls, conduct on-site walks, write scopes, present pricing, secure work authorizations, and manage the customer relationship through completion. Commercial sales reps prospect property managers and facility directors, conduct discovery meetings, deliver capabilities presentations, respond to RFPs, negotiate MSAs, and manage assigned accounts long-term.

    How much does a restoration sales rep make?

    Residential outside sales reps in restoration typically earn $60K-$120K total compensation, depending on market, lead flow, and commission structure. Commercial business development reps with established books of business often earn $90K-$200K. New hires in their first year usually fall into the $50K-$80K range while building pipeline.

    How do you sell commercial restoration services?

    Commercial restoration sales is relationship-based business development, not transactional sales. The process: identify target accounts (property managers, facility directors, REITs, healthcare, hospitality), build relationships through outreach and industry events, present capabilities through branded decks and case studies, win small jobs first to prove competence, then expand to MSA-level relationships and preferred vendor status.

    What is the close rate for restoration sales?

    Healthy close rates by segment: residential emergency leads 40-60% from lead to job; residential planned/estimated work 25-40%; commercial RFPs 15-30%; commercial referral-based opportunities 35-55%. Companies significantly below these ranges usually have a process or speed problem, not a market problem.

    Should I hire a restoration sales coach or consultant?

    Restoration sales coaching has matured into a real category — there are several specialists who focus exclusively on this industry. Coaching tends to deliver the best ROI for owners who already have lead flow but are struggling with conversion, or for sales reps in their first 12-24 months who need scaffolding on process and objection handling. It’s less useful for foundational issues like lead generation or operational capacity.

    How do you train a restoration sales rep?

    Effective restoration sales training has four pillars: technical knowledge (water categories, drying science, restoration process, IICRC standards), insurance literacy (policy language, claims process, Xactimate basics, supplements), sales process and scripts (call handling, on-site discovery, scope presentation, objection handling, close), and ride-alongs with the owner or senior rep for the first 60-90 days before independent calls.