Tag: Business Development

  • Owner Bottleneck Self-Assessment

    Owner Bottleneck Self-Assessment

    Owner Bottleneck Self-Assessment

    $29

    Delivered by email after checkout.

    Buy Now →

    Secure checkout via Square — all major cards accepted

    You can copy this method and do it yourself. Score yourself across five areas. Total the checks. Write your top 3 things to delegate first. Buy Now is the packaged Notion page you duplicate, so you are not rebuilding the 25-statement score from a blank doc.

    Tool #2 of the Restoration Leadership Toolkit. Find out where your company still depends on you. An owner bottleneck exists when growth, decision speed, and consistency are limited by your personal involvement in day-to-day decisions. You become both the most important and the most constraining person in the business.

    Check the box for each statement that is true of your business today. Count the checks in each section, then total them at the bottom. Be honest. The value is in the truth.

    How to run it

    1. Work the five sections. Check only what is true today, not what used to be true or what you plan to fix.
    2. Total the checks (range is 0-25). Read your band.
    3. Write your top 3 to delegate first. Those become Weeks 1-2 of a 90-day doer-to-leader plan.
    4. For one full week after you score, log every interrupt for a decision. Sort into Delegate now / Delegate after training / Keep (truly owner-only).
    5. Re-run it at the end of 90 days and compare to Week 1. The number matters less than the trend.

    1. Decisions only you make

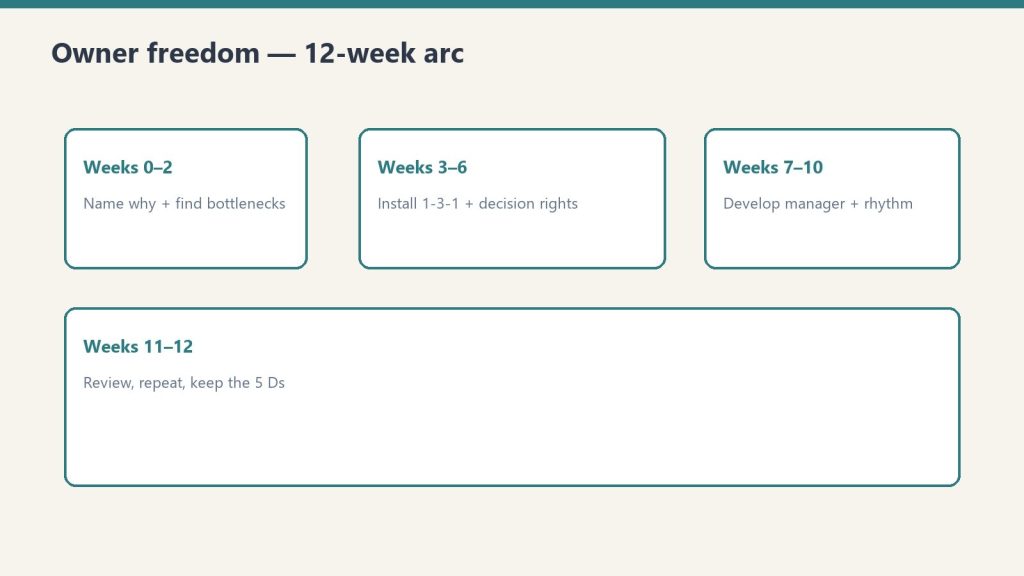
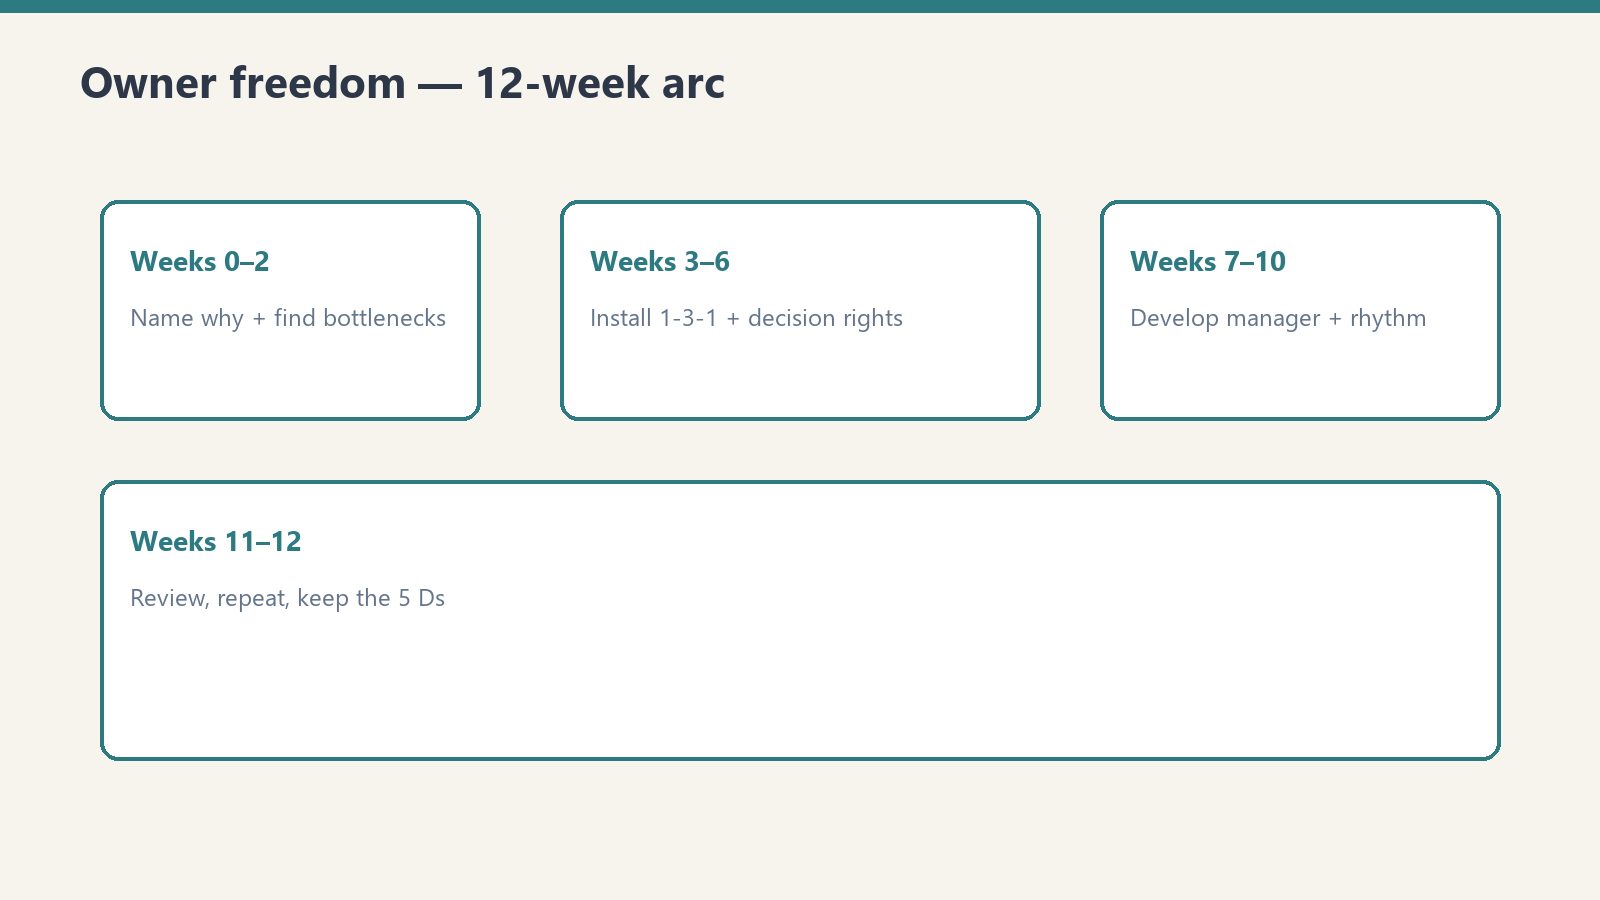
    Four-phase board covering a 12-week owner freedom transition
    Decisions only you make — that’s the bottleneck map.
    • Estimate / pricing approvals over a set dollar amount run through me
    • Hiring and firing decisions are all mine
    • Vendor and supplier choices need my sign-off
    • Which jobs we take is my call alone
    • Refunds, credits, and customer concessions require me

    If this section is heavy, your next move is a Decision-Rights list: 10-15 recurring decisions, a dollar or scope threshold people can decide under without asking you, and who owns it when you are not in the room. Walk the team through it: “Under this line, you do not need me. Decide and tell me after.” Hand off one decision completely this month and do not take it back.

    Starter rows if you need them: approve a job estimate over $25k; authorize overtime / call-in crew; issue a refund or credit; hire or fire; approve a vendor / sub payment; take an out-of-area or unusual job; sign a contract or insurance scope; pull a crew off one job for another; spend on new equipment; set or discount a price.

    2. Interruptions by department

    • Production calls me daily with questions
    • Office / admin pulls me into billing or scheduling
    • Sales / estimating checks pricing with me before quoting
    • Technicians call me from job sites
    • I get pulled into customer complaints personally

    Tally the interrupts for one week. The department with the most checks is this quarter’s target. Install 1-3-1 there first: one issue, three options with pros/cons/cost, one recommendation, and a default if they do not hear back by a deadline. When someone brings a raw problem, ask: “What are your three options, and which do you recommend?” Then wait.

    3. Recurring questions that come back to you

    • The same operational questions reach me every week
    • People wait for me to decide instead of deciding themselves
    • “Ask the owner” is the default answer here
    • I re-explain the same processes over and over
    • Things stall when I am unavailable

    Recurring questions are undocumented decisions. Write the answer once. Put it where the question gets asked (truck, office, group chat). If you re-explain the same process, that process needs an SOP or a named owner, not another explanation from you.

    4. Tasks that should be delegated

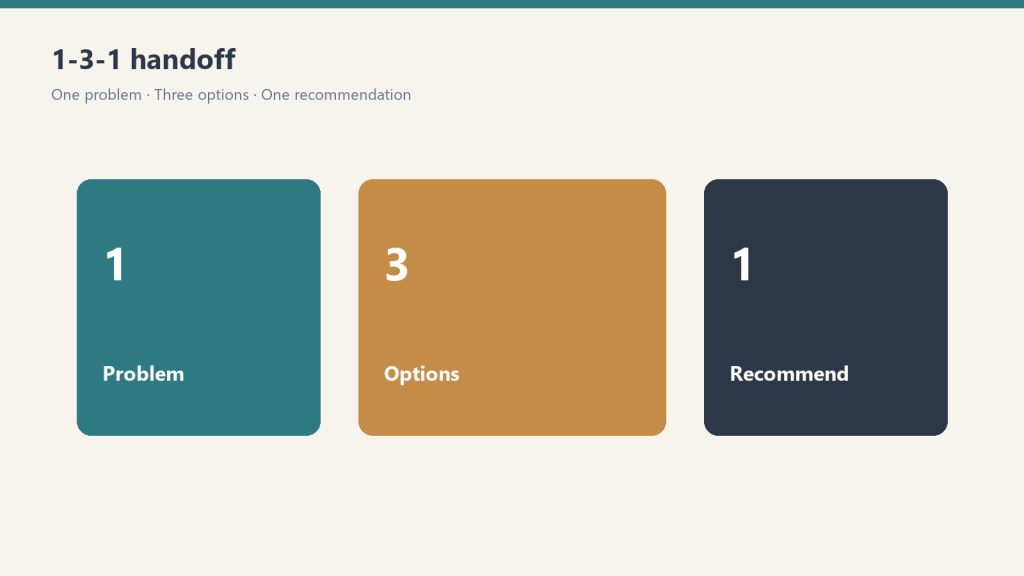
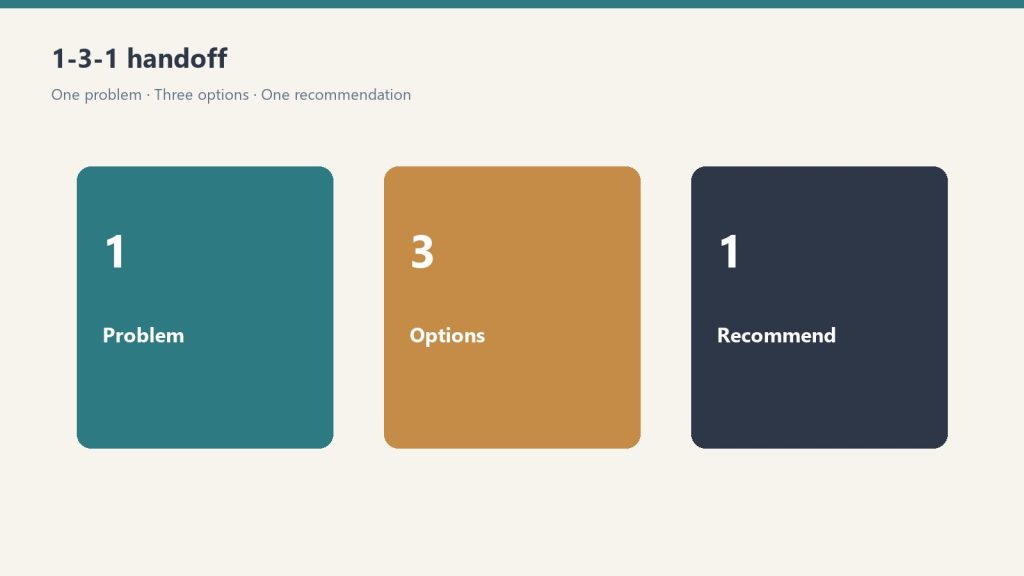
    Three panels showing one problem, three options, one recommendation
    Tasks that should be delegated — write them down.
    • I still write estimates I could hand off
    • I handle scheduling / dispatch
    • I chase collections / AR myself
    • I order equipment and supplies
    • I personally produce things others could

    These are doer tasks wearing an owner badge. Pick one. Hand the outcome, not the task. “You own scheduling this month. I will sit in the first week. After that, bring me 1-3-1s, not the board.” Name the 1-2 skills they most need and how you will help (ride-along, training, a stretch job). Set a weekly 30-minute 1-on-1 and protect it.

    5. Areas with no backup

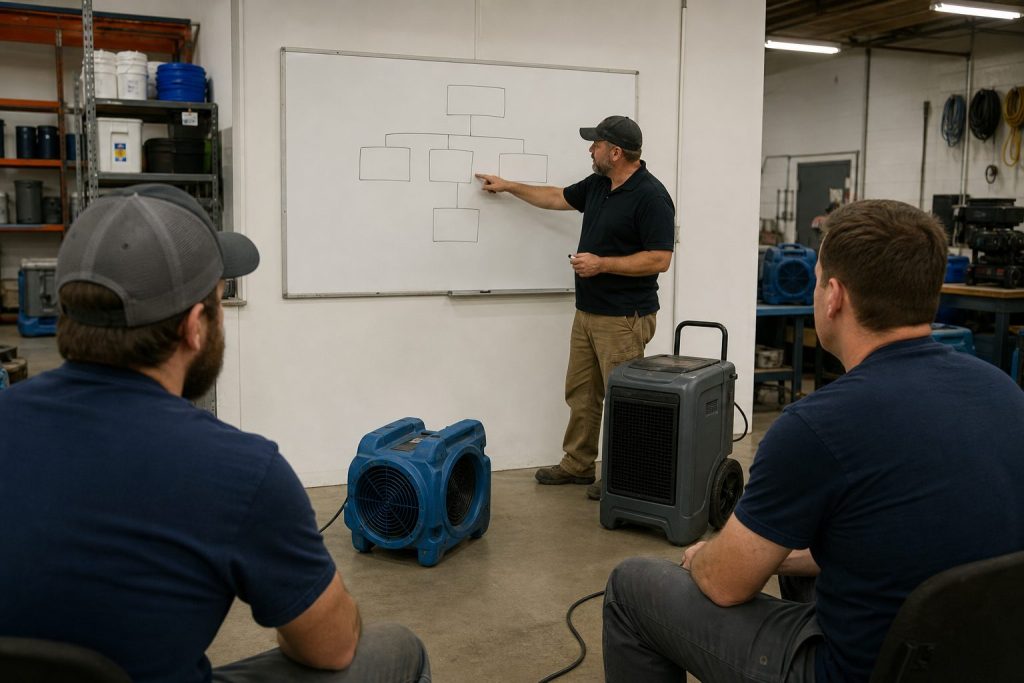
    Restoration technicians training in a shop bay with equipment demo and whiteboard
    Areas with no backup — hire or train before you vanish.
    • No one else can run production if I am out
    • Only I hold the key carrier / adjuster relationships
    • Only I can see the full financial picture
    • There are no written SOPs for the things I do
    • If I am gone a week, something breaks

    A checked box here is a single point of failure. Name the backup, or name the blank. A blank candidate is itself a finding. Put each exposed function on a bench list: current owner, future-leader candidate, backup depth (None / Thin / Solid), the skill gap, one observable 90-day action, a weekly or biweekly check-in.

    This section is the short version of the Owner Dependency Audit (nine areas, Low/Med/High, what breaks if you vanish 30 days) and the 5 Ds Disease / Departure boxes (vacation test, backup estimator, relationships not owned by one person).

    Your score

    Total checks: ___ / 25

    • 0-6 Mild. You have delegated well. Tighten the few remaining gaps.
    • 7-13 Moderate. You are the bottleneck in one or two areas. Fix the worst one first.
    • 14-19 Heavy. The business runs through you. Start delegating now, deliberately.
    • 20-25 Severe. You ARE the business. This is the #1 risk to your growth and your exit.

    Write your top 3 to delegate first. Take the worst section into a 90-day doer-to-leader plan. Run the Owner Dependency Audit for the full picture (nine areas, Decision-Rights Map, 30-day disappear test).

    Tell the team the shift is coming: “I am working a 90-day plan to push decisions down. Expect me to hand more back to you.” Then do it. Re-score at Week 12. Take a planned half-day fully off and note what broke. That is the next bottleneck.

    If you want the packaged assessment

    You can run the 25 statements on a legal pad. Buy Now is the Notion page delivered by email after checkout. Duplicate it (··· → Duplicate) so the original stays clean for next quarter. The five sections, the score table, and the top-3 lines are already laid out. Same Square button at the top of this page.

    Pairs with the Owner Dependency Audit (deeper diagnostic) and the 90-Day Doer-to-Leader Transition Plan (Weeks 1-2). Matching Claude skill: owner-bottleneck-assessment. Coaching and operational tool only. Not legal or HR advice.

    Related: Restoration Leadership Toolkit — Claude Edition. Also 1-3-1 Delegation Worksheet.

  • Leadership Readiness Kit

    Leadership Readiness Kit

    Leadership Readiness Kit

    $197

    Delivered by email after checkout.

    Buy Now →

    Secure checkout via Square — all major cards accepted

    You can copy this method and do it yourself. Walk the bench. Score the person you want to promote. Plan the hard talk. Install 1-3-1 so the next problem comes back as a recommendation. Buy Now is the packaged bundle: four Notion tools plus the matching Claude skills, so you are not assembling the readiness read from blank pages.

    This is the flagship of the Restoration Leadership Toolkit. Everything an owner needs to see whether their team can actually lead, and who to develop next. For growth-stage restoration owners who sense they are the ceiling on their own business.

    What’s in the kit

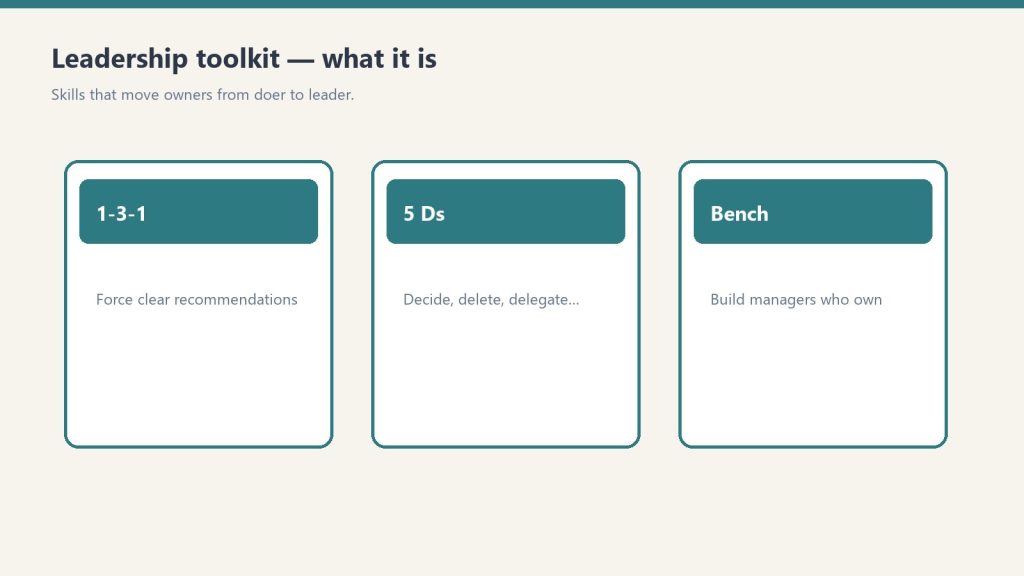
    Three cards for 1-3-1, 5 Ds, and bench building in a leadership toolkit
    Leadership readiness kit — checklists before titles.
    1. Leadership Readiness Checklist
    2. Middle Manager Evaluation Scorecard
    3. Accountability Conversation Planner
    4. 1-3-1 Delegation Worksheet

    The matching skills from the Leadership AI plugin: leadership-readiness-checklist, middle-manager-scorecard, accountability-planner, delegation-1-3-1.

    Run them in this order. The checklist is the scan. The scorecard is the person. The planner is the talk. 1-3-1 is the habit that keeps the next problem from landing back on you.

    1. Leadership Readiness Checklist

    Can your team actually lead, or does everything still run through you? Work six sections. Check only what is truly true today. A box you wish were true is a box left unchecked. Rate each section red / yellow / green. Duplicate the page each quarter so you can watch the bench get stronger.

    1. Current leadership bench. Who leads field production, estimating, project files, sales, office / AR, marketing, finance, hiring. If a function has no owner besides you, that is a finding. Check: every core function has a named owner who is not you; each owner knows they own it; someone besides you can speak for the company to a customer or adjuster; you have at least one true second-in-command, not just a senior doer. Red = it is all me. Yellow = one or two real leaders. Green = a functioning leadership team.

    2. Decision-making. The test of a leader is whether they can make the call when you are not reachable. Clear dollar threshold. Someone can authorize a job, a crew move, or an equipment purchase if you are out a day. When a lead brings a problem, they bring options and a recommendation. You have not reversed a reasonable decision in front of their team in the last 30 days. Red = everything routes to you. Yellow = small stuff yes, real calls no. Green = they own their lane.

    3. Accountability habits. A leader who will not hold the line is a doer with a title. Do leads address underperformance, or do they route it to you? Written standards. Feedback that is not just a task list. Consequences when standards are missed. You are not the only person who delivers hard feedback. Red = you are the only enforcer. Yellow = leads avoid the hard ones. Green = leads own their team’s standards.

    4. Communication rhythm. Leadership runs on cadence, not heroics. Weekly or biweekly leadership / ops meeting that actually happens. Daily or start-of-job huddle. Recurring 1:1s. A known way job status is communicated (not you texting everyone). Meetings produce decisions and owners. Bad news reaches you early. Red = ad hoc / by text. Yellow = some of it, inconsistently. Green = reliable cadence.

    5. Single points of failure. You. The one estimator. The one person who holds carrier relationships. The one person who knows payroll. The one dispatcher. Passwords in one head. No SOP for the things “only so-and-so knows.” For each checked box, name the person, what breaks, and whether a backup exists. Red = several critical SPOFs. Yellow = one or two. Green = cross-covered.

    6. Next leader candidates. Name real people. Rate ready now / 1-2 areas to grow / raw potential. Write the one thing each most needs. Have you actually told your top candidate you see leadership in them?

    Tally last. Mostly green: deepen the bench and formalize succession. Mostly yellow: push decision authority and accountability down a level. Mostly red: you are still the company. The priority is not more hiring. It is building one true second-in-command and removing the biggest single point of failure (usually you). Write three lines: biggest SPOF right now; the one leader to develop next; the first move in the next 30 days.

    2. Middle Manager Evaluation Scorecard

    Restoration technicians training in a shop bay with equipment demo and whiteboard
    Middle manager scorecard — teach, then trust.

    Great doers do not automatically become great leaders. Score the person you named in section 6 before you promote them. One person, one row. Nine traits, 1-5 each. Total is /45.

    1. Ownership. Takes responsibility for outcomes, no blame-shifting.
    2. Communication. Clear, timely, two-way.
    3. Judgment. Makes sound decisions without being told every step.
    4. Emotional maturity. Stays steady under pressure.
    5. Coachability. Seeks and applies feedback, not defensive.
    6. Follow-through. Closes the loop, does what they said by when they said.
    7. Trains others. Can teach a task and bring others up to standard.
    8. Handles conflict. Addresses tension directly and fairly, does not avoid.
    9. Values alignment. Models company values when no one is watching.

    Anchor every score in a recent, specific example. Untested is itself a finding. Do not guess a high score on a trait you have never seen. Bands: Promote about 37-45. Develop first about 27-36. Not yet 26 or below. Override: a 1 or 2 on Ownership, Emotional maturity, or Values alignment caps the recommendation at Develop first, regardless of total. Those are the floors for putting someone over people.

    Name the lowest 2-3 traits. One concrete development action each. A re-eval date, typically 60-90 days. The owner decides. The score is an input, not a verdict.

    3. Accountability Conversation Planner

    Use this when someone keeps missing the mark and you have been avoiding the talk. Ten minutes of prep. Six prompts, then a five-beat script.

    1. What is the actual issue? The pattern, not a single bad day. Business impact.
    2. What specific behavior needs to change? Observable. “Calls in after the crew is already on site,” not “doesn’t care.”
    3. What have I already allowed or tolerated? Where you let it slide or finished their file yourself.
    4. What expectation needs to be clarified? State the standard the way you would want it repeated back.
    5. What consequence or support is needed? Both sides.
    6. What does success look like in 30 days? Concrete. “Zero late starts for four weeks.”

    Script beats: open and set the tone; name the issue and the behavior; own your part; state the expectation and the support; confirm the 30-day target and listen. Private, not on the job site, not by text. This is a planning doc, not a personnel record.

    4. 1-3-1 Delegation Worksheet

    Three panels showing one problem, three options, one recommendation
    1-3-1 worksheet — force a recommendation.

    The old way: “The dehu on Maple St died. What do you want me to do?” You just took back the problem, the thinking, and the decision.

    The 1-3-1 way: one issue (the fork in the road, one or two sentences); three real options with pros, cons, and rough cost (“do nothing” can be one when it is honest); one recommendation and why in one line; a default if they do not hear back by a deadline. Explain it once. Pin it where decisions get made. When someone brings a raw problem, ask: “What are your three options, and which do you recommend?” Then wait. Run at least five real conversations. Approve the recommendation whenever it is reasonable. Phase done when at least one person brings 1-3-1s without being reminded.

    If the Readiness Checklist “options and a recommendation” box is empty, install 1-3-1 before you hire another lead.

    If you want the packaged kit

    You can run the four tools from the outline above. Buy Now is the bundle delivered by email after checkout: the four Notion pages (duplicate each so the master stays clean), plus the matching skills if you want the interviews walked. Same Square button at the top of this page.

    Coaching and operational tools only. Not legal or HR advice. The planner is a planning doc, not a personnel record. The scorecard is decision support, not a hiring, firing, or promotion determination.

    Related on Tygart Media: leadership toolkit · manager scorecard · owner dependency audit.

  • Leadership Readiness Checklist

    Leadership Readiness Checklist

    Leadership Readiness Checklist

    $49

    Delivered by email after checkout.

    Buy Now →

    Secure checkout via Square — all major cards accepted

    You can copy this method and do it yourself. Walk six sections. Check only what is truly true today. Rate each section red / yellow / green. Buy Now is the packaged Notion checklist you duplicate each quarter, so you are not rebuilding the bench read from a blank doc.

    Tool #5 of the Restoration Leadership Toolkit. Can your team actually lead, or does everything still run through you? This is an honest, section-by-section read on your current leadership bench: who leads what, who can decide without you, whether your leads hold their people accountable, your communication rhythm, your single points of failure, and who your next leaders could be.

    Be honest, not optimistic. A box you wish were true is a box left unchecked. Where you see a rating, pick the one that is true today. Where you see a name line, write the actual person. Empty checkboxes are your to-do list. When you are done, the gaps and the single points of failure are your leadership development plan. Duplicate the page for each review. Quarterly is a good cadence.

    1. Current leadership bench. Who leads what today

    Restoration technicians training in a shop bay with equipment demo and whiteboard
    Current leadership bench — who leads what today.

    List the people who currently carry real leadership responsibility, and what they own. If a function has no clear owner besides you, that is a finding. Note it.

    For each function write four lines: who leads it today; whether you still do this; notes.

    • Field production / crews
    • Estimating / scope
    • Project management / job files
    • Sales / lead intake
    • Office / admin / AR
    • Marketing / referral relationships
    • Finance / numbers
    • Hiring / people

    Then check what is actually true:

    • Every core function above has a named owner who is not me
    • Each owner knows they own it (it is explicit, not assumed)
    • At least one person besides me can speak for the company to a customer or adjuster
    • I have at least one true second-in-command (not just a senior doer)

    Bench depth. Pick one: red = it is all me. Yellow = one or two real leaders. Green = a functioning leadership team.

    2. Decision-making capability. Who can decide without you

    Three panels showing one problem, three options, one recommendation
    Decision-making without you — the readiness test.

    The test of a leader is not effort. It is whether they can make the call when you are not reachable.

    • My leads make routine operational decisions without checking with me
    • There is a clear dollar threshold under which leads can spend / approve without my sign-off
    • Someone can authorize a job, a crew move, or an equipment purchase if I am unreachable for a day
    • My team knows which decisions are theirs vs which truly need me
    • When a lead brings me a problem, they bring options and a recommendation, not just the problem
    • I can be out of contact for a full workday and jobs still move forward correctly
    • I have not reversed a lead’s reasonable decision in front of their team in the last 30 days

    Write today’s decision threshold: leads can independently approve up to $______.

    Decision autonomy. Pick one: red = everything routes to me. Yellow = small stuff yes, real calls no. Green = they own their lane.

    The 1-3-1 rule is the habit behind the “options and a recommendation” box. If that box is empty, install 1-3-1 before you hire another lead.

    3. Accountability habits. Do leads hold their people accountable

    A leader who will not hold the line is a doer with a title. This section is about whether accountability lives below you.

    • My leads address underperformance directly. They do not route it to me to fix
    • We have clear, written expectations / standards people are measured against
    • Leads give real feedback (good and corrective), not just task assignments
    • There are understood consequences when standards are repeatedly missed
    • Accountability conversations stay about the behavior/standard, not personal
    • I am not the only person in the company who delivers hard feedback
    • Wins and good work get recognized, not just problems

    Accountability ownership. Pick one: red = I am the only enforcer. Yellow = leads avoid the hard ones. Green = leads own their team’s standards.

    If this section is red or yellow, use the Accountability Conversation Planner for the next hard talk: issue, behavior, what you have already allowed, the expectation, the consequence or support, what success looks like in 30 days.

    4. Communication rhythm. The cadence that keeps it running

    Leadership runs on rhythm, not heroics. Check what actually happens on a schedule, not what you mean to do.

    • We hold a regular leadership / ops meeting (weekly or biweekly) that actually happens
    • Crews get a consistent daily or start-of-job huddle
    • I have recurring 1:1s with my direct leaders
    • There is a known way job status is communicated (not me texting everyone individually)
    • The team knows the company’s priorities for the quarter / season
    • Meetings have a predictable format and produce decisions/owners, not just talk
    • Bad news reaches me early, because people are not afraid to raise it

    Cadence in place (check all that run reliably): daily crew huddle; weekly leadership/ops meeting; recurring 1:1s with leads; monthly numbers / KPI review; quarterly priorities reset.

    Communication rhythm. Pick one: red = ad hoc / by text. Yellow = some of it, inconsistently. Green = reliable cadence.

    Weeks 9-10 of the 90-day plan is this huddle: 15 minutes, fixed agenda, 3-5 numbers someone other than you owns.

    5. Risk areas. Single points of failure

    Where is the business one person, one password, or one bad week away from a problem? Check every box that is a real exposure right now.

    • I am a single point of failure. Key things only I can do or decide
    • Only one person can run estimating / Xactimate
    • Only one person holds key carrier / adjuster / referral relationships
    • Only one person knows the financials, banking, or payroll
    • Only one person can dispatch / schedule crews
    • Critical logins, accounts, or vendor passwords live in one person’s head
    • If my best lead quit tomorrow, a major part of the business would stall
    • There is no written SOP for the things that “only so-and-so knows”
    • No one is cross-trained on my second-in-command’s role

    For each box checked, name the person, what breaks if they are gone, and whether a backup exists.

    Concentration risk. Pick one: red = several critical single points of failure. Yellow = one or two. Green = cross-covered.

    This section pairs with the 5 Ds (Death, Divorce, Disease, Drugs/dependency, Departure/Disaster). A checked box here is usually a blank box on the 5 Ds.

    6. Next leader candidates. Names plus readiness

    Four-phase board covering a 12-week owner freedom transition
    Next leader candidates — names plus readiness.

    Who is next? Name real people, rate how ready they are, and write the one thing each most needs to grow into more leadership.

    For each candidate: name; the role they could grow into; readiness (green = ready now / soon; yellow = 1-2 areas to grow; red = raw potential, long runway); the one thing they most need.

    • I have at least one green ready-now candidate identified
    • Each candidate has a clear next step or development conversation scheduled
    • I have actually told my top candidate I see leadership in them
    • My second-in-command has a developing backup

    Then put those names on a bench list and go deep on one person. A single real manager beats five people you are keeping an eye on.

    Readiness summary

    Tally your six section ratings last.

    • Mostly green. You have a real leadership team. Focus on deepening the bench and formalizing succession.
    • Mostly yellow. Leaders exist but lean on you for the hard calls and the hard conversations. Push decision authority and accountability down a level.
    • Mostly red. You are still the company. The priority is not more hiring. It is building one true second-in-command and removing the biggest single point of failure (usually you).

    Write three lines: my biggest single point of failure right now; the one leader I most need to develop next; the first move I will make in the next 30 days.

    If you want the packaged checklist

    You can run the six sections on a legal pad. Buy Now is the Notion page delivered by email after checkout. Duplicate it (··· → Duplicate) so the original stays clean for next quarter. The function table, the six section ratings, and the summary are already laid out. Same Square button at the top of this page.

    Pairs with the Restoration Leadership Bench Builder (develop the names you just wrote) and the 90-Day Doer-to-Leader Transition Plan. Matching Claude skill: leadership-readiness-checklist. A leadership self-assessment, not legal or HR advice.

    Related: Restoration Leadership Toolkit — Claude Edition. Also Restoration Leadership Bench Builder.

  • 90-Day Doer-to-Leader Transition Plan

    90-Day Doer-to-Leader Transition Plan

    90-Day Doer-to-Leader Transition Plan

    $199

    Delivered by email after checkout.

    Buy Now →

    Secure checkout via Square — all major cards accepted

    You can copy this method and do it yourself. Run six two-week phases. By Week 12 the business runs a notch less on you and a notch more on your people. Buy Now is the packaged Notion plan you duplicate and date, so you are not assembling the 12-week spine from blank pages.

    The capstone of the Restoration Leadership Toolkit. This turns the doer-to-leader message into a plan you actually run. Work it top to bottom. Do not skip ahead. Each phase sets up the next. You cannot clarify decision rights (Weeks 5-6) until you know your bottlenecks (Weeks 1-2).

    How to use this plan

    Four-phase board covering a 12-week owner freedom transition
    90-day arc: bottlenecks first, then rhythm.
    • Duplicate a page and rename it “90-Day Plan – {start date}.”
    • Block 30-45 minutes every Friday to work the current phase and check boxes.
    • Start by running the Owner Bottleneck Self-Assessment and the Owner Dependency Audit. Their results feed Weeks 1-2 directly.
    • Fill the three setup lines before Week 1.

    Write these three lines now:

    • My #1 reason to step back (what I would do with the time)
    • The one person I am betting on as my first real manager
    • Start date / target Week-12 date

    Weeks 1-2. Identify your bottlenecks

    Goal: get brutally honest about where the company still runs through you. You cannot delegate what you have not named.

    1. Run the Owner Bottleneck Self-Assessment and write down your top 3 bottleneck areas.
    2. Run the Owner Dependency Audit. List every decision or task that only you can do today.
    3. For one full week, log every time someone interrupts you for a decision. A tally on your phone is fine.
    4. Sort that list into three buckets: Delegate now / Delegate after training / Keep (truly owner-only).
    5. Circle the top 3 bottlenecks that cost you the most time or money. These are your 90-day targets.
    6. Tell your team what you are doing and why: “I am working a 90-day plan to push decisions down. Expect me to hand more back to you.”

    Phase 1 done when you have a written top-3 bottleneck list and your team knows the shift is coming. The audit rates Low / Med / High across nine areas (sales, production, finance, customer-issue resolution, hiring, vendor relationships, estimating / project management, emergency response, decision rights). Low = 1, Med = 2, High = 3. Total is 9-27.

    Weeks 3-4. Install 1-3-1 conversations

    Three panels showing one problem, three options, one recommendation
    Weeks 3–4: install 1-3-1 conversations.

    Goal: stop being the answer key. Train the team to bring one issue, three options, and one recommendation, so you coach instead of solve.

    1. Explain the 1-3-1 rule to the team: bring 1 issue, 3 options, 1 recommendation. Not just the problem.
    2. Print or pin the 1-3-1 format where decisions get made (truck, office, group chat).
    3. When someone brings you a raw problem, ask: “What are your three options, and which do you recommend?” Then wait.
    4. Run at least 5 real 1-3-1 conversations this phase and approve their recommendation whenever it is reasonable.
    5. Resist solving it yourself, even when you are faster. Let them carry it. This is the hard part.
    6. Note who takes to it quickly. That is a signal for your future-manager pick in Weeks 7-8.

    Phase 2 done when at least one person is bringing you 1-3-1s without being reminded. One issue, three real options (pros, cons, rough cost), one recommendation, and a default if they do not hear back by a deadline.

    Weeks 5-6. Clarify decision rights

    Goal: write down who decides what, and up to what dollar amount, so people stop defaulting to you out of habit.

    1. List the 10-15 recurring decisions your team faces (refunds, equipment, scheduling, scope changes, hiring, pricing exceptions).
    2. For each, write a dollar or scope threshold people can decide under without asking you.
    3. For each, name who owns it when you are not in the room.
    4. Capture it in one simple Decision Rights list (a shared doc or a section on the plan page).
    5. Walk the team through it and tell them: “Under this line, you do not need me. Decide and tell me after.”
    6. Pick one decision you currently own and hand it off completely this phase. Do not take it back.

    Phase 3 done when there is a written decision-rights list and at least one decision has fully left your plate. Starter rows live on the Owner Dependency Audit if you need them.

    Weeks 7-8. Develop one manager

    Restoration technicians training in a shop bay with equipment demo and whiteboard
    Weeks 7–8: develop one manager on real work.

    Goal: go deep on ONE person. A single real manager beats five people you are “keeping an eye on.”

    1. Choose one person to invest in as your first real manager. Use the Middle Manager Evaluation Scorecard if you are torn.
    2. Have a direct conversation: “I want to grow you into running X. Here is what that looks like.”
    3. Hand them one area to own end-to-end (a crew, a job type, scheduling, QC). Outcome, not task.
    4. Set a weekly 30-minute 1-on-1 with them and protect it like a paying job.
    5. Name the 1-2 skills they most need to build and how you will help (ride-along, training, a stretch job).
    6. Let them make a real decision this phase and coach the outcome instead of grading it.

    Open a bench list while you do this. One row per key function: role, current owner, candidate, backup depth, skill gaps, one observable 90-day action, delegation plan, check-in rhythm, status. A blank candidate is itself a finding. Phase 4 done when one person owns one area end-to-end and has a standing 1-on-1 with you.

    Weeks 9-10. Create an accountability rhythm

    Goal: replace you-chasing-everyone with a repeatable cadence that surfaces problems early, without you in the middle of every thread.

    1. Stand up a weekly 15-minute team huddle with a fixed agenda: numbers, jobs at risk, who needs what.
    2. Pick the 3-5 numbers the team reviews every week (jobs in WIP, days-to-dry, AR, callbacks, leads).
    3. Decide who owns each number and reports it. Not you.
    4. Use the Accountability Conversation Planner to prep any hard conversation so it stays about the work, not the person.
    5. Hold one real accountability conversation this phase using that structure.
    6. Have your Week 7-8 manager run the huddle at least once while you sit in and observe.

    Phase 5 done when the weekly huddle runs on schedule and someone other than you can run it. About the work, not the person.

    Weeks 11-12. Review, adjust, and repeat

    Goal: measure what changed, lock in the wins, and set the next 90 days. This is not the end. It is the first turn of the flywheel.

    1. Re-run the Owner Bottleneck Self-Assessment and compare to your Week 1 score.
    2. Take a planned half-day fully off and note what broke or escalated to you. That is your next bottleneck.
    3. List what got delegated successfully vs what bounced back to you, and why it bounced.
    4. Give your developing manager direct feedback on the quarter and agree on next-quarter goals.
    5. Update your Decision Rights list and raise one threshold now that the team has proven itself.
    6. Pick next quarter’s top bottleneck and start a fresh 90-day cycle (duplicate the page again).

    Phase 6 done when you have re-scored, taken real time off, and named the next quarter’s target.

    Success looks like

    By the end of 90 days, a healthy transition looks like:

    • You can take a full day off without the business stalling or your phone melting.
    • Your team brings you 1-3-1 recommendations, not raw problems to solve.
    • There is a written decision-rights list, and people decide under the line without asking.
    • One person owns one area end-to-end and has a standing 1-on-1 with you.
    • A weekly huddle runs on cadence, and someone other than you can run it.
    • Your re-scored bottleneck number is lower than it was in Week 1.
    • You have already named next quarter’s target, because doer-to-leader is a flywheel, not a finish line.

    Not every box will be checked, and that is fine. Progress on the top-3 bottlenecks matters more than a perfect scorecard. Run it, adjust, repeat.

    While you are in it, run the 5 Ds as a what-if-tomorrow check. Pick the three blank boxes that would hurt most if the D hit tomorrow.

    If you want the packaged plan

    You can run the six phases from the outline above. Buy Now is the Notion page delivered by email after checkout. Duplicate it (··· → Duplicate) and rename it with the start date so the master stays clean. The setup lines, the phase checkboxes, and the success list are already laid out. Same Square button at the top of this page.

    The other four tools in the Owner Freedom Kit feed this spine: Owner Dependency Audit, Restoration Leadership Bench Builder, 5 Ds Succession Risk Checklist, 1-3-1 Delegation Worksheet. Matching Claude skill: doer-to-leader-90-day. Coaching and operational tool only. Not legal or HR advice.

    Related: Restoration Leadership Toolkit — Claude Edition. Also Owner Bottleneck Self-Assessment.

  • Tacoma Workforce Training: Building Pierce County Talent

    Tacoma Workforce Training: Building Pierce County Talent

    If you run a manufacturing shop in Frederickson, a clinic on the Hilltop, or a logistics operation near the Port, you already know the hardest part of growing in Pierce County isn’t demand — it’s people. The good news, and it doesn’t get nearly enough ink, is that Tacoma sits on top of one of the most layered post-secondary talent pipelines in the South Sound. Between a technical college that trains apprentices in six state-approved trades, a second technical college that opened a brand-new community campus in 2025, a private university quietly graduating nurses into a chronically short-staffed sector, and a public research university downtown, the machinery to staff this city’s growth is already humming. The trick for local employers is knowing how to plug into it.

    This is the higher-ed and apprenticeship layer of the story — distinct from the K-12 pipeline and the new Maritime 253 program that Tacoma Public Schools opened in September 2026 (tacomaschools.org). Here’s how the colleges feeding Tacoma’s economy are positioned for the 2026-27 academic year, and where the real openings are.

    Bates Technical College: The Apprenticeship Backbone

    Bates Technical College, anchored at its downtown campus at 1101 S. Yakima Ave, is the closest thing Tacoma has to a dedicated trades-and-apprenticeship engine. Bates works with six Washington State-approved apprenticeship training partners spanning fields from aerospace to construction. The model is the part employers tend to underrate: apprentices earn wages at a percentage of the journey-level rate while they work in the field, then attend classes part-time — usually evenings — for one to five years. On completion they receive a journeyman-level certificate from the Washington State Department of Labor & Industries Apprenticeship & Training Council (batestech.edu).

    That earn-while-you-learn structure is exactly what cash-strapped young workers and budget-conscious employers both need. Eligibility is deliberately wide: typically a high school diploma or GED, a minimum age of 16, and the aptitude to complete the program.

    The AJAC Manufacturing Academy Lands at Bates

    The most concrete near-term opportunity sits inside Bates’ downtown campus. The Aerospace Joint Apprenticeship Committee (AJAC) runs its no-cost Pierce County Manufacturing Academy there, where its 2026 cohort ran April 1 through June 10, 2026. The next class runs January 12 through March 24, 2027, meeting 8:00 a.m. to 2:00 p.m. (ajactraining.org). The academy is hands-on prep that funnels graduates toward registered apprenticeships — including aerospace machinist roles — backed by AJAC’s Career Navigation Team. AJAC partners with more than 40 manufacturing companies in Pierce County alone, building products for aerospace, defense, automotive, medical, food processing, and plastics. For a region trying to capitalize on the manufacturing magnet forming in Frederickson, that’s a direct conveyor belt from classroom to shop floor. Requirements are straightforward: Washington residency, 18 or older, legal authorization to work in the U.S., and full attendance.

    Clover Park Technical College: Scale, Aviation, and a New Front Door

    Just down I-5 in Lakewood, Clover Park Technical College (CPTC) brings the scale. CPTC offers more than 120 certificate or degree options across seven schools — Aerospace & Aviation; Automotive & Trades; Advanced Manufacturing; Business & Personal Services; Health & Human Development; Nursing; and Science, Technology, Engineering & Design (cptc.edu). Its aviation program runs out of the South Hill Campus near Thun Field, feeding graduates toward major and regional airlines, repair stations, and aircraft component manufacturers.

    CPTC also broke ground on credential ladders early: it was the first two-year college in Pierce County to offer a baccalaureate degree, the Bachelor of Applied Science in Manufacturing Operations. That matters because it lets a worker start as a mechatronics technician and climb to a four-year applied degree without leaving the regional system.

    The Eastside Training Center: College Comes to the Neighborhood

    The newest development is geographic. In January 2025, CPTC opened the Eastside Training Center at East 60th and McKinley Avenue in Tacoma, in partnership with WorkForce Central and the City of Tacoma (blog.cptc.edu). The center deliberately targets communities that haven’t traditionally been well served by higher education, blending CPTC’s skills training with WorkForce Central services that connect job seekers, employers, and community organizations under one roof. Early programming includes HVAC training and Running Start access for high schoolers. For Tacoma’s East Side, it’s the difference between a 30-minute drive to Lakewood and a walkable front door.

    The Invista-to-CPTC Corporate Education Shift Employers Should Know About

    Here’s a piece of institutional history that still trips up local business owners. Invista Performance Solutions — the long-running collaboration of Pierce County community and technical colleges that delivered customized employer training in lean process improvement, leadership, ESL, and industrial skills — was formally dissolved on June 30, 2023. Clover Park Technical College, Pierce College District, and Tacoma Community College ended the limited liability partnership, and Invista’s training professionals were brought on directly at CPTC (choosetacomapierce.org).

    What that means in practice: if you’re an employer who used to call “Invista” for a custom training contract, that capacity now lives inside Clover Park Technical College Corporate Education. The offerings — and crucially, access to Washington State’s Job Skills Program (JSP) matching grant, which can offset the cost of training built to your company’s specific needs — carried over. If your last conversation about workforce training predates mid-2023, it’s worth a fresh call.

    Pacific Lutheran University: The Nursing and Business Pipeline

    On the private side, Pacific Lutheran University (PLU) plays a different but essential role. PLU offers more than 40 undergraduate majors and graduate programs across business, education, kinesiology, marriage and family therapy, and nursing, with a total undergraduate enrollment of 2,446 as of fall 2024 (plu.edu). For a regional economy fighting a healthcare staffing shortage, PLU’s School of Nursing is the standout. It runs a traditional BSN and an Entry-Level Master of Science in Nursing (ELMSN) on the Tacoma campus, plus an accelerated BSN in Lynnwood — all accredited by the Commission on Collegiate Nursing Education (plu.edu/nursing). Those graduates feed directly into MultiCare, CHI Franciscan, and the rest of the South Sound’s clinical employers.

    UW Tacoma: The Four-Year Anchor Downtown

    The University of Washington Tacoma is the research-university anchor of the whole system, with seven schools offering more than 50 undergraduate majors and minors and 15 graduate degree programs, including engineering and technology tracks that align with the region’s advanced-manufacturing and tech ambitions (tacoma.uw.edu). One programmatic note for prospective students: UW Tacoma’s Educational Administration program is on pause from summer 2026 to summer 2028 and is not admitting new students during that time; the school refers interested educators to UW Bothell’s Leadership Development for Educators program (tacoma.uw.edu).

    Reading the Enrollment Tea Leaves

    Zoom out and the statewide context shapes what local employers can expect. Washington’s community and technical college system — 34 colleges overseen by the State Board for Community and Technical Colleges (SBCTC) — trains roughly 307,000 people a year for the workforce, transfer, or continuing education (sbctc.edu). Enrollment dropped sharply during the 2020 pandemic and has held steady with modest gains since, though it hasn’t fully returned to pre-pandemic peaks. Community college baccalaureate programs tell the same story — a slight rebound, with certain career clusters gaining share even as the overall number lags.

    The takeaway for Tacoma employers is counterintuitive but useful: a system running below its enrollment peak is a system with capacity. The seats and the training infrastructure exist; the constraint is awareness and the willingness of local companies to build the partnerships — apprenticeship sponsorships, custom training contracts, internship pipelines — that turn classroom capacity into hired workers.

    What This Means for Pierce County Business

    The pieces of Tacoma’s talent engine don’t always talk to each other, but together they cover the map: Bates and AJAC for the skilled trades and manufacturing apprentices, CPTC for aviation, advanced manufacturing, and employer-customized training, PLU for nursing and business, and UW Tacoma for the four-year and graduate anchor. The employers who win the next few years won’t be the ones who post the most job ads. They’ll be the ones who pick up the phone — to AJAC’s career navigators, to CPTC Corporate Education, to a Bates apprenticeship coordinator — and build a pipeline before they need it.

    Frequently Asked Questions

    What is the AJAC Manufacturing Academy and when is the next Tacoma class?

    The AJAC Manufacturing Academy is a free, hands-on manufacturing training program that prepares students for registered apprenticeships and manufacturing jobs. The next Pierce County class runs January 12 through March 24, 2027, from 8:00 a.m. to 2:00 p.m. at Bates Technical College’s downtown campus (1101 S. Yakima Ave, Tacoma). Applicants must be Washington residents, 18 or older, and legally authorized to work in the U.S.

    What happened to Invista Performance Solutions?

    Invista Performance Solutions was dissolved on June 30, 2023, when Clover Park Technical College, Pierce College District, and Tacoma Community College ended the limited liability partnership. Its training staff were hired directly by Clover Park Technical College, and the employer-training function now operates as CPTC Corporate Education — including access to Washington’s Job Skills Program matching grant.

    Where can Tacoma residents get apprenticeship training?

    Bates Technical College is the primary apprenticeship hub in Tacoma, working with six Washington State-approved apprenticeship partners across trades from aerospace to construction. Apprentices earn wages while they work and attend part-time classes, finishing with a state-recognized journeyman-level certificate after one to five years.

    Which Tacoma-area college offers a four-year manufacturing degree?

    Clover Park Technical College was the first two-year college in Pierce County to offer a baccalaureate degree — the Bachelor of Applied Science in Manufacturing Operations — letting students advance from a technician credential to an applied four-year degree within the regional system.

    What is the Clover Park Eastside Training Center?

    The Eastside Training Center is a Clover Park Technical College campus that opened in January 2025 at East 60th and McKinley Avenue in Tacoma, in partnership with WorkForce Central and the City of Tacoma. It brings skills training and workforce services to Tacoma’s East Side, an area historically underserved by higher education, with programming such as HVAC training and Running Start.

    Reporting reflects publicly available information from each institution as of June 2026; the AJAC class dates, the Maritime 253 opening, and the UW Tacoma program pause were updated in October 2026. Program dates, eligibility, and offerings can change — confirm details directly with the school before enrolling.

  • The Restoration Hiring Roadmap: Which Seat to Fill First as You Scale From $1M to $5M

    The Restoration Hiring Roadmap: Which Seat to Fill First as You Scale From $1M to $5M

    The hardest org-chart decision in restoration is not who to hire. It is what order to hire them in. Get the sequence wrong and you spend money on a seat that doesn’t relieve the bottleneck — while the real constraint, almost always you, keeps strangling growth.

    Most owners build their team reactively. A big loss comes in, they’re underwater, so they grab whoever is available — usually another tech. Six months later they have more trucks and the same problem: every job, every estimate, and every collections call still routes through the owner. They added capacity to the field and zero capacity to the bottleneck.

    Here is the honest sequence — the one that actually pulls the owner out of the truck — mapped to the revenue milestones where each hire pays for itself.

    First, Find Your Real Bottleneck (It’s Probably You)

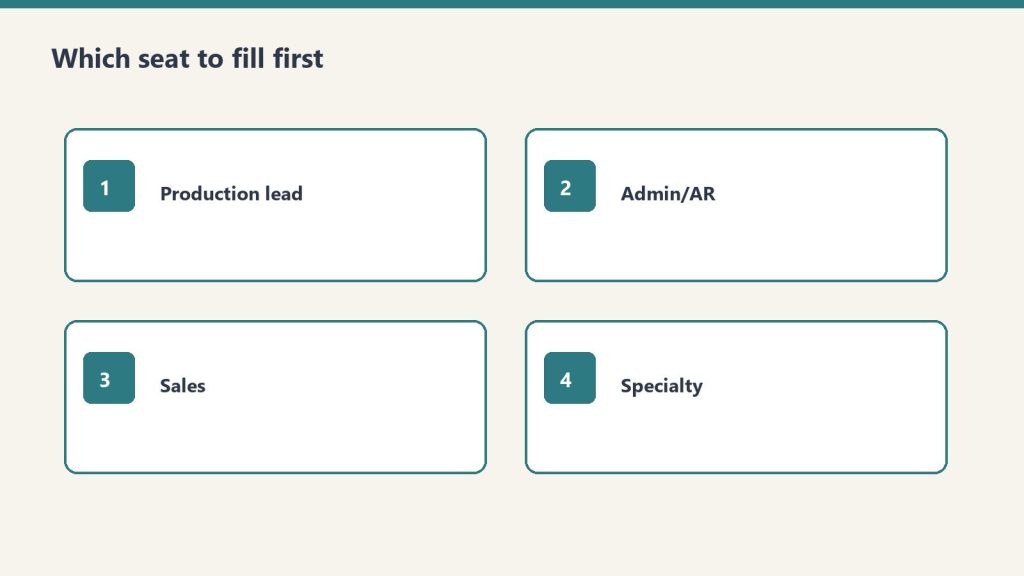
    Four hire-order cards: production lead, admin/AR, sales, specialty
    Find the real bottleneck before you hire more techs.

    Before you hire anyone, do the boring exercise. List every function the company performs — answer the phone, dispatch, scope the loss, write the estimate, run the crew, order equipment, invoice the TPA, chase payment, do payroll. Next to each one, write the name of who actually does it. Count how many times your own name appears. That number is your bottleneck, and the first hire should remove the most expensive, most repeatable item from your list — not the one you enjoy least.

    The trap is hiring for relief instead of leverage. Hiring a third tech feels good because the trucks are full. But if you are still the only person who can scope a loss and write a winning estimate, those trucks just create more work that funnels back to you.

    $0–$1M: You and a Lead Tech

    At startup scale, the org chart is two boxes: you and a strong lead technician. You are the estimator, the PM, the dispatcher, and the collections department. That’s fine — and unavoidable — at this stage. The rule of thumb most operators use is roughly $150,000–$200,000 in annual revenue per field technician before adding the next one, because that’s the point where there is genuinely enough work to keep another body busy and billable.

    The mistake here is hiring a second tech too early to look bigger than you are. Idle techs are the fastest way to torch a thin startup margin.

    $1M–$2M: The First Office Hire — Not Another Tech

    Four-phase board covering a 12-week owner freedom transition
    First office hire — not another tech — unlocks the owner.

    This is the milestone where most owners hire wrong. They add a second or third tech when the seat that actually frees them is administrative. An office coordinator or office manager who owns scheduling, job-file documentation, TPA paperwork, and the collections follow-up is the single highest-leverage hire at this stage. Restoration office and administrative coordinator roles commonly run in the $45,000–$60,000 range depending on market, and that one seat can claw back ten to fifteen owner-hours a week — hours you can redirect into estimating and sales, which are the only two activities that grow revenue.

    The math is simple. If you are personally billing $150-plus per estimating hour and you hand off twelve hours of admin a week to a $55,000 coordinator, the hire pays for itself almost immediately and converts owner time into top-line growth.

    $2M–$3.5M: A Dedicated Estimator / Project Manager

    Once admin is covered, the next thing chained to the owner is almost always scoping and estimating. This is the hardest seat to give up because it feels like the part only you can do — and at first, it is. But a $2M shop cannot scale on a single estimator who is also the CEO.

    Hire a restoration estimator/PM who can scope a loss, write the Xactimate estimate, and manage the job to completion. Expect this to be one of your more expensive seats: restoration project manager and estimator compensation broadly lands in the $60,000–$90,000 range nationally, with experienced, supplement-savvy PMs commanding more in tight labor markets. Plan for a ramp — a new PM rarely writes estimates as tight as an experienced owner on day one, and supplement recovery may dip during the handoff before it recovers.

    This is also where your tech stack starts to matter. If your estimating, job management, and TPA reporting all live in the owner’s head or a spreadsheet, the new PM can’t be effective. The hire and the system have to land together.

    $3.5M–$5M: An Operations Manager and the Owner Comes Off the Truck

    Three panels showing one problem, three options, one recommendation
    Ops manager stage: owner comes off the truck on purpose.

    By this stage you should have a small bench: lead techs, an office manager, and at least one PM/estimator. The seat that defines a $5M shop is an operations manager — someone who is not you and, ideally, not a relative — who owns daily execution: dispatch, crew utilization, equipment, and job throughput. Restoration operations manager pay broadly runs from roughly $63,000 on the lower end to around $89,000-plus for experienced managers, depending heavily on market and revenue scale.

    This is the hire that lets the business survive without the owner physically present. It is also the one that most directly changes what the company is worth. Restoration shops under about $2M tend to trade at roughly 2.8x–3.0x SDE, while companies that cross $5M with a diversified service mix and a real second layer of leadership command 4x–7x EBITDA. Buyers aren’t paying that premium for revenue — they’re paying for an operation that runs without the founder in the dispatch seat. The operations manager is what makes that true.

    A Sanity Check on Labor Cost

    As you build the team, keep the whole picture in view. Healthy restoration shops generally run blended gross margins in the 50–75% range depending on mix — water mitigation sits at the high end (roughly 70–80%) because equipment does much of the work, while reconstruction and fire work run leaner. Well-run operations keep total operating expense, excluding direct job cost, in the rough range of 40–55% of revenue. If a new hire pushes overhead past that band without a clear path to more billable throughput, you’ve hired ahead of your revenue — slow down and fill the pipeline before you fill the seat.

    The Bottom Line

    The order is admin, then estimator/PM, then operations manager — and only more techs as billable volume genuinely demands them. Hire to remove yourself from the bottleneck, not to make the trucks look full. The owners who hit $5M and sell at a 4x-plus multiple are not the ones who hired the most people fastest. They’re the ones who hired the right seat next, every time, until the day the business no longer needed them in the truck.

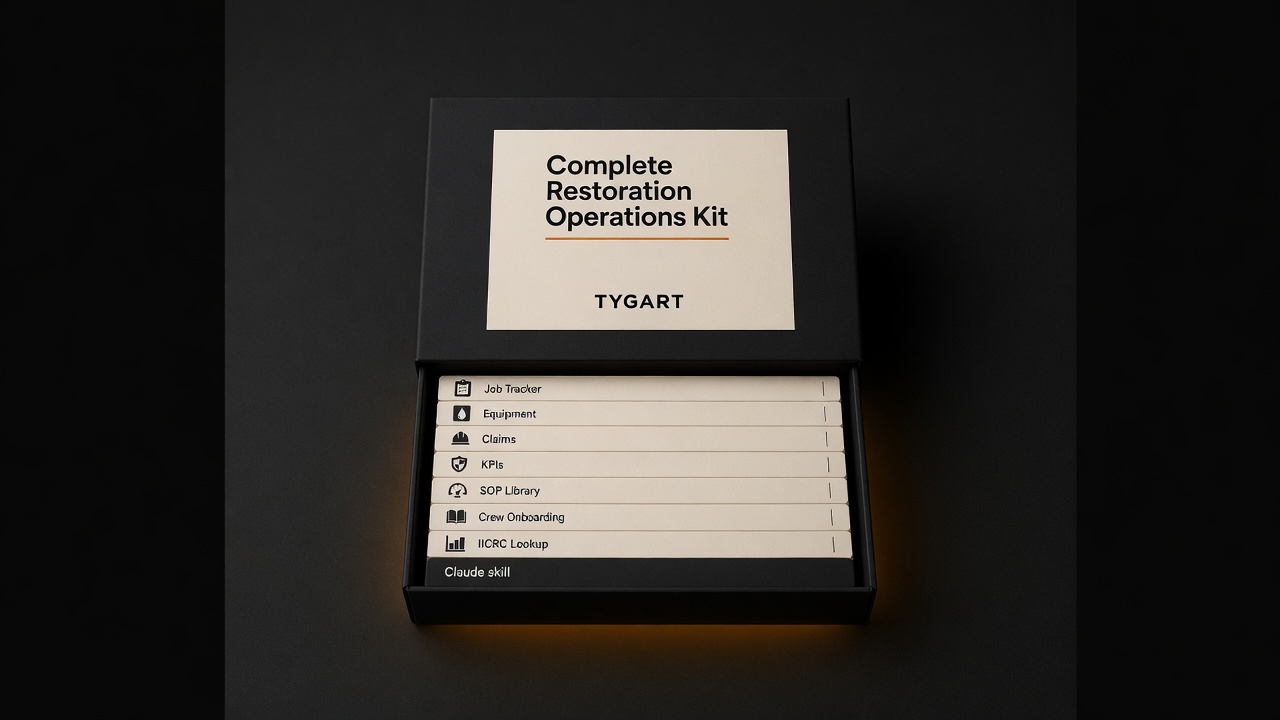
    If you’re still running the whole company from the van, the Complete Restoration Operations Kit gives you the connected job tracker, equipment, claims, SOPs, KPIs, and crew tools that make those hires actually stick. Pair it with the Restoration Leadership Toolkit — Claude Edition when you’re ready to build the bench that lets you step out of the truck.

  • Tacoma City Budget Reset: Closing the $24 Million Gap

    Tacoma City Budget Reset: Closing the $24 Million Gap

    When the Tacoma City Council gaveled through its Mid-Biennium Budget Modification on October 28, 2025, it did something every business owner in Pierce County understands intuitively: it looked at the books halfway through the cycle, saw that the numbers had moved, and adjusted before the gap got worse. For a $4.7 billion organization, that is not a small course correction. It is the difference between a managed slowdown and a crisis.

    If you run a storefront on Pacific Avenue, manage a warehouse in the Tideflats, or sign the checks for a contracting crew that bids on city work, the way Tacoma balanced its 2025-2026 budget at the midpoint tells you a great deal about the next eighteen months. Here is what actually changed, why it changed, and what it means for the people who keep this city’s economy moving.

    The Numbers Behind Tacoma’s 2025-2026 Budget

    Tacoma operates on a two-year (biennial) budget. The 2025-2026 plan that the Council adopted in December 2024 totaled roughly $4.7 billion across all funds, with about $635 million committed to the General Fund — the discretionary pot that pays for police, fire, parks, libraries, and the day-to-day services residents actually touch.

    That General Fund figure is worth sitting with. At roughly $635 million for the biennium, it represents about a 4% increase over the $615.2 million in the 2023-2024 budget and a 21% jump from the 2021-2022 cycle, according to the city’s Budget in Brief. Spending has been climbing steadily. The question Tacoma had to answer in October was whether revenue could keep pace — and the honest answer was that it could not, at least not without adjustments.

    Why a Mid-Biennium Modification Was Necessary

    Washington cities are required to revisit their budgets at the midpoint of each biennium. But Tacoma’s 2025 modification was driven by more than statutory housekeeping. The city was staring down a structural deficit — the built-in gap between ongoing costs and the revenue that reliably comes in to cover them.

    Reporting from The Center Square pegged that lingering gap at roughly $24 million as the city worked through its planning. To close it, the city leaned on a mix of staff reductions and one-time savings: about $5.6 million was tied to 26 position cuts, most of them filled rather than vacant, with another $1.4 million pulled from projected vacancy savings. Even after those moves, the city still had to identify additional cuts to bring the ledger into balance.

    This is the part local operators should not gloss over. A structural deficit is not a one-time hole you patch and forget. It signals that the city’s baseline obligations — wages, benefits, contracts, debt service — are growing faster than its baseline revenue. When that happens, the pressure does not disappear after one budget cycle. It carries forward, and it shapes how aggressively the city pursues fees, taxes, and code enforcement in the years ahead.

    Where the Money Is Going: Public Safety Leads

    Even with the belt-tightening, Tacoma protected its core. Roughly two-thirds of the General Fund goes to the Police and Fire departments, and the adopted budget added funding to both, according to the city’s budget materials. The mid-biennium modification continued that emphasis, directing money toward public safety, community health, and housing stability while pushing for internal efficiencies elsewhere.

    The city also folded in newer approaches to safety. Alternative response programs — sending the right responder to the right call rather than defaulting to an armed officer for every situation — remained a funded priority, alongside resources for mental health and chemical dependency treatment and enhanced crisis intervention. For business owners in districts that deal with street-level challenges, these programs are not abstractions. They shape how quickly a call gets answered and what kind of help shows up.

    Capital Projects and the Six-Year Horizon

    Tacoma plans its big-ticket investments — road reconstruction, facility upgrades, utility infrastructure — through a six-year Capital Facilities Plan. The 2025-2030 CFP lives inside the larger budget book and represents the city’s long-range bet on where physical investment should flow.

    The mid-biennium modification touched the capital side as well, with the Council adopting both operating and capital budget ordinances to reflect new grants, revised revenue projections, and updated Council priorities. New grant dollars matter enormously here: when the city captures outside funding for a watershed, a corridor, or a facility, those dollars stretch local money further and often open bid opportunities for Pierce County contractors. If your firm does any work that touches public infrastructure, the CFP is the document you should be reading before your competitors do.

    The Liability Fund and Other Quiet Line Items

    Not every budget adjustment grabs headlines, but some carry real weight. Among the larger new expenses in the modification was an additional roughly $8 million directed to the city’s third-party liability fund — the reserve Tacoma draws on to cover claims and settlements against the city. A growing liability reserve is a defensive line item; it reflects either rising claim costs, a deliberate move to shore up reserves, or both. Either way, it is $8 million that cannot go to a new program, and it underscores how much of a modern municipal budget is consumed by obligations that have nothing to do with new services.

    What This Means for Tacoma Businesses

    Strip away the accounting language and a few practical signals emerge for anyone operating in Tacoma or the broader Pierce County market.

    First, revenue pressure tends to flow downhill. When a city faces a structural deficit, it scrutinizes every revenue stream — including the business and occupation (B&O) tax, sales tax remittances, and licensing fees that local employers pay. Tacoma’s combined sales tax rate sits at 10.4% for 2026, near the top of the state. That rate shapes consumer behavior and your margins, and in a tight budget year the city has little appetite for cutting it.

    Second, the public-safety emphasis is a stabilizing signal. A city that protects police, fire, and alternative-response funding even while cutting elsewhere is one that understands a safe commercial district is an economic asset, not a line item to gut. That is a reasonable bet for business owners to factor into their own location and investment decisions.

    Third, the grant-funded capital pipeline is where opportunity lives. The contractors and suppliers who track the Capital Facilities Plan and the city’s active projects portal position themselves for work that the rest of the market only learns about after the bid closes.

    Frequently Asked Questions

    What is Tacoma’s total 2025-2026 budget?

    Tacoma’s 2025-2026 biennial budget totals roughly $4.7 billion across all funds, with approximately $635 million allocated to the General Fund that pays for core services like police, fire, parks, and libraries. The budget was originally adopted by the City Council in December 2024 and modified at the midpoint in October 2025.

    What was the Mid-Biennium Budget Modification?

    It was a set of operating and capital budget ordinances the City Council adopted on October 28, 2025, amending the 2025-2026 budget to reflect updated revenue and expense projections, new grants, and revised Council priorities. The modification emphasized public safety, community services, and infrastructure while addressing the city’s structural deficit.

    How big is Tacoma’s budget deficit?

    The city was working through a structural deficit estimated at roughly $24 million — the gap between ongoing costs and ongoing revenue. To help close it, Tacoma cut about 26 positions (saving roughly $5.6 million) and applied additional one-time savings, while still needing to identify further reductions.

    Did Tacoma cut public safety funding?

    No. Despite the deficit, the city preserved and in some areas increased public safety funding. Roughly two-thirds of the General Fund goes to the Police and Fire departments, and the budget continued investing in alternative response programs and crisis intervention services.

    How can local contractors find Tacoma capital project opportunities?

    Tacoma plans capital investments through its six-year Capital Facilities Plan, available in the city budget book, and publishes active work through its projects portal at projects.tacoma.gov. Monitoring both — along with new grant awards announced in budget modifications — is the most direct way for Pierce County firms to spot upcoming bid opportunities.


    Reporting compiled from City of Tacoma budget documents, the October 2025 Mid-Biennium Budget Modification, and local coverage by The Center Square and Hoodline. Figures reflect the city’s published budget materials as of the 2025-2026 biennium.

  • Tacoma Power’s Clean Energy Buildout: Cushman II Turbines, EV Charging Expansion, and the Green Hydrogen Rate Reshaping Pierce County

    If you spend any time tracking Pierce County’s economic development conversations, you’ll notice that Tacoma Power keeps coming up — not just as a utility, but as an active player in where jobs land, which industrial tenants choose Tacoma, and how the city positions itself inside Washington’s accelerating clean energy mandate. In 2026, that role is getting harder to ignore.

    Three concurrent initiatives are reshaping what Tacoma Power looks like heading into the next decade: a major turbine refurbishment at the Cushman II hydroelectric facility that will keep the dam running for another century, an EV charging buildout targeting 85 public ports by year-end, and a first-in-the-nation green hydrogen tariff that has put Tacoma on the radar of electrolysis companies from Europe to the Pacific Rim. Each thread is worth pulling on independently. Together, they tell a story about a municipal utility actively engineering its future rather than waiting for state policy to dictate it.

    Cushman II: A 96-Year-Old Dam Gets a 100-Year Extension

    The Cushman II hydropower plant sits in Mason County, just west of the Pierce County line on the Skokomish River system — close enough that Tacoma residents have been drawing power from it since 1930. The facility’s three turbine-generator units produce a combined 81 MW, enough renewable electricity to serve approximately 40,500 Northwest homes. That output has been reliable, but the hardware is aging. Tacoma Power moved to address that head-on.

    In late 2023, Tacoma Power selected GE Vernova’s Hydro Power business to refurbish two of the three 27 MW turbine-generator units. The scope covers new generator stators, refurbishment of rotor poles and shaft thrust bearings, replacement of turbine distributors, and rehabilitation of the turbine runners and draft tubes. As of mid-2026, the project remains on schedule for completion this year, according to public reporting from Renewable Energy World and the American Public Power Association.

    The expected outcome: increased availability and reliability at a plant that provides the foundational renewable generation underpinning Tacoma Power’s carbon-free supply mix. Hydroelectric power already constitutes the overwhelming majority of Tacoma Power’s generation portfolio — a structural advantage that becomes more valuable as Washington’s Clean Energy Transformation Act tightens requirements on utilities statewide.

    Why Dam Maintenance Is a Business Story, Not Just an Engineering One

    Every megawatt-hour that Cushman II produces is a megawatt-hour Tacoma Power doesn’t have to source from the market. For industrial customers — the manufacturers, data centers, and electrolysis operators the city is actively recruiting — rate stability is a primary site-selection criterion. A more reliable Cushman II means a more predictable cost base for everyone on the system. For Pierce County economic development, that’s not a footnote. It’s a selling point.

    EV Charging: 85 Ports and a Rebate Program Worth Understanding

    Washington’s electric vehicle adoption rate ranks among the highest in the nation, and Pierce County’s charging infrastructure is scrambling to keep pace. Tacoma Power is targeting 85 public charging ports by the end of 2026, including additions to its DC Fast Charging network — stations capable of adding 100+ miles of range in roughly 20 minutes.

    The buildout is complemented by one of the more thoughtfully designed utility rebate programs in the state. Through Tacoma Power’s Community EV Charging Rebate, businesses and multifamily property owners installing Level 2 networked chargers can receive $5,000 per port, capped at $50,000 per project. Projects in designated underserved or overburdened areas qualify for enhanced incentives: $10,000 per port, up to $70,000 total. The equity lens embedded in that tiered structure reflects both federal program requirements and a genuine local priority — parts of South Tacoma and East Tacoma have historically been underserved by charging infrastructure despite high rates of commuter vehicle dependency.

    Non-networked Level 2 chargers remain eligible for a $2,000 per-port rebate, capped at $15,000. Tacoma Power also covers utility infrastructure upgrade costs up to $10,000 for networked projects or $7,000 for non-networked ones — a detail that matters for older commercial properties where panel capacity is the real barrier to charger installation.

    Residential Customers Are In the Mix Too

    For Tacoma Power residential customers, the rebate structure is simpler: up to $600 in bill credits for installation of a qualifying Level 2 charger, smart splitter, or 240-volt outlet. Paired with Washington’s existing sales tax exemption on EV purchases and federal IRA incentives, the stacked value proposition for a Pierce County resident going electric in 2026 is meaningfully better than it was two years ago.

    One note: as of this writing, the Community EV Charging Rebate program’s funding is temporarily paused, but Tacoma Power is accepting applications in priority order for when funding resumes. If you’re a business or property manager planning an installation, getting your application in now preserves your place in line.

    The Green Hydrogen Tariff: Tacoma’s National First Is Still Drawing Interest

    Of all Tacoma Power’s clean energy programs, the electrofuels tariff is the one that generates the most interest from outside Pierce County. When the utility’s board approved the rate in December 2020 and it went into effect in April 2021, Tacoma Power became the first consumer-owned utility in the United States to offer a rate specifically designed for green hydrogen producers.

    The mechanics are straightforward. Industrial customers operating electrolyzers — equipment that uses electricity to split water into hydrogen and oxygen — can access a discounted energy rate of $0.033147/kWh and a demand rate of $5.72/kW-month, plus a monthly administrative charge of $7,445. In exchange, Tacoma Power reserves the right to curtail service up to 1,300 hours per year — about 15% of annual hours — with just 10 minutes’ notice.

    That interruptibility is the key. Green hydrogen production via electrolysis is inherently flexible: you can dial it up when cheap, surplus hydroelectric power is available and ramp it down when the grid is constrained. From Tacoma Power’s perspective, it’s demand response at industrial scale. From an electrolyzer operator’s perspective, it’s access to some of the cleanest and most affordable power in the country, from a utility whose generation is overwhelmingly carbon-free.

    According to Utility Dive, since the tariff launched Tacoma Power has fielded numerous inquiries from domestic and international companies considering locating electrolysis operations in its service territory. The Blue Sky Maritime Coalition has also flagged Tacoma’s green hydrogen potential in the context of decarbonizing Puget Sound ferry and port operations — a use case that would put Pierce County at the intersection of maritime decarbonization and clean power production.

    Why the Rate Structure Matters for Pierce County Jobs

    An electrolyzer operation large enough to be commercially meaningful might draw 10–50 MW continuously. At Tacoma Power’s electrofuel rate, that’s a significantly lower operating cost than what industrial customers pay in most U.S. markets — and the power comes from a utility whose carbon intensity is near zero. For companies with clean-fuel mandates from European automotive OEMs, aerospace supply chains, or Port of Tacoma shipping customers, that combination is genuinely differentiated.

    The Port of Tacoma handled over 2.6 million TEUs in recent years and sits adjacent to one of the only U.S. utility territories with a purpose-built green hydrogen industrial rate. The alignment between Tacoma Power’s tariff structure and the port’s long-term decarbonization obligations deserves more local attention than it typically receives.

    Washington’s Clean Energy Mandate and Tacoma Power’s Compliance Roadmap

    Washington’s Clean Energy Transformation Act requires all utilities to eliminate coal power by 2025 and achieve 100% clean electricity by 2045. For most utilities in the state, that’s a heavy lift. For Tacoma Power, it’s closer to a formality — the utility’s hydroelectric-dominated generation mix is already more than 90% carbon-free.

    That doesn’t mean there’s no work ahead. Tacoma Power is currently developing its 2026 Integrated Resource Plan, a 20-year roadmap required under state law that guides resource investment decisions. The IRP will determine how Tacoma Power balances load growth from electrification — EVs, heat pumps, potential hydrogen facilities — against its existing hydro resource base and any new generation it needs to acquire. Rate adjustments effective April 1, 2026 reflect the cost pressures of that transition; Tacoma Power’s board-approved rate schedule is publicly available through mytpu.org.

    Community Solar: The Gap Between Potential and Availability

    One area where Tacoma Power has room to grow is community solar — shared programs that allow renters and homeowners without suitable rooftops to subscribe to a portion of an off-site solar array and receive bill credits. Tacoma Power’s original offering, launched in 2016 with 300 kW across four arrays on the TPU campus, sold out quickly — a clear signal of unmet demand.

    Washington State’s Community Solar Expansion Program has since reached $25 million in obligated funding for the FY2026–FY2029 biennium, per Washington State Department of Commerce reporting, creating financial pathways for utilities to expand shared solar access. For a city with a significant renter population and substantial multifamily housing stock, community solar is one of the cleaner equity tools available. Whether Tacoma Power moves aggressively on that opportunity in the next IRP cycle will be worth watching.

    The Bigger Picture: Tacoma Power as Economic Development Asset

    Municipal utilities don’t often get framed as economic development assets, but Tacoma Power increasingly functions as one. The combination of low-carbon hydroelectric power, a first-in-the-nation green hydrogen tariff, competitive industrial rates, and an EV infrastructure buildout gives Pierce County something genuinely differentiated to market to site selectors and clean-industry investors.

    The Cushman II refurbishment isn’t just about keeping the lights on — it’s about preserving the generation reliability that makes the electrofuel rate credible to international industrial customers evaluating a 20-year facility investment. The EV charging buildout isn’t just about convenience — it’s about making Tacoma a viable destination for a workforce that is increasingly buying electric vehicles and expects charging at work, at multifamily housing, and at transit nodes.

    These programs don’t exist in isolation. They’re threads in the same fabric, and Tacoma Power is one of the quieter but more consequential institutions weaving them together.


    Frequently Asked Questions

    What is Tacoma Power doing to upgrade its hydroelectric dams in 2026?

    Tacoma Power selected GE Vernova to refurbish two of the three 27 MW turbine-generator units at the Cushman II hydropower plant in Mason County. The work — covering new generator stators, refurbished rotor poles, new turbine distributors, and draft tube rehabilitation — is expected to complete in 2026 and extend the plant’s operational life by 100 years while improving reliability for the 81 MW facility.

    How is Tacoma Power expanding EV charging infrastructure in Pierce County?

    Tacoma Power is on track to reach 85 public charging ports by end of 2026, including new DC Fast Charging stations. Through its Community EV Charging Rebate program, businesses and multifamily properties can receive up to $5,000 per networked Level 2 port ($10,000 per port in designated underserved areas), with project caps up to $70,000. Residential customers can claim up to $600 in bill credits for L2 charger installations.

    What is Tacoma Power’s green hydrogen interruptible rate and how does it work?

    Tacoma Power launched the nation’s first electrofuels tariff in April 2021. It offers green hydrogen producers a discounted energy rate of $0.033147/kWh (roughly 15% below standard industrial rates) in exchange for allowing Tacoma Power to curtail service up to 1,300 hours per year — about 15% of annual hours — with just 10 minutes’ notice. This lets Tacoma Power dispatch around grid constraints while attracting clean-fuel industrial customers.

    Is Tacoma Power on track to comply with Washington’s Clean Energy Transformation Act?

    Tacoma Power is currently developing its 2026 Integrated Resource Plan (IRP), a 20-year roadmap guiding investment in energy resources aligned with Washington’s Clean Energy Transformation Act, which requires utilities to eliminate coal power by 2025 and achieve 100% clean electricity by 2045. Tacoma Power’s predominantly hydroelectric generation base — over 90% carbon-free — gives it a significant compliance head start compared to most utilities in the state.

    Does Tacoma Power offer a community solar program for residents who can’t install rooftop solar?

    Tacoma Power has offered community solar since 2016, when its initial 300 kW sold out quickly. Washington State’s Community Solar Expansion Program reached $25 million in obligated funding for FY26–FY29, creating additional pathways for shared solar subscriptions for renters and homeowners who cannot host rooftop panels.


    Related Reading

  • Tacoma Sister Cities: How Diplomacy Drives Global Trade

    Tacoma Sister Cities: How Diplomacy Drives Global Trade


    When a delegation from South Africa’s Garden Route District Municipality touched down in Tacoma last April, they weren’t here for tourism. They were here to talk trade — specifically, how two port-anchored communities on opposite sides of the globe can build supply chains, share skills, and move goods between them.

    Last refreshed: October 9, 2026 (Pacific).

    The April 23–28, 2026 exchange — part of a formal partnership between Tacoma Sister Cities International and the Garden Route District — is one of the clearest recent signals of how seriously Tacoma is beginning to use its 15 sister city relationships as genuine economic infrastructure rather than ceremonial diplomacy. And for Pierce County businesses paying attention, the implications are worth understanding.

    From Handshakes to Deal Flow: What the Garden Route Visit Actually Covered

    The Garden Route District Municipality spans South Africa’s Southern Cape, coordinating seven local municipalities and representing more than 630,000 residents. Its relationship with Tacoma traces back 28 years to a connection with the city of George — but in a move that quietly made international trade news, the Tacoma City Council formally elevated that relationship to a full district-wide partnership, substantially expanding the scope of what’s possible.

    The April delegation got specific. According to the Garden Route District Municipality’s official release, discussions centered on three concrete areas:

    The global ostrich industry. South Africa’s Garden Route — particularly the Klein Karoo region — is one of the world’s dominant ostrich product hubs, producing leather, feathers, and meat that move through international luxury and food supply chains. The delegation explored how the Port of Tacoma’s freight infrastructure could facilitate new export pathways for these high-value goods into Pacific Rim markets.

    Port logistics and trade facilitation. Both communities are defined by their port identities. The delegation examined how improved coordination between their respective port operations could reduce friction in bilateral trade flows — a practical, operator-level conversation, not a ceremonial one.

    Skills transfer and educational exchange. South Cape College and Africa Skills Village entered discussions about formal academic and artisanal exchange programs with Tacoma institutions, creating the kind of human-capital connections that tend to precede sustained economic relationships.

    Community reporting from South Africa’s The Gremlin described the visit’s tone as focused on “collective approaches to boost economic growth, skills transfer and sustainable tourism” — language that sounds like an investment thesis, not a cultural exchange brochure.

    WTC Tacoma: The Infrastructure Behind the Relationships

    None of this happens without an institutional engine. The World Trade Center Tacoma has quietly built itself into the largest membership-based trade organization in the Pacific Northwest, and by some measures the fastest-growing World Trade Center in North America over the past several years.

    WTC Tacoma’s core function is converting diplomatic relationships into actual commerce. It provides trade research, business matchmaking between local firms and international partners, import/export consulting, and manages both inbound and outbound trade missions. Critically, it also runs Tacoma’s foreign direct investment attraction programs — the effort to bring capital from abroad into Pierce County projects.

    The most visible example of that FDI work is the Tacoma-Fuzhou Trade Initiative, which grew out of Tacoma’s sister city relationship with Fuzhou, China — a city Xi Jinping led as Party Secretary when the original bond was formed in 1994. In 2019, Tacoma and Fuzhou simultaneously opened trade offices in each other’s cities, with the City and Port of Tacoma contributing $100,000 to fund the Fuzhou office. China remains the single largest trading partner of the Port of Tacoma.

    The 2026 WTC Globe Awards — held September 24 at Port of Tacoma Headquarters — recognized the businesses and individuals driving this work. If you want to understand who’s actually moving the needle on international trade in Pierce County, watch for the next edition on WTC Tacoma’s events calendar.

    The Port Numbers That Explain the Strategy

    Tacoma’s sister city diplomacy doesn’t happen in a vacuum. It’s backed by real freight infrastructure that gives international partners a reason to engage seriously.

    The Northwest Seaport Alliance — which combines the ports of Tacoma and Seattle — handled nearly $76 billion in waterborne trade with 176 trading partners globally in 2024. Japan, South Korea, and Taiwan all rank among the top five trading partners. The port complex handles approximately 1.8 to 2 million TEUs of container throughput annually.

    In 2026, the story is mixed but mostly positive: NWSA breakbulk cargo volumes are up 24 percent year-over-year through April, driven by project cargo and heavy lift freight. Container volumes dipped in April amid broader trans-Pacific trade disruptions, but the port’s long-term Pacific Rim positioning remains intact.

    That infrastructure is the reason why a South African delegation talks seriously about using Tacoma as a Pacific access point. The port makes the pitch credible.

    The APCC Expansion and the Cultural Backbone of Trade

    Sustained trade relationships require cultural infrastructure, not just port capacity. In Tacoma, that infrastructure runs through the Asia Pacific Cultural Center, which has been working toward a significant expansion that would add a demonstration kitchen, cultural classrooms, an Asian Pacific Islander library, office and conference space, and a large exhibition hall.

    Federal funding has advanced through the House to support that expansion — Congressman Derek Kilmer’s office confirmed the appropriations movement — giving the APCC the resources to serve as a genuine anchor for Tacoma’s AAPI business community and its international connections.

    Tacoma is one of the most racially diverse cities in Washington State, with nearly 40 percent of residents identifying as Latino, African American, Asian and Pacific Islander, Multiracial, or Native American. That demographic reality is also an economic one: the region’s API-owned small businesses, workforce bilingualism, and cultural networks form a substrate that makes international business development more viable here than in many comparable mid-sized cities.

    What This Means for Pierce County Operators

    Here’s the practical read for local business owners and operators: Tacoma’s international infrastructure is more developed than most people realize, and it’s increasingly organized around generating actual deal flow rather than ribbon-cutting ceremonies.

    The sister city program — through Tacoma Sister Cities International — can connect businesses to counterpart organizations in 15 cities across multiple continents. WTC Tacoma’s membership provides access to trade consulting and matchmaking that most small businesses couldn’t afford to replicate independently. The Economic Development Board at choosetacomapierce.org maintains a dedicated international business support function.

    The April 2026 Garden Route visit is a useful model to study. It wasn’t an abstract diplomatic exchange — it was a structured conversation about specific products (ostrich goods), specific logistics (port connections), and specific human capital pathways (skills exchange programs). That’s what mature sister city relationships look like when they’re working. Pierce County’s international trade apparatus, at its best, operates the same way.

    With the September WTC Globe Awards now behind us, the Garden Route partnership faces its real test: produce tangible agreements or fade into the archives of well-intentioned visits. Based on how deliberately both sides have framed this one, the early signals favor the former.


    Frequently Asked Questions

    How many sister cities does Tacoma have?

    Tacoma currently maintains 15 official sister city relationships spanning Asia, Europe, Africa, Latin America, and the Pacific. Key partners include Fuzhou (China), Kitakyushu (Japan), Cheboksary (Russia), Cienfuegos (Cuba), and — most recently elevated — the Garden Route District Municipality in South Africa.

    What does the World Trade Center Tacoma do?

    The World Trade Center Tacoma (WTC Tacoma) is the largest membership-based trade organization in the Pacific Northwest. It provides trade research, business matchmaking, export/import consulting, and manages inbound and outbound trade missions. It also coordinates Tacoma’s foreign direct investment attraction programs, including the Tacoma-Fuzhou Trade Initiative with a sister office in Fuzhou, China.

    What was the purpose of the April 2026 Garden Route delegation to Tacoma?

    The Garden Route District Municipality delegation visited Tacoma April 23–28, 2026 to explore trade opportunities in the ostrich products industry, establish port logistics connections, and build skills exchange programs with local educational institutions. The visit built on the Tacoma City Council’s formal elevation of the city’s 28-year relationship with George, South Africa to a full district-wide partnership with the Garden Route municipality.

    Why is the Port of Tacoma important for Pacific Rim trade?

    The Port of Tacoma is one of the leading deep-water ports on the U.S. West Coast, handling over $25 billion in commerce annually as part of the Northwest Seaport Alliance. China, Japan, South Korea, and Taiwan rank among its top five trading partners. In 2026, NWSA breakbulk volumes are up 24 percent year-over-year, underscoring Tacoma’s growing role as a Pacific gateway for project cargo and specialized freight.

    How can Pierce County businesses get involved in international trade through Tacoma?

    Local businesses can engage through WTC Tacoma (wtcta.org), which offers trade consulting, matchmaking, and mission programming. The Economic Development Board for Tacoma-Pierce County (choosetacomapierce.org) also connects businesses to export resources and international investor networks. The annual WTC Globe Awards — held September 24, 2026 at Port of Tacoma HQ — was a key networking event for anyone engaged in the region’s international trade ecosystem.

  • 2025 RIA TPA Scorecard: Best & Worst Restoration Programs

    2025 RIA TPA Scorecard: Best & Worst Restoration Programs

    Updated October 2026: The 2025 edition (released April 2025) is the latest RIA TPA Scorecard — no 2026 edition has been published. Since the survey, Alacrity’s managed repair division became an independent company, Altimeter Solutions Group (January 2026, backed by BV Investment Partners), and Worley acquired Alacrity Renovation Services from Lowe’s. Scores below reflect the 2025 survey as published.

    If you work insurance program work, this is the one report you should actually read. Every year, the Restoration Industry Association’s Advocacy and Governmental Affairs committee surveys contractors who have worked with TPAs in the past 12 months. No vendor marketing. No TPA spin. Just anonymous contractor ratings across 8 categories that actually matter: value, claims process, contractor support, scoring clarity, guidelines, credentialing, claim volume, and geographic coverage.

    The 2025 results are in. 379 contractors rated 13 TPAs. The industry average sits at 2.7 out of 5 — a 54% satisfaction rate. That’s not a ringing endorsement of the TPA model, but it tells you something more useful: the spread between programs is significant, and knowing who’s at the top and who’s at the bottom changes your program strategy.

    Here’s the breakdown, with the data that matters.

    The Leaderboard: Who Contractors Actually Trust

    Four cards: assignment quality, pay speed, scope fights, partner fit
    Score TPAs on what contractors feel — not the brochure.

    ONCORE Claims Network: 3.1 stars — #1 for the third consecutive year. This is the benchmark. ONCORE (formerly CORE) outperforms everyone across nearly every category: 3.4 on credentialing (the highest of any TPA), 3.3 on guidelines, 3.2 on value, and 3.0 on contractor support — the only TPA to crack 3.0 in that category. Claim volume is their soft spot at 2.7, which contractors consistently flag: the program is good, but there aren’t enough jobs to go around. If you can get in and get volume, this is the cleanest program to run.

    Lionsbridge: 3.0 stars. Tied with Sedgwick for second and rising. Lionsbridge improved 3% since 2022 and scores well on guidelines (3.1) and claims process (3.1). It operates as a CCA Global Partners cooperative — meaning members get access to significant group buying power on equipment, credit card processing, and supplies in addition to leads. The program is selective and built for established contractors. Their claim volume score of 2.4 is the weak link, but the jobs they do send tend to be cleaner to close.

    Sedgwick: 3.0 stars. The highest geographic coverage of any TPA at 3.2, tied with Alacrity and Contractor Connection. Sedgwick is a large TPA that manages claims for major commercial carriers. Their value score improved from 2022 and holds at 3.2. Contractor support fell slightly to 2.8, which is still above average. Sedgwick’s biggest contractor complaint: they want better advocacy with carriers when scope disputes arise (34% of contractors flagged this as their top improvement priority).

    The Middle of the Pack

    Westhill Global: 2.9 stars (+27% from 2022). The biggest mover in the 2025 report. Westhill climbed from 2.3 to 2.9, the largest percentage gain of any TPA. They earned the highest credentialing score in that category at 3.2, and their value rating jumped from 2.0 to 3.0. What drove it? Contractors report that Westhill made meaningful process improvements and the program became easier to actually manage. Watch this one — if the trajectory continues, they’ll be in the top tier in 2027.

    Preferred Repair Network (PRN) / Hancock Group: 2.9 stars (down from 3.5 in 2022). The biggest drop in the report. PRN was the top-rated TPA in 2022. Two years later they’ve fallen 17% across all categories — contractor support cratered from 3.5 to 2.7. The program score fell sharply (from 3.5 to 3.0), guidelines dropped, and claim volume expectations are down 23%. Contractors aren’t abandoning the program — the claim volume and geographic scores are still reasonable — but something changed in how the program is managed. If you’re heavily weighted in PRN, the trend line warrants attention.

    Direct Claims Management Group (DCMG): 2.8 stars (+12% from 2022). DCMG improved across the board and earned the highest scoring clarity rating (3.1) and tied for the top value rating. Their communication scores are better than average, and they’re rated best-in-class for not requiring contractors to take estimate-only projects. Smaller program footprint, but if you’re in their coverage area, worth evaluating.

    Alacrity Solutions/Alacrity Nexxus: 2.7 stars (down 4%). The largest program by claim volume alongside Contractor Connection — and that volume score (2.7) is their strongest asset. Contractors use Alacrity for the jobs, not the relationship. The program scored 2.3 on contractor support, the second lowest of any TPA. Key contractor complaints: 38% want better advocacy with carriers, 34% want overhead and profit addressed, 33% want more flexibility in guidelines. Alacrity knows this and has invested in contractor relations improvements (rebranding from the original Altimeter structure), but the needle hasn’t moved enough to show in the scores yet.

    The Programs That Are Losing Contractor Confidence

    Clipboard and tablet on a kitchen counter during an insurance adjuster walkthrough after water loss
    Programs losing confidence usually lose it in the scope fight.

    Brightserv: 2.6 stars (flat). No change from 2022. Contractors score timely payment as a weak point (29% flag it), and contractor support (2.3) needs work. The program hasn’t gotten worse, but in a field where others are improving, flat is a problem.

    HOMEE: 2.6 stars (new to 2025 survey). Debuted slightly below average with a concerning claim volume score of 1.8 — the lowest of any TPA. Contractor support is at 2.6, and 46% of contractors rate “improve partnership with TPA” as their top request. As a tech-forward TPA operating in the gig-economy model, HOMEE is a different kind of program — useful for certain contractors but not a primary revenue source for established restoration companies.

    Contractor Connection (Crawford): 2.6 stars. The most widely used TPA in the restoration industry — 289 contractor responses, the largest sample in the survey. Geographic coverage ties for highest (3.2), claim volume ties for highest (2.7), and they’re among the best for timely payment (only 8% of contractors flag slow payment, one of the lowest rates). The problem is everything else. Contractor support sits at 2.2 — second lowest. Contractor advocacy with carriers is the top complaint at 42%. Guidelines flexibility is flagged by 39% of contractors. They send the most work. They’re also the most frustrating to work with. The calculation you have to make: is the volume worth the margin compression and administrative friction?

    Accuserve (formerly CodeBlue): 2.1 stars — last place. The lowest-rated TPA in the 2025 report, and it’s not close. Accuserve scores below 2.0 on value (1.9), scoring clarity (1.9), claims process (1.9), and contractor support (1.9). The only category where they score above 2.5 is credentialing (2.6). Fifty percent of contractors working with Accuserve say providing pricing consistent with market value is their top requested improvement — double the industry average. This program has structural problems that go beyond management tweaks.

    What the Numbers Actually Tell You

    The overall industry average of 2.7 out of 5 means most contractors are running TPA work that’s tolerated, not preferred. The five most important things contractors want from TPAs — in order of importance they rated themselves: claims process efficiency (4.4/5 importance), contractor support/advocacy (4.2), claim volume (4.2), value/ROI (4.2), and guidelines flexibility (4.1). On every single one of those, TPAs are delivering somewhere between 2.3 and 2.9. There’s a consistent gap between what contractors need and what they’re getting.

    The other number worth noting: 53% of restoration firms now report zero TPA revenue, up from 45% the prior year. That’s not a blip — it’s a structural shift. Contractors who built their own lead channels through Google LSA, direct plumber and agent referrals, and organic SEO are generating work at better margins without the administrative overhead. The TPA model still works, but fewer operators are treating it as their primary revenue strategy.

    How to Build Your TPA Program Intelligently

    Restoration SOP clipboard with checklist, moisture meter, and gloves on a jobsite table
    Build your TPA mix like a checklist — not a hope.

    The operators who do TPA work profitably aren’t in every program — they’re in two or three that fit their capacity, their geographic footprint, and their operational model. Here’s the framework:

    Use the RIA scorecard as a filter, not a verdict. A 3.1 from ONCORE doesn’t mean the program works in your market — claim volume (2.7) is the constraint. A 2.6 from Contractor Connection doesn’t mean you walk away from the largest volume source in the country. But it does mean you know where the friction is going to come from before you budget for it.

    Cap TPA revenue at 40-50% of total revenue. The moment more than half your revenue runs through a program, the TPA controls your business. They can change pricing, add administrative requirements, or reduce your zip code coverage — and you have no leverage. Keep direct work as your floor, TPA work as your upside.

    Track margin per TPA, not aggregate TPA margin. The programs that send the most work aren’t always the ones generating the most gross profit. A company doing $800K in Contractor Connection work at 28% gross margin is generating less than a company doing $300K in ONCORE work at 44% gross margin. Build a simple spreadsheet that tracks average gross margin per job by program. You’ll know within 90 days which programs deserve more of your capacity.

    Document your TPA scorecard complaints. The RIA survey directly affects how TPA programs are managed — TPA executives receive this data and respond to it. If you’re running program work and experiencing consistent friction with a specific TPA, log it and participate in the next RIA survey. That’s not altruism. That’s how contractors collectively move the needle on program terms.

    TPA Readiness Checklist

    TPAs don’t just score your work — they audit your back office before you ever get a job. Check every box that’s true for your company. Be honest; the TPA’s credentialing team will be.

    Your readiness score 0 of 17

    Check the boxes to see where you stand.

    Self-assessment, not a guarantee — every TPA publishes its own credentialing requirements. Use this to find your gaps before their auditor does.

    The Bottom Line

    If you’re choosing between TPA programs in 2025, the data is clear: ONCORE leads, Lionsbridge and Sedgwick are solid programs for contractors who qualify, and Westhill Global is the most improved. Contractor Connection sends the most work but has the worst contractor support score. Accuserve has structural problems that pricing alone won’t fix.

    Don’t build your business on programs. Build your business on direct marketing, strong referral relationships, and operational capability — then let TPA work be the fill you take when capacity allows. The contractors who get that order right keep their margins. The ones who get it backwards spend their careers negotiating scope with adjusters they’ll never win against.

    Source: RIA 2025 TPA Scorecard Report, Restoration Industry Association Advocacy and Government Affairs Committee. Survey conducted anonymously among 379 restoration contractors.

    THE RESIDENTIAL-TO-COMMERCIAL BRIDGE · PART 2 OF 3

    Compliance: prove your back office can handle program work

    Certifications get you in the door; TPA-grade documentation keeps you there. Xactimate fluency, S500/S520-standard documentation, and audit-ready admin are the price of commercial program revenue. Final step: aim your marketing where commercial clients actually are.

    ← Part 1: Training — the certification roadmap

    Part 3: Marketing — from residential clicks to commercial networking →

    Related on Tygart Media: RCP guide · contractor ESG clauses · FM ESG frameworks.