The biggest question in AI infrastructure right now isn’t what to build — it’s whether to build at all. We run our entire operation on a single GCP instance with MCP servers and custom pipelines at near-zero marginal cost. But that approach isn’t right for everyone.
This simulator models three scenarios — 100% SaaS/API, Hybrid with MCP servers, and Full Build — and calculates monthly costs, 3-year total cost of ownership, and break-even timelines based on your actual numbers.
Input your current marketing spend, team size, and content volume to see which infrastructure approach delivers the best ROI for your situation.
AI systems select sources based on information density — the ratio of unique, verifiable claims to filler text. Most content fails this test. We found that 16 AI models unanimously agree on what makes content worth citing, and it comes down to density.
This tool analyzes your text in real-time and produces 8 metrics including unique concepts per 100 words, claim density, filler ratio, and actionable insight score. It also generates a paragraph-by-paragraph heatmap showing exactly where your content is dense and where it’s fluff.
Paste your article text below and see how your content measures up against AI-citable benchmarks.
`)
.join(”);
document.getElementById(‘heatmapContainer’).innerHTML = heatmapHTML;
// Insights
let likelihood;
if (analysis.densityScore >= 75) {
likelihood = ‘This content is highly likely to be selected as an AI source. You have excellent unique concept density, strong claim coverage, and minimal filler.’;
} else if (analysis.densityScore >= 60) {
likelihood = ‘This content has good density and will likely be cited by AI systems. Consider reducing filler phrases and increasing actionable insights.’;
} else if (analysis.densityScore >= 40) {
likelihood = ‘Your content is moderately dense. AI may cite specific sections, but overall improvement would help. Focus on claims, actions, and uniqueness.’;
} else {
likelihood = ‘This content lacks the density AI systems prefer. Too many filler phrases, weak claim coverage, and low concept variety reduce citation likelihood.’;
}
document.getElementById(‘aiLikelihood’).textContent = likelihood;
let benchmark;
if (analysis.fillerRatio > 20) {
benchmark = ‘Your filler ratio is above benchmark. AI-citable content typically has <15% filler phrases.';
} else if (analysis.claimDensity 8) {
benchmark = ‘Excellent unique concept density. This makes your content more likely to be selected as a source.’;
} else {
benchmark = ‘Your metrics align well with top-cited content benchmarks across most dimensions.’;
}
document.getElementById(‘benchmark’).textContent = benchmark;
document.getElementById(‘resultsContainer’).classList.add(‘visible’);
document.getElementById(‘resultsContainer’).scrollIntoView({ behavior: ‘smooth’ });
}
{
“@context”: “https://schema.org”,
“@type”: “Article”,
“headline”: “Information Density Analyzer: Is Your Content Dense Enough for AI?”,
“description”: “Paste your article text and get real-time analysis of information density, filler ratio, claim density, and AI-citability score.”,
“datePublished”: “2026-04-01”,
“dateModified”: “2026-04-03”,
“author”: {
“@type”: “Person”,
“name”: “Will Tygart”,
“url”: “https://tygartmedia.com/about”
},
“publisher”: {
“@type”: “Organization”,
“name”: “Tygart Media”,
“url”: “https://tygartmedia.com”,
“logo”: {
“@type”: “ImageObject”,
“url”: “https://tygartmedia.com/wp-content/uploads/tygart-media-logo.png”
}
},
“mainEntityOfPage”: {
“@type”: “WebPage”,
“@id”: “https://tygartmedia.com/information-density-analyzer/”
}
}
With 93% of AI Mode searches ending in zero clicks, the question isn’t whether you rank on Google — it’s whether AI systems consider your content authoritative enough to cite. This interactive tool scores your content across 8 dimensions that LLMs evaluate when deciding what to reference.
We built this based on our research into what makes content citable by Claude, ChatGPT, Gemini, and Perplexity. The factors aren’t what most people expect — it’s not just about keywords or length. It’s about information density, entity clarity, factual specificity, and structural machine-readability.
Take the assessment below to find out if your content is visible to the machines that are increasingly replacing traditional search.
I wanted to test a question that’s been nagging me since I started building autonomous AI pipelines: how far can you push a creative workflow before the quality falls off a cliff?
The answer, it turns out, is further than I expected — but the cliff is real, and knowing where it is matters more than the output itself.
The Experiment: Zero Human Edits, 20 Songs, 19 Genres
The setup was straightforward in concept and absurdly complex in execution. I gave Claude one instruction: generate original songs using Producer.ai, analyze each one with Gemini 2.0 Flash, create custom artwork with Imagen 4, build a listening page with a custom audio player, publish it to this site, update the music hub, log everything to Notion, and then loop back and do it again.
The constraint that made it real: Claude had to honestly assess quality after every batch and stop when diminishing returns hit. No padding the catalog with filler. No claiming mediocre output was good. The stakes had to be real or the whole experiment was theater.
Over the course of one extended session, the pipeline produced 20 original tracks spanning 19 distinct genres — from heavy metal to bossa nova, punk rock to Celtic folk, ambient electronic to gospel soul.
How the Pipeline Actually Works
Each song passes through a 7-stage autonomous pipeline with zero human intervention between stages:
Prompt Engineering — Claude crafts a genre-specific prompt designed to push Producer.ai toward authentic instrumentation and songwriting conventions for that genre, not generic “make a song in X style” requests.
Generation — Producer.ai generates the track. Claude navigates the interface via browser automation, waits for generation to complete, then extracts the audio URL from the page metadata.
Audio Conversion — The raw m4a file is downloaded and converted to MP3 at 192kbps for the full version, plus a trimmed 90-second version at 128kbps for AI analysis.
Gemini 2.0 Flash Analysis — The trimmed audio is sent to Google’s Gemini 2.0 Flash model via Vertex AI. Gemini listens to the actual audio and returns a structured analysis: song description, artwork prompt suggestion, narrative story, and thematic elements.
Imagen 4 Artwork — Gemini’s artwork prompt feeds into Google’s Imagen 4 model, which generates a 1:1 album cover. Each cover is genre-matched — moody neon for synthwave, weathered wood textures for Appalachian folk, stained glass for gospel soul.
WordPress Publishing — The MP3 and artwork upload to WordPress. Claude builds a complete listening page with a custom HTML/CSS/JS audio player, genre-specific accent colors, lyrics or composition notes, and the AI-generated story. The page publishes as a child of the music hub.
Hub Update & Logging — The music hub grid gets a new card with the artwork, title, and genre badge. Everything logs to Notion for the operational record.
The entire stack runs on Google Cloud — Vertex AI for Gemini and Imagen 4, authenticated via service account JWT tokens. WordPress sits on a GCP Compute Engine instance. The only external dependency is Producer.ai for the actual audio generation.
The 20-Song Catalog
You can listen to every track on the Tygart Media Music Hub. Here’s the full catalog with genre and a quick take on each:
#
Title
Genre
Assessment
1
Anvil and Ember
Blues Rock
Strong opener — gritty, authentic tone
2
Neon Cathedral
Synthwave / Darkwave
Atmospheric, genre-accurate production
3
Velvet Frequency
Trip-Hop
Moody, textured, held together well
4
Hollow Bones
Appalachian Folk
Top 3 — haunting, genuine folk storytelling
5
Glass Lighthouse
Dream Pop / Indie Pop
Shimmery, the lightest track in the catalog
6
Meridian Line
Orchestral Hip-Hop
Surprisingly cohesive genre fusion
7
Salt and Ceremony
Gospel Soul
Warm, emotionally grounded
8
Tide and Timber
Roots Reggae
Laid-back, authentic reggae rhythm
9
Paper Lanterns
Bossa Nova
Gentle, genuine Brazilian feel
10
Burnt Bridges, Better Views
Punk Rock
Top 3 — raw energy, real punk attitude
11
Signal Drift
Ambient Electronic
Spacious instrumental, no lyrics needed
12
Gravel and Grace
Modern Country
Solid modern Nashville sound
13
Velvet Hours
Neo-Soul R&B
Vocal instrumental — texture over lyrics
14
The Keeper’s Lantern
Celtic Folk
Top 3 — strong closer, unique sonic palette
Plus 6 earlier experimental tracks (Iron Heart variations, Iron and Salt, The Velvet Pour, Rusted Pocketknife) that preceded the formal pipeline and are also on the hub.
Where Quality Held Up — and Where It Didn’t
The pipeline performed best on genres with strong structural conventions. Blues rock, punk, folk, country, and Celtic music all have well-defined instrumentation and songwriting patterns that Producer.ai could lock into. The AI wasn’t inventing a genre — it was executing within one, and the results were genuinely listenable.
The weakest output came from genres that rely on subtlety and human nuance. The neo-soul track (Velvet Hours) ended up as a vocal instrumental — beautiful textures, but no real lyrical content. It felt more like a mood than a song. The synthwave track was competent but slightly generic — it hit every synth cliché without adding anything distinctive.
The biggest surprise was Meridian Line (Orchestral Hip-Hop). Fusing a full orchestral arrangement with hip-hop production is hard for human producers. The AI pulled it off with more coherence than I expected.
The Honest Assessment: Why I Stopped at 20
After 14 songs in the formal pipeline (plus the 6 experimental tracks), I evaluated what genres remained untapped. The answer was ska, reggaeton, polka, zydeco — genres that would have been novelty picks, not genuine catalog additions. Each of the 19 genres I covered brought a distinctly different sonic palette, vocal style, and emotional register. Song 20 was the right place to stop because Song 21 would have been padding.
This is the part that matters for anyone building autonomous creative systems: the quality curve isn’t linear. You don’t get steadily worse output. You get strong results across a wide range, and then you hit a wall where the remaining options are either redundant (too similar to something you already made) or contrived (genres you’re forcing because they’re different, not because they’re good).
Knowing where that wall is — and having the system honestly report it — is the difference between a useful pipeline and a content mill.
What This Means for AI-Driven Creative Work
This experiment wasn’t about proving AI can replace musicians. It can’t. Every track in this catalog is a competent execution of genre conventions — but none of them have the idiosyncratic human choices that make music genuinely memorable. No AI song here will be someone’s favorite song.
What the experiment does prove is that the full creative pipeline — from ideation through production, analysis, visual design, web publishing, and catalog management — can run autonomously at a quality level that’s functional and honest about its limitations.
The tech stack that made this possible:
Claude — Pipeline orchestration, prompt engineering, quality assessment, web publishing, and the decision to stop
Producer.ai — Audio generation from text prompts
Gemini 2.0 Flash — Audio analysis (it actually listened to the MP3 and described what it heard)
Imagen 4 — Album artwork generation from Gemini’s descriptions
Google Cloud Vertex AI — API backbone for both Gemini and Imagen 4
WordPress REST API — Direct publishing with custom HTML listening pages
Notion API — Operational logging for every song
Total cost for the entire 20-song catalog: a few dollars in Vertex AI API calls. Zero human edits to the published output.
Listen for Yourself
The full catalog is live on the Tygart Media Music Hub. Every track has its own listening page with a custom audio player, AI-generated artwork, the story behind the song, and lyrics (or composition notes for instrumentals). Pick a genre you like and judge for yourself whether the pipeline cleared the bar.
The honest answer is: it cleared it more often than it didn’t. And knowing exactly where it didn’t is the most valuable part of the whole experiment.
I’ve been building Tygart Media for a while now, and I’ve always struggled to explain what we actually do. Not because the work is complicated — it’s not. But because the thing we do doesn’t have a clean label yet.
We’re not a content agency. We’re not a marketing firm. We’re not an SEO shop, even though SEO is part of what happens. Those are all descriptions of outputs, and they miss the thing underneath.
The Moment It Clicked
I was working with a client recently — a business owner who has spent 20 years building expertise in his industry. He knows things that nobody else knows. Not because he’s secretive, but because that knowledge lives in his head, in his gut, in the way he reads a situation and makes a call. It’s tacit knowledge. The kind you can’t Google.
My job wasn’t to write blog posts for him. My job was to extract that knowledge, organize it, structure it, and put it into a format that could actually be used — by his team, by his customers, by AI systems, by anyone who needs it.
That’s when I realized: Tygart Media is a human knowledge distillery.
What a Knowledge Distillery Does
Think about what a distillery actually does. You take raw material — grain, fruit, whatever — and you run it through a process that extracts the essence. You remove the noise. You concentrate what matters. And you put it in a form that can be stored, shared, and used.
That’s exactly what we do with human expertise. Every business leader, every subject matter expert, every operator who has been doing this work for years — they are sitting on enormous reserves of knowledge that is trapped. It’s trapped in their heads, in their habits, in their decision-making patterns. It’s not written down. It’s not structured. It can’t be searched, referenced, or built upon by anyone else.
We extract it. We distill it. We put it into structured formats — articles, knowledge bases, structured data, content architectures — that make it usable.
The Media Is the Knowledge
Here’s the shift that changed everything for me: the word “media” in Tygart Media doesn’t mean content. It means medium — as in, the thing through which knowledge travels.
When we publish an article, we’re not creating content for content’s sake. We’re creating a vessel for knowledge that was previously locked inside someone’s brain. The article is just the delivery mechanism. The real product is the structured intelligence underneath it.
Every WordPress post we publish, every schema block we inject, every entity we map — those are all expressions of distilled knowledge being put into circulation. The websites aren’t marketing channels. They’re knowledge infrastructure.
Content as Data, Not Decoration
Most agencies look at content and see marketing material. We look at content and see data. Every piece of content we create is structured, tagged, embedded, and connected to a larger knowledge graph. It’s not sitting in a silo waiting for someone to stumble across it — it’s part of a living system that AI can read, search engines can parse, and humans can navigate.
When you start treating content as data and knowledge rather than decoration, everything changes. You stop asking “what should we blog about?” and start asking “what does this organization know that nobody else does, and how do we make that knowledge accessible to every system that could use it?”
Where This Goes
Right now, we run our own operations out of this distilled knowledge. We manage 27+ WordPress sites across wildly different industries — restoration, luxury lending, cold storage, comedy streaming, veterans services, and more. Every one of those sites is a node in a knowledge network that gets smarter with every engagement.
But here’s where it gets interesting. The distilled knowledge we’re building — stripped of personal information, structured for machine consumption — could become an open API. A knowledge layer that anyone could plug into. Your AI assistant, your search tools, your internal systems — they could all connect to the Tygart Brain and immediately get smarter about the domains we’ve mapped.
That’s not a fantasy. The infrastructure already exists. We already have the knowledge pages, the embeddings, the structured data. The question isn’t whether we can open it up — it’s when.
Some people call this democratizing knowledge. I just call it doing the obvious thing. If you’ve spent the time to extract, distill, and structure expertise across dozens of industries, why would you keep it locked in a private database? The whole point of a distillery is that what comes out is meant to be shared.
What This Means for You
If you’re a business leader sitting on years of expertise that’s trapped in your head — that’s the raw material. We can extract it, distill it, and turn it into a knowledge asset that works for you around the clock.
If you’re someone who wants to build AI-powered tools or systems — eventually, you’ll be able to plug into a growing, curated knowledge network that’s been distilled from real human expertise. Not scraped. Not summarized. Distilled.
Tygart Media isn’t a content agency that figured out AI. It’s a knowledge distillery that happens to express itself as content. That distinction matters, and I think it’s going to matter a lot more very soon.
The Problem Nobody Talks About: 200+ Episodes of Expertise, Zero Searchability
Here’s a scenario that plays out across every industry vertical: a consulting firm spends five years recording podcast episodes, livestreams, and training sessions. Hundreds of hours of hard-won expertise from a founder who’s been in the trenches for decades. The content exists. It’s published. People can watch it. But nobody — not the team, not the clients, not even the founder — can actually find the specific insight they need when they need it.
That’s the situation we walked into six months ago with a client in a $250B service industry. A podcast-and-consulting operation with real authority — the kind of company where a single episode contains more actionable intelligence than most competitors’ entire content libraries. The problem wasn’t content quality. The problem was that the knowledge was trapped inside linear media formats, unsearchable, undiscoverable, and functionally invisible to the AI systems that are increasingly how people find answers.
What We Actually Built: A Searchable AI Brain From Raw Content
We didn’t build a chatbot. We didn’t slap a search bar on a podcast page. We built a full retrieval-augmented generation (RAG) system — an AI brain that ingests every piece of content the company produces, breaks it into semantically meaningful chunks, embeds each chunk as a high-dimensional vector, and makes the entire knowledge base queryable in natural language.
The architecture runs entirely on Google Cloud Platform. Every transcript, every training module, every livestream recording gets processed through a pipeline that extracts metadata using Gemini, splits the content into overlapping chunks at sentence boundaries, generates 768-dimensional vector embeddings, and stores everything in a purpose-built database optimized for cosine similarity search.
When someone asks a question — “What’s the best approach to commercial large loss sales?” or “How should adjusters handle supplement disputes?” — the system doesn’t just keyword-match. It understands the semantic meaning of the query, finds the most relevant chunks across the entire knowledge base, and synthesizes an answer grounded in the company’s own expertise. Every response cites its sources. Every answer traces back to a specific episode, timestamp, or training session.
The Numbers: From 171 Sources to 699 in Six Months
When we first deployed the knowledge base, it contained 171 indexed sources — primarily podcast episodes that had been transcribed and processed. That alone was transformative. The founder could suddenly search across years of conversations and pull up exactly the right insight for a client call or a new piece of content.
But the real inflection point came when we expanded the pipeline. We added course material — structured training content from programs the company sells. Then we ingested 79 StreamYard livestream transcripts in a single batch operation, processing all of them in under two hours. The knowledge base jumped to 699 sources with over 17,400 individually searchable chunks spanning 2,800+ topics.
Here’s the growth trajectory:
Phase
Sources
Topics
Content Types
Initial Deploy
171
~600
Podcast episodes
Course Integration
620
2,054
+ Training modules
StreamYard Batch
699
2,863
+ Livestream recordings
Each new content type made the brain smarter — not just bigger, but more contextually rich. A query about sales objection handling might now pull from a podcast conversation, a training module, and a livestream Q&A, synthesizing perspectives that even the founder hadn’t connected.
The Signal App: Making the Brain Usable
A knowledge base without an interface is just a database. So we built Signal — a web application that sits on top of the RAG system and gives the team (and eventually clients) a way to interact with the intelligence layer.
Signal isn’t ChatGPT with a custom prompt. It’s a purpose-built tool that understands the company’s domain, speaks the industry’s language, and returns answers grounded exclusively in the company’s own content. There are no hallucinations about things the company never said. There are no generic responses pulled from the open internet. Every answer comes from the proprietary knowledge base, and every answer shows you exactly where it came from.
The interface shows source counts, topic coverage, system status, and lets users run natural language queries against the full corpus. It’s the difference between “I think Chris mentioned something about that in an episode last year” and “Here’s exactly what was said, in three different contexts, with links to the source material.”
What’s Coming Next: The API Layer and Client Access
Here’s where it gets interesting. The current system is internal — it serves the company’s own content creation and consulting workflows. But the next phase opens the intelligence layer to clients via API.
Imagine you’re a restoration company paying for consulting services. Instead of waiting for your next call with the consultant, you can query the knowledge base directly. You get instant access to years of accumulated expertise — answers to your specific questions, drawn from hundreds of real-world conversations, case studies, and training materials. The consultant’s brain, available 24/7, grounded in everything they’ve ever taught.
This isn’t theoretical. The RAG API already exists and returns structured JSON responses with relevance-scored results. The Signal app already consumes it. Extending access to clients is an infrastructure decision, not a technical one. The plumbing is built.
And because every query and every source is tracked, the system creates a feedback loop. The company can see what clients are asking about most, identify gaps in the knowledge base, and create new content that directly addresses the highest-demand topics. The brain gets smarter because people use it.
The Content Machine: From Knowledge Base to Publishing Pipeline
The other unlock — and this is the part most people miss — is what happens when you combine a searchable AI brain with an automated content pipeline.
When you can query your own knowledge base programmatically, content creation stops being a blank-page exercise. Need a blog post about commercial water damage sales techniques? Query the brain, pull the most relevant chunks from across the corpus, and use them as the foundation for a new article that’s grounded in real expertise — not generic AI filler.
We built the publishing pipeline to go from topic to live, optimized WordPress post in a single automated workflow. The article gets written, then passes through nine optimization stages: SEO refinement, answer engine optimization for featured snippets and voice search, generative engine optimization so AI systems cite the content, structured data injection, taxonomy assignment, and internal link mapping. Every article published this way is born optimized — not retrofitted.
The knowledge base isn’t just a reference tool. It’s the engine that feeds a content machine capable of producing authoritative, expert-sourced content at a pace that would be impossible with traditional workflows.
The Bigger Picture: Why Every Expert Business Needs This
This isn’t a story about one company. It’s a blueprint that applies to any business sitting on a library of expert content — law firms with years of case analysis podcasts, financial advisors with hundreds of market commentary videos, healthcare consultants with training libraries, agencies with decade-long client education archives.
The pattern is always the same: the expertise exists, it’s been recorded, and it’s functionally invisible. The people who created it can’t search it. The people who need it can’t find it. And the AI systems that increasingly mediate discovery don’t know it exists.
Building an AI brain changes all three dynamics simultaneously. The creator gets a searchable second brain. The audience gets instant, cited access to deep expertise. And the AI layer — the Perplexitys, the ChatGPTs, the Google AI Overviews — gets structured, authoritative content to cite and recommend.
We’re building these systems for clients across multiple verticals now. The technology stack is proven, the pipeline is automated, and the results compound over time. If you’re sitting on a content library and wondering how to make it actually work for your business, that’s exactly the problem we solve.
Frequently Asked Questions
What is a RAG system and how does it differ from a regular chatbot?
A retrieval-augmented generation (RAG) system is an AI architecture that answers questions by first searching a proprietary knowledge base for relevant information, then generating a response grounded in that specific content. Unlike a general chatbot that draws from broad training data, a RAG system only uses your content as its source of truth — eliminating hallucinations and ensuring every answer traces back to something your organization actually said or published.
How long does it take to build an AI knowledge base from existing content?
The initial deployment — ingesting, chunking, embedding, and indexing existing content — typically takes one to two weeks depending on volume. We processed 79 livestream transcripts in under two hours and 500+ podcast episodes in a similar timeframe. The ongoing pipeline runs automatically as new content is created, so the knowledge base grows without manual intervention.
What types of content can be ingested into the AI brain?
Any text-based or transcribable content works: podcast episodes, video transcripts, livestream recordings, training courses, webinar recordings, blog posts, whitepapers, case studies, email newsletters, and internal documents. Audio and video files are transcribed automatically before processing. The system handles multiple content types simultaneously and cross-references between them during queries.
Can clients access the knowledge base directly?
Yes — the system is built with an API layer that can be extended to external users. Clients can query the knowledge base through a web interface or via API integration into their own tools. Access controls ensure clients see only what they’re authorized to access, and every query is logged for analytics and content gap identification.
How does this improve SEO and AI visibility?
The knowledge base feeds an automated content pipeline that produces articles optimized for traditional search, answer engines (featured snippets, voice search), and generative AI systems (Google AI Overviews, ChatGPT, Perplexity). Because the content is grounded in real expertise rather than generic AI output, it carries the authority signals that both search engines and AI systems prioritize when selecting sources to cite.
What does Tygart Media’s role look like in this process?
We serve as the AI Sherpa — handling the full stack from infrastructure architecture on Google Cloud Platform through content pipeline automation and ongoing optimization. Our clients bring the expertise; we build the system that makes that expertise searchable, discoverable, and commercially productive. The technology, pipeline design, and optimization strategy are all managed by our team.
We just built something we haven’t seen anyone else do yet: an AI-powered image gallery pipeline that cross-references the most expensive keywords on Google with AI image generation to create SEO-optimized visual content at scale. Five gallery pages. Forty AI-generated images. All published in a single session. Here’s exactly how we did it — and why it matters.
The Thesis: High-CPC Keywords Need Visual Content Too
Everyone in SEO knows the water damage and penetration testing verticals command enormous cost-per-click values. Mesothelioma keywords hit $1,000+ CPC. Penetration testing quotes reach $659 CPC. Private jet charter keywords run $188/click. But here’s what most content marketers miss: Google Image Search captures a significant share of traffic in these verticals, and almost nobody is creating purpose-built, SEO-optimized image galleries for them.
The opportunity is straightforward. If someone searches for “water damage restoration photos” or “private jet charter photos” or “luxury rehab center photos,” they’re either a potential customer researching a high-value purchase or a professional creating content in that vertical. Either way, they represent high-intent traffic in categories where a single click is worth $50 to $1,000+ in Google Ads.
The Pipeline: DataForSEO + SpyFu + Imagen 4 + WordPress REST API
We built this pipeline using four integrated systems. First, DataForSEO and SpyFu APIs provided the keyword intelligence — we queried both platforms simultaneously to cross-reference the highest CPC keywords across every vertical in Google’s index. We filtered for keywords where image galleries would be both visually compelling and commercially valuable.
Second, Google Imagen 4 on Vertex AI generated photorealistic images for each gallery. We wrote detailed prompts specifying photography style, lighting, composition, and subject matter — then used negative prompts to suppress unwanted text and watermark artifacts that AI image generators sometimes produce. Each image was generated at high resolution and converted to WebP format at 82% quality, achieving file sizes between 34 KB and 300 KB — fast enough for Core Web Vitals while maintaining visual quality.
Third, every image was uploaded to WordPress via the REST API with programmatic injection of alt text, captions, descriptions, and SEO-friendly filenames. No manual uploading through the WordPress admin. No drag-and-drop. Pure API automation.
Fourth, the gallery pages themselves were built as fully optimized WordPress posts with triple JSON-LD schema (ImageGallery + FAQPage + Article), FAQ sections targeting featured snippets, AEO-optimized answer blocks, entity-rich prose for GEO visibility, and Yoast meta configuration — all constructed programmatically and published via the REST API.
What We Published: Five Galleries Across Five Verticals
In a single session, we published five complete image gallery pages targeting some of the most expensive keywords on Google:
Water Damage Restoration Photos — 8 images covering flooded rooms, burst pipes, mold growth, ceiling damage, and professional drying equipment. Surrounding keyword CPCs: $3–$47.
Penetration Testing Photos — 8 images of SOC environments, ethical hacker workstations, vulnerability scan reports, red team exercises, and server infrastructure. Surrounding CPCs up to $659.
Luxury Rehab Center Photos — 8 images of resort-style facilities, private suites, meditation gardens, gourmet kitchens, and holistic spa rooms. Surrounding CPCs: $136–$163.
Solar Panel Installation Photos — 8 images of rooftop arrays, installer crews, commercial solar farms, battery storage, and thermal inspections. Surrounding CPCs up to $193.
Private Jet Charter Photos — 8 images of aircraft at sunset, luxury cabins, glass cockpits, FBO terminals, bedroom suites, and VIP boarding. Surrounding CPCs up to $188.
That’s 40 unique AI-generated images, 5 fully optimized gallery pages, 20 FAQ questions with schema markup, and 15 JSON-LD schema objects — all deployed to production in a single automated session.
The Technical Stack
For anyone who wants to replicate this, here’s the exact stack: DataForSEO API for keyword research and CPC data (keyword_suggestions/live endpoint with CPC descending sort). SpyFu API for domain-level keyword intelligence and competitive analysis. Google Vertex AI running Imagen 4 (model: imagen-4.0-generate-001) in us-central1 for image generation, authenticated via GCP service account. Python Pillow for WebP conversion at quality 82 with method 6 compression. WordPress REST API for media upload (wp/v2/media) and post creation (wp/v2/posts) with direct Basic authentication. Claude for orchestrating the entire pipeline — from keyword research through image prompt engineering, API calls, content writing, schema generation, and publishing.
Why This Matters for SEO in 2026
Three trends make this pipeline increasingly valuable. First, Google’s Search Generative Experience and AI Overviews are pulling more image content into search results — visual galleries with proper schema markup are more likely to appear in these enriched results. Second, image search traffic is growing as visual intent increases across all demographics. Third, AI-generated images eliminate the cost barrier that previously made niche image content uneconomical — you no longer need a photographer, models, locations, or stock photo subscriptions to create professional visual content for any vertical.
The combination of high-CPC keyword targeting, AI image generation, and programmatic SEO optimization creates a repeatable system for capturing valuable traffic that most competitors aren’t even thinking about. The gallery pages we published today will compound in value as they index, earn backlinks from content creators looking for visual references, and capture long-tail image search queries across five of the most lucrative verticals on the internet.
This is what happens when you stop thinking about content as articles and start thinking about it as systems.
This video was generated from the original Tygart Media article using NotebookLM’s audio-to-video pipeline. The article that describes how we automate image production became the script for an AI-produced video about that automation — a recursive demonstration of the system it documents.
Watch: Build an Automated Image Pipeline That Writes Its Own Metadata
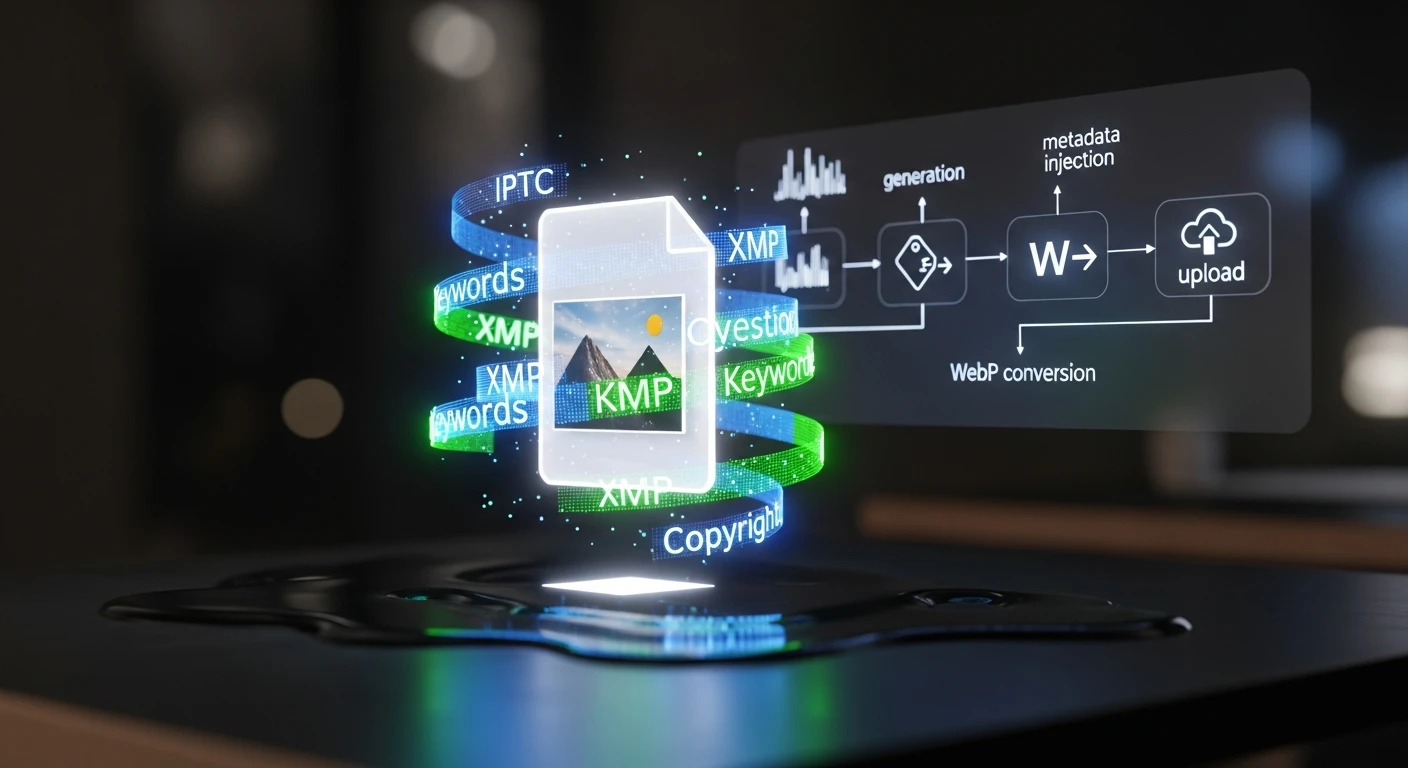
Every article needs a featured image. Every featured image needs metadata — IPTC tags, XMP data, alt text, captions, keywords. When you’re publishing 15–20 articles per week across 19 WordPress sites, manual image handling isn’t just tedious; it’s a bottleneck that guarantees inconsistency. This video walks through the exact automated pipeline we built to eliminate that bottleneck entirely.
The video breaks down every stage of the pipeline:
Stage 1: AI Image Generation — Calling Vertex AI Imagen with prompts derived from the article title, SEO keywords, and target intent. No stock photography. Every image is custom-generated to match the content it represents, with style guidance baked into the prompt templates.
Stage 2: IPTC/XMP Metadata Injection — Using exiftool to inject structured metadata into every image: title, description, keywords, copyright, creator attribution, and caption. XMP data includes structured fields about image intent — whether it’s a featured image, thumbnail, or social asset. This is what makes images visible to Google Images, Perplexity, and every AI crawler reading IPTC data.
Stage 3: WebP Conversion & Optimization — Converting to WebP format (40–50% smaller than JPG), optimizing to target sizes: featured images under 200KB, thumbnails under 80KB. This runs in a Cloud Run function that scales automatically.
Stage 4: WordPress Upload & Association — Hitting the WordPress REST API to upload the image, assign metadata in post meta fields, and attach it as the featured image. The post ID flows through the entire pipeline end-to-end.
Why IPTC Metadata Matters Now
This isn’t about SEO best practices from 2019. Google Images, Perplexity, ChatGPT’s browsing mode, and every major AI crawler now read IPTC metadata to understand image context. If your images don’t carry structured metadata, they’re invisible to answer engines. The pipeline solves this at the point of creation — metadata isn’t an afterthought applied later, it’s injected the moment the image is generated.
The results speak for themselves: within weeks of deploying the pipeline, we started ranking for image keywords we never explicitly optimized for. Google Images was picking up our IPTC-tagged images and surfacing them in searches related to the article content.
The Economics
The infrastructure cost is almost irrelevant: Vertex AI Imagen runs about $0.10 per image, Cloud Run stays within free tier for our volume, and storage is minimal. At 15–20 images per week, the total cost is roughly $8/month. The labor savings — eliminating manual image sourcing, editing, metadata tagging, and uploading — represent hours per week that now go to strategy and client delivery instead.
How This Video Was Made
The original article describing this pipeline was fed into Google NotebookLM, which analyzed the full text and generated an audio deep-dive covering the technical architecture, the metadata injection process, and the business rationale. That audio was converted to this video — making it a recursive demonstration: an AI system producing content about an AI system that produces content.
Read the Full Article
The video covers the architecture and results. The full article goes deeper into the technical implementation — the exact Vertex AI API calls, exiftool commands, WebP conversion parameters, and WordPress REST API patterns. If you’re building your own pipeline, start there.
This video was generated from the original Tygart Media article using NotebookLM’s audio-to-video pipeline — a live demonstration of the exact AI-first workflow we describe in the piece. The article became the script. AI became the production team. Total production cost: $0.
Most businesses assume enterprise-grade marketing automation requires enterprise-grade budgets. This video walks through the exact stack we use at Tygart Media to manage SEO, content production, analytics, and automation across 18 client websites — for under $50/month total.
The video breaks down every layer of the stack:
The AI Layer — Running open-source LLMs (Mistral 7B) via Ollama on cheap cloud instances for $8/month, handling 60% of tasks that would otherwise require paid API calls. Content summarization, data extraction, classification, and brainstorming — all self-hosted.
The Data Layer — Free API tiers from DataForSEO (5 calls/day), NewsAPI (100 requests/day), and SerpAPI (100 searches/month) that provide keyword research, trend detection, and SERP analysis at zero recurring cost.
The Infrastructure Layer — Google Cloud’s free tier delivering 2 million Cloud Run requests/month, 5GB storage, unlimited Cloud Scheduler jobs, and 1TB of BigQuery analysis. Enough to host, automate, log, and analyze everything.
The WordPress Layer — Self-hosted on GCP with open-source plugins, giving full control over the content management system without per-seat licensing fees.
The Analytics Layer — Plausible’s free tier for privacy-focused analytics: 50K pageviews/month, clean dashboards, no cookie headaches.
The Automation Layer — Zapier’s free tier (5 zaps) combined with GitHub Actions for CI/CD, creating a lightweight but functional automation backbone.
The Philosophy Behind $0
This isn’t about being cheap. It’s about being strategic. The video explains the core principle: start with free tiers, prove the workflow works, then upgrade only the components that become bottlenecks. Most businesses pay for tools they don’t fully use. The $0 stack forces you to understand exactly what each layer does before you spend a dollar on it.
The upgrade path is deliberate. When free tier limits get hit — and they will if you’re growing — you know exactly which component to scale because you’ve been running it long enough to understand the ROI. DataForSEO at 5 calls/day becomes DataForSEO at $0.01/call. Ollama on a small instance becomes Claude API for the reasoning-heavy tasks. The architecture doesn’t change. Only the throughput does.
How This Video Was Made
This video is itself a demonstration of the stack’s philosophy. The original article was written as part of our content pipeline. That article URL was fed into Google’s NotebookLM, which analyzed the full text and generated an audio deep-dive. That audio was then converted to video — an AI-produced visual breakdown of AI-produced content, created from AI-optimized infrastructure.
No video editor. No voiceover artist. No production budget. The content itself became the production brief, and AI handled the rest. This is what the $0 stack looks like in practice: the tools create the tools that create the content.
Read the Full Article
The video covers the highlights, but the full article goes deeper — with exact pricing breakdowns, tool-by-tool comparisons, API rate limits, and the specific workflow we use to batch operations for maximum free-tier efficiency. If you’re ready to build your own $0 stack, start there.
You’ve read the announcements. You’ve seen the demos. You know AI can automate half your workflow — but which half do you start with? When every new tool promises to “transform your business,” the hardest decision isn’t whether to adopt AI. It’s figuring out what to do first.
I run Tygart Media, where we manage SEO, content, and optimization across 18 WordPress sites for clients in restoration, luxury lending, healthcare, comedy, and more. Claude Cowork — Anthropic’s agentic AI for knowledge work — sits at the center of our operation. But last week I found myself staring at a list of 20 different Cowork capabilities I could implement, from scheduled site-wide SEO refreshes to building a private plugin marketplace. All of them sounded great. None of them told me where to start.
So I did what any data-driven agency owner should do: I stopped guessing and ran a Monte Carlo simulation.
Step 1: Research What Everyone Else Is Doing
Before building any model, I needed raw material. I spent a full session having Claude research how people across the internet are actually using Cowork — not the marketing copy, but the real workflows. We searched Twitter/X, Reddit threads, Substack power-user guides, developer communities, enterprise case studies, and Anthropic’s own documentation.
What emerged was a taxonomy of use cases that most people never see compiled in one place. The obvious ones — content production, sales outreach, meeting prep — were there. But the edge cases were more interesting: a user running a Tuesday scheduled task that scrapes newsletter ranking data, analyzes trends, and produces a weekly report showing the ten biggest gainers and losers. Another automating flight price tracking. Someone else using Computer Use to record a workflow in an image generation tool, then having Claude process an entire queue of prompts unattended.
The full research produced 20 implementation opportunities mapped to my specific workflow. Everything from scheduling site-wide SEO/AEO/GEO refresh cycles (which we already had the skills for) to building a GCP Fortress Architecture for regulated healthcare clients (which we didn’t). The question wasn’t whether these were good ideas. It was which ones would move the needle fastest for our clients.
Step 2: Score Every Opportunity on Five Dimensions
I needed a framework that could handle uncertainty honestly. Not a gut-feel ranking, but something that accounts for the fact that some estimates are more reliable than others. A Monte Carlo simulation does exactly that — it runs thousands of randomized scenarios to show you not just which option scores highest, but how confident you should be in that ranking.
Each of the 20 opportunities was scored on five dimensions, rated 1 to 10:
Client Delivery Impact — Does this improve what clients actually see and receive? This was weighted at 40% because, for an agency, client outcomes are the business.
Time Savings — How many hours per week does this free up from repetitive work? Weighted at 20%.
Revenue Impact — Does this directly generate or save money? Weighted at 15%.
Ease of Implementation — How hard is this to set up? Scored inversely (lower effort = higher score). Weighted at 15%.
Risk Safety — What’s the probability of failure or unintended complications? Also inverted. Weighted at 10%.
The weighting matters. If you’re a solopreneur optimizing for personal productivity, you might weight time savings at 40%. If you’re a venture-backed startup, revenue impact might dominate. For an agency where client retention drives everything, client delivery had to lead.
Step 3: Add Uncertainty and Run 10,000 Simulations
Here’s where Monte Carlo earns its keep. A simple weighted score would give you a single ranking, but it would lie to you about confidence. When I score “Private Plugin Marketplace” as a 9/10 on revenue impact, that’s a guess. When I score “Scheduled SEO Refresh” as a 10/10 on client delivery, that’s based on direct experience running these refreshes manually for months.
Each opportunity was assigned an uncertainty band — a standard deviation reflecting how confident I was in the base scores. Opportunities built on existing, proven skills got tight uncertainty (σ = 0.7–1.0). New builds requiring infrastructure I hadn’t tested got wider bands (σ = 1.5–2.0). The GCP Fortress Architecture, which involves standing up an isolated cloud environment, got the widest band at σ = 2.0.
Then we ran 10,000 iterations. In each iteration, every score for every opportunity was randomly perturbed within its uncertainty band using a normal distribution. The composite weighted score was recalculated each time. After 10,000 runs, each opportunity had a distribution of outcomes — a mean score, a median, and critically, a 90% confidence interval showing the range from pessimistic (5th percentile) to optimistic (95th percentile).
What the Data Said
The results organized themselves into four clean tiers. The top five — the “implement immediately” tier — shared three characteristics that I didn’t predict going in.
First, they were all automation of existing capabilities. Not a single new build made the top tier. The highest-scoring opportunity was scheduling monthly SEO/AEO/GEO refresh cycles across all 18 sites — something we already do manually. Automating it scored 8.4/10 with a tight confidence interval of 7.8 to 8.9. The infrastructure already existed. The skills were already built. The only missing piece was a cron expression.
Second, client delivery and time savings dominated together. The top five all scored 8+ on client delivery and 7+ on time savings. These weren’t either/or tradeoffs — the opportunities that produce better client deliverables also happen to be the ones that free up the most time. That’s not a coincidence. It’s the signature of mature automation: you’ve already figured out what good looks like, and now you’re removing yourself from the execution loop.
Third, new builds with high revenue potential ranked lower because of uncertainty. The Private Plugin Marketplace scored 9/10 on revenue impact — the highest of any opportunity. But it also carried an effort score of 8/10, a risk score of 5/10, and the widest confidence interval in the dataset (4.5 to 7.3). Monte Carlo correctly identified that high-reward/high-uncertainty bets should come after you’ve secured the reliable wins.
The Final Tier 1 Lineup
Here’s what we’re implementing immediately, in order:
Scheduled Site-Wide SEO/AEO/GEO Refresh Cycles (Score: 8.4) — Monthly full-stack optimization passes across all 18 client sites. Every post that needs a meta description update, FAQ block, entity enrichment, or schema injection gets it automatically on the first of the month.
Scheduled Cross-Pollination Batch Runs (Score: 8.2) — Every Tuesday, Claude identifies the highest-ranking pages across site families (luxury lending, restoration, business services) and creates locally-relevant variant articles on sister sites with natural backlinks to the authority page.
Weekly Content Intelligence Audits (Score: 8.1) — Every Monday morning, Claude audits all 18 sites for content gaps, thin posts, missing metadata, and persona-based opportunities. By the time I sit down at 9 AM, a prioritized report is waiting in Notion.
Auto Friday Client Reports (Score: 7.9) — Every Friday at 1 PM, Claude pulls the week’s data from SpyFu, WordPress, and Notion, then generates a professional PowerPoint deck and Excel spreadsheet for each client group.
Client Onboarding Automation Package (Score: 7.6) — A single-trigger pipeline that takes a new WordPress site from zero to fully audited, with knowledge files built, taxonomy designed, and an optimization roadmap produced. Triggered manually whenever we sign a new client.
Sixteen of the twenty opportunities run on our existing stack. The infrastructure is already built. The biggest wins come from scheduling and automating what already works.
Why This Approach Matters for Any Business
You don’t need to be running 18 WordPress sites to use this framework. The Monte Carlo approach works for any business facing a prioritization problem with uncertain inputs. The methodology is transferable:
Define your dimensions. What matters to your business? Client outcomes? Revenue? Speed to market? Cost reduction? Pick 3–5 and weight them honestly.
Score with uncertainty in mind. Don’t pretend you know exactly how hard something will be. Assign confidence bands. A proven workflow gets a tight band. An untested idea gets a wide one.
Let the math handle the rest. Ten thousand iterations will surface patterns your intuition misses. You’ll find that your “exciting new thing” ranks below your “boring automation of what works” — and that’s the right answer.
Tier your implementation. Don’t try to do everything at once. Tier 1 goes this week. Tier 2 goes next sprint. Tier 3 gets planned. Tier 4 stays in the backlog until the foundation is solid.
The biggest insight from this exercise wasn’t any single opportunity. It was the meta-pattern: the highest-impact moves are almost always automating what you already know how to do well. The new, shiny, high-risk bets have their place — but they belong in month two, after the reliable wins are running on autopilot.
The Tools Behind This
For anyone curious about the technical stack: the research was conducted in Claude Cowork using WebSearch across multiple source types. The Monte Carlo simulation was built in Python (numpy, pandas) with 10,000 iterations per opportunity. The scoring model used weighted composite scores with normal distribution randomization and clamped bounds. Results were visualized in an interactive HTML dashboard and the implementation was deployed as Cowork scheduled tasks — actual cron jobs that run autonomously on a weekly and monthly cadence.
The entire process — research, simulation, analysis, task creation, and this blog post — was completed in a single Cowork session. That’s the point. When the infrastructure is right, the question isn’t “can AI do this?” It’s “what should AI do first?” And now we have a data-driven answer.
{
“@context”: “https://schema.org”,
“@type”: “Article”,
“headline”: “I Used a Monte Carlo Simulation to Decide Which AI Tasks to Automate First — Heres What Won”,
“description”: “When you have 20 AI automation opportunities and can’t do them all at once, stop guessing. I ran 10,000 Monte Carlo simulations to rank which Claude Cowor”,
“datePublished”: “2026-03-31”,
“dateModified”: “2026-04-03”,
“author”: {
“@type”: “Person”,
“name”: “Will Tygart”,
“url”: “https://tygartmedia.com/about”
},
“publisher”: {
“@type”: “Organization”,
“name”: “Tygart Media”,
“url”: “https://tygartmedia.com”,
“logo”: {
“@type”: “ImageObject”,
“url”: “https://tygartmedia.com/wp-content/uploads/tygart-media-logo.png”
}
},
“mainEntityOfPage”: {
“@type”: “WebPage”,
“@id”: “https://tygartmedia.com/i-used-a-monte-carlo-simulation-to-decide-which-ai-tasks-to-automate-first-heres-what-won/”
}
}