The series where cheap, forgotten hardware becomes somebody’s AI assistant. Your junk drawer is a fleet.
Concept art: a 2011 handheld running a real assistant. AI-generated illustration.
On October 3, a developer named David Ruiz posted a 19-second video that made Alexandr Wang swear. “no fucking way,” Wang quote-posted. “muse gadget on Nintendo 3DS.”
What Ruiz built: a homebrew game running on actual Nintendo 3DS hardware — a 2011 handheld — where you walk around a pixel-art version of your house and talk to an in-game assistant called Dash. In the clip, he asks Dash if the 3D printer is done. Dash thinks, then answers. The game isn’t pretending to control his smart home. It actually does.
Your first reaction might be that this is stupid. A game on a fifteen-year-old handheld to check a 3D printer? Fair. Mine was too, for about ten seconds.
Then the pattern lands, and it’s big: an AI agent, embodied in a game world, running on weak old hardware, acting on the real world. The demo is a toy. The pattern is a platform shift.
Chat won the first round. Worlds win the next one.
Every AI assistant you’ve ever used lives in a rectangle with a text box. That was the right interface for 2023. But watch what Ruiz did: he didn’t build a better chatbot. He put the assistant inside a world — a little room with wooden floors, a kitchen, a dog — and gave you a character to talk to instead of a prompt box.
The room in the game mirrors his real home. That’s the tell. The game world is a digital twin, and the assistant is its voice. You don’t open an app and navigate menus; you walk up to the little guy and ask.
If it runs on a 3DS, it runs on everything.
This is the part Wang reacted to, and it’s the most underrated part. The Nintendo 3DS is ancient, underpowered hardware. If a Muse gadget runs there, the hardware constraint is gone. That means:
Every old tablet, e-ink frame, car dashboard, and kiosk becomes an agent surface. Your junk drawer is a fleet.
Agents can run locally, on-device — faster, private, and still working when the internet dies.
Nostalgia becomes an adoption cheat code. People will try AI on a 3DS who would never open a chatbot.
The crossovers nobody’s talking about yet.
Follow the pattern out and it stops looking like a gaming story:
Digital twins you can walk through. A facility manager strolls a pixel version of their building, asks the assistant about the HVAC on floor three, and dispatches a real work order — all inside the game. The twin stops being a dashboard and becomes a place.
NPCs that do real work. Game characters that aren’t scripted but genuinely useful — a shopkeeper that orders your groceries, a concierge that manages your calendar while you play.
The Tamagotchi that runs your house. A gamified smart home for everyone intimidated by apps — kids, grandparents. You don’t configure automations; you talk to the little guy in the room.
E-waste as a distribution channel. Millions of abandoned devices become agent terminals. The hardware’s already built and sitting in drawers.
Gadgets as the app store for agents. “Muse gadget” is the tell in Wang’s post. The game is just a host. Any developer can build a gadget for any surface — and that marketplace is the real product.
The honest caveats.
The facts here are thin: one demo, one quote-post, no follow-up detail from Wang. This is analysis, not reporting — a forecast, labeled as one. The demo could stay a novelty. Platforms have died on cuter ideas.
But here’s the thing about platform shifts: they always start looking stupid. The first iPhone apps were fart apps. The first people to put a chatbot in a game room on a dead handheld are the ones who see where the puck is going.
The forecast.
Chat was the interface that taught the world to talk to machines. The next interface won’t be a better chat window — it’ll be a world you step into, with an assistant standing in it, ready to act on the real one. Ruiz just showed us the rough draft, running on a toy from 2011.
Someone’s going to build the polished version. The only question is who gets there first.
Field notes: the first hunt
Here’s the fun part: the hardware for this future is already sitting on Facebook Marketplace, priced like garbage. Our daily sweep turned up this morning’s haul:
Nintendo 3DS XL — FREE, like new, Atlanta (listing)
Nintendo 3DS XL — $1, good, North Lauderdale FL (listing)
3 “new” 3DS XLs — $1, like new, Hopewell Junction NY (listing)
Pre-modded 3DS, 482 games — $20, like new, Miami (listing)
3 Fire tablets as a lot — $1, listed new, Littleton CO (listing)
Raspberry Pi Pico 2 — FREE, like new, Lockport IL (listing) — two from one seller
Fair warning: $1-and-free listings are often bait or mispriced. Nothing here is verified. The hunt is half the show.
Short answer: Yes — the words matter more than the stars. When someone asks for “a reliable plumber who handles emergency leaks,” the AI recommends the business whose reviews keep saying “quick response” and “emergency repair” — not the one with fifty generic five-stars. Review text is the evidence the bot quotes. A wall of “great service” gives it nothing to quote.
How the bot actually uses your reviews
Think about what the AI is doing when it answers “who should I call.” It’s matching the words in the question to evidence it can find. If the question asks for emergency leak help, it looks for businesses with evidence of emergency leak help. And the richest source of that evidence isn’t your website copy — it’s your customers describing what you did, in their own words.
One analysis of business profiles in AI search put it directly: “If a user asks for a ‘reliable plumber who handles emergency leaks,’ the AI will likely recommend a business whose reviews frequently mention ‘quick response’ and ’emergency repair’ over a business that simply has those terms in its meta description.” Businesses with specific, keyword-rich testimonials get cited more often than businesses with generic five-star ratings and no text.
A review-industry breakdown this month named vague reviews as one of the three mistakes sending customers to competitors: “great service” instead of “same-day AC repair in Phoenix.” And review audits keep finding the same thing — AI answers quote review text verbatim. Your customers’ words become the bot’s answer.
The star-rating trap
Most owners chase stars. Stars are visible, countable, and feel like the scoreboard. But a five-star rating with no text tells the AI almost nothing — it’s a number without a story. Forty detailed reviews at 4.8 stars will beat a hundred empty five-stars, because the detailed reviews give the bot something to match against the question and something to quote in the answer.
This is also why review platforms matter less than review content here. The question isn’t just where your reviews live — it’s whether the words in them describe the work you actually want to be recommended for.
The review-request script (free, repeatable)
You can’t write your own reviews. But you can ask for better ones — and most owners never do. After a job, when the customer is happy, ask them to mention two things: what you did and where. That’s it.
“If you have a minute to leave a review, it really helps when folks mention the job — like the water heater swap — and the town. Just a sentence is perfect.”
That’s the whole script. You’re not scripting fake reviews or stuffing keywords — you’re asking real customers to include the specifics they’d naturally mention anyway. “Mike replaced our water heater the same day it died, here in Mesa” is a quotable piece of evidence. “Great service!!” is not.
What to actually do about it
Read your last twenty reviews. Count how many mention a specific job or a specific town. If the answer is “almost none,” you have the generic-review problem.
Start the two-thing ask this week. What you did, and where. Every finished job, every happy customer. It compounds.
Don’t neglect the unhappy ones. A detailed critical review is still evidence the bot reads — respond to it well, and the response becomes part of the record too.
Keep it honest. Never write reviews yourself, never pay for them, never hand customers pre-written text. The specifics have to be real — fabricated detail is both against every platform’s rules and, increasingly, detectable.
What’s actually known — and what’s not
Known: AI answers quote review text verbatim, and businesses whose reviews describe specific jobs in specific places get cited more often than businesses with generic ratings. The review-request script — ask for the job and the town — is a free, ownable fix no competitor can block.
Not known: nobody has published a controlled test measuring naming rate against review-text specificity for trades businesses — the evidence is observational and mechanism-level, not a measured curve. What’s missing is someone running the test: same market, similar star counts, specific-text versus generic-text reviews, measured naming rates. That’s a test worth running.
Short answer: You don’t have to pay the directories — but you do have to be mentioned. When someone asks ChatGPT “who should I call,” the pages it reads are mostly the ones that rank for that question, and those are usually “best of” listicles. Businesses that show up in the two or three listicles ranking on Bing for their trade and city get named. Businesses with no mentions anywhere get named in only 2.8% of relevant answers.
The numbers behind the listicles
This isn’t a hunch — it’s measured:
“Best of” list articles account for roughly 21% of all AI citations (arXiv 2606.20065).
Brands with no citations on their own site and no mentions elsewhere were named in only 2.8% of relevant ChatGPT answers — across a 34,960-prompt study (arXiv 2609.23162).
One agency’s check of ChatGPT answers found 95% pointed to a directory as the source.
A Bend, Oregon owner’s check this month put it in plain terms: the pages ChatGPT reads are “mostly the ones that rank for the query and the ones that list or compare providers.” A Bend plumber sitting in the two or three “best plumbers in Bend” lists that rank on Bing is far more likely to be named than one whose only mention is their own homepage.
Why this feels unfair (and partly is)
Contractors resent listicles and directories as pay-to-play machines, and they’re not wrong to be suspicious. The directories sell placement, sell leads, and sell ads against the very searches you want to win. Being told “the bot reads the listicle” can sound like being told to feed the beast.
But there’s a difference between paying the directories and being listed on them. Most “best of” pages have free listing paths. The bot doesn’t know or care whether you paid — it cares whether your name, trade, and town appear on a page that ranks for the question being asked.
The misfire side: listicles can get you wrong
A Plant City plumber’s owner-written FAQ documents the other edge of this: “A ‘serves Plant City’ line on a directory can mean a truck that drives over from another metro when the board has a gap.” His shop is headquartered in Plant City; the listicles hand the town to whoever bought the line. If you’re not watching your directory listings, the listicle isn’t just ignoring you — it may be actively mislocating you.
What to actually do about it
Find your two or three. On Bing, search “best [your trade] in [your city]” the way a homeowner would. The listicles that rank are the ones the bot reads. That’s your list — not fifty directories, just the two or three that actually rank.
Get listed on the free path. Claim or create the free listing on each. Fill it out completely: services, service area, phone number, website.
Keep your facts identical everywhere. Same business name, same phone number, same towns on every listing and your own site. Conflicting facts are how you get skipped — or misdescribed.
Fix wrong information. If a listicle has your old phone number, the wrong town, or a competitor’s truck on your line, correct it. The bot quotes what’s there.
You don’t need the ads. Paid placement on a directory is a separate purchase from being listed. The citation evidence comes from the listing, not the ad spend.
What’s actually known — and what’s not
Known: listicles and directories are a major citation source for AI answers — roughly a fifth of citations, and near-total absence from them collapses your naming rate to single digits. The fix is getting accurately listed on the few that rank, not buying your way onto all of them.
Not known: exactly which listicles any given engine prefers for any given trade and city — that shifts with rankings. Nobody has published a per-market map of “these three listicles decide the plumber answers in Phoenix.” The practical move is checking your own market’s rankings directly, because that’s what the bot is reading today.
Short answer: Mostly, yes. When ChatGPT goes looking for live information on the web, it searches through Bing’s index — not Google’s. If your business isn’t indexed by Bing and isn’t claimed on Bing Places, ChatGPT’s live-search layer has no way to find you. Everything you built on Google — your rankings, your reviews, your Google Business Profile — doesn’t transfer to that layer.
Why your Google work doesn’t carry over
This is the part that stings. You spent years — maybe money, too — getting your Google presence right. Then a homeowner asks ChatGPT who to call, and none of it counts. That’s because ChatGPT reaches the open web through Microsoft’s Bing search infrastructure, not Google’s. One agency put it bluntly in a widely syndicated piece this year: “It Runs on Bing, Not Google.” A contractor who invested everything into Google rankings and ignored Bing Places is, in their words, essentially invisible to ChatGPT’s search layer.
An SEO vendor’s FAQ answers the owner version of this question directly: “Should I optimize for Bing if I already rank well on Google? Yes, ChatGPT uses Bing’s index when browsing the web. If you’re not indexed in Bing and listed in Bing Places, ChatGPT cannot find your business.”
What it looks like in practice
A Vienna-based test from October 2026 ran the scenario end to end: someone asked ChatGPT to recommend an installer in Vienna. ChatGPT searched live via Bing, returned three competitors — and marked the tester’s own firm “NICHT DABEI” (not there). The firm wasn’t failing at marketing. It was failing at being in the index the bot actually reads.
A Bend, Oregon owner’s check the same month found the same shape: the competitor who gets named is the one who ranks on Bing for the question being asked. Your Google position never enters the picture.
The “my SEO guy says we’re covered” myth
If your SEO provider tells you your Google work covers you for AI search, ask them one question: when did you last check my Bing presence? Google-only SEO is a real thing — plenty of shops do excellent Google work and never touch Bing, because for a decade that was a defensible call. It isn’t anymore. The AI layer that now sits between the homeowner and the phone call reads a different index, and “we’re covered” without a Bing check is a guess.
What to actually do about it
The good news: this is a five-minute fix, not a six-month project.
Claim your Bing Places listing. It’s free, it’s separate from your Google Business Profile, and it’s a real listing that feeds ChatGPT’s search layer. Most contractors have never claimed theirs.
Check whether Bing has indexed your site. Search site:yourwebsite.com on Bing. If nothing comes up, Bing doesn’t know your site exists — and neither does ChatGPT’s browsing layer.
Set up Bing Webmaster Tools. Free, takes minutes, and shows you exactly what Bing sees (or doesn’t).
Keep your facts identical everywhere. Same business name, same phone number, same service area on your site, Bing Places, and Google Business Profile. Mismatched facts are how businesses get misdescribed or skipped.
What’s actually known — and what’s not
Known: ChatGPT’s live web browsing runs on Bing’s search infrastructure. Bing Places is a real business listing that feeds that layer — unlike the mythical “ChatGPT business registry,” which doesn’t exist. Contractors who are Google-only are structurally invisible to ChatGPT’s search layer until they fix their Bing presence.
Not known: exactly how much weight Bing Places carries versus organic Bing rankings in any given answer, or how often the underlying data refreshes. Nobody has published a controlled test of “claimed Bing Places on this date, started appearing on that date” for trades businesses. The mechanism is well-evidenced; the precise timing isn’t.
This is the Sunday morning Storm Tracker desk for October 4, 2026. Overnight into this morning the organized severe window stayed small, but it is no longer empty. The Storm Prediction Center 1300 UTC Day 1 convective outlook, updated 7:43 a.m. CDT by Guyer and Dean and valid 1300 UTC Sunday through 1200 UTC Monday, carries a Marginal Risk of severe thunderstorms across the coastal Florida Panhandle. The summary line is short: a few rotating thunderstorms are possible today across the coastal Florida Panhandle.
The larger restoration ticket is water, not a watch box. The Weather Prediction Center raised a Moderate Risk of excessive rainfall for the lower Texas coast, and National Weather Service flash flood warnings were already in effect before 9 a.m. CDT on the Emerald Coast. Conditions change fast. Verify with the National Weather Service for the specific county or ZIP before you roll.
What is live this morning
No convective watches are currently valid. SPC’s watch page, updated 12:04 UTC Sunday, lists none. The most recently issued watch is still Severe Thunderstorm Watch 676, a Wednesday, September 30 product for west-central Texas. Nothing from Saturday night carried into Sunday morning as a severe thunderstorm or tornado watch. The 0100 UTC Day 1 outlook Saturday night, written by Marsh, had no severe areas at all. The Marginal was added on the 0600 UTC cycle and kept on the 1300 UTC update.
SPC local storm reports for the 1200 UTC Saturday through 1159 UTC Sunday window, and for the new Sunday convective day that opened at 1200 UTC, show no tornado, hail, or wind reports received. The overnight severe hit list is empty. What verified overnight and into the morning is rain, not a wind or hail survey.
The Marginal area on the 1300 UTC graphic covers about 7,329 square miles and about 828,936 people. Larger population centers listed by SPC include Pensacola, Panama City, Ferry Pass, Wright, and Brent. The 0600 UTC probabilistic table placed a 2 percent tornado risk on that same coastal strip and listed no damaging-wind or large-hail areas. The 1300 UTC discussion does not add a wind or hail probability. The threat, if it verifies, is a brief, transient low-level circulation near the coast.
Hotspot 1 — Florida Panhandle and the central Gulf Coast
A stalled or slow-southeastward-moving surface front sits across the Southeast and Deep South. South of it, precipitable water is in excess of 2 inches, and the 0600 UTC discussion cited mean precipitable water near 2.5 inches on the Florida Panhandle with mean MUCAPE generally 500 J/kg or less. Scattered showers and thunderstorms were already common early today south of the front, including the northern Gulf. SPC notes some guidance, most notably recent NAM runs, for weak offshore surface low development and a related increase in low-level flow and storm-relative helicity. If that trend holds, storms near the coast can spin up briefly. The related hazard is a waterspout or a brief tornado, mainly near the coast.
That marine piece is already on the warning map. National Weather Service Tallahassee, issued by Jacksonville, put special marine warnings up before 8 a.m. CDT for coastal waters from the Okaloosa–Walton line toward Mexico Beach, and again toward Apalachee Bay, for waterspouts and wind gusts of 34 knots or greater. Mobile, issued by New Orleans, had a special marine warning for coastal waters from the Okaloosa–Walton line to Pensacola. Those are marine products. They are not a land tornado warning, and none was on the national summary at the morning scan.
Water is the product that is already warning, not watching. At 6:52 a.m. CDT, National Weather Service Mobile, issued by New Orleans, issued a flash flood warning for southeastern Okaloosa County until 9:45 a.m. CDT. Radar indicated 2 to 4 inches already down, with another 1 to 3 inches possible. Locations named in the warning include Wright, Fort Walton Beach, Niceville, Destin, Eglin Air Force Base, Valparaiso, and Mary Esther. At 7:38 a.m. CDT, Tallahassee, issued by Jacksonville, issued a flash flood warning for west-central Bay County and southwestern Walton County until 10:45 a.m. CDT. Radar indicated 1 to 3 inches already down, with another 1 to 2 inches possible. Locations include Santa Rosa Beach, Freeport, Grayton Beach, Seaside, Sandestin, Inlet Beach, and Miramar Beach.
Flood watches frame that warning. Mobile’s flood watch remains through this evening for Mobile and Baldwin counties in southwest Alabama and for Escambia, Santa Rosa, and Okaloosa counties in northwest Florida, including Pensacola, Gulf Shores, and Fort Walton Beach. Additional rainfall of 4 to 6 inches is expected, with locally higher amounts up to 10 inches. Tallahassee’s flood watch remains through Monday morning for Walton, Holmes, Washington, Bay, and Gulf counties, and a separate watch through Monday morning covers southeast Alabama (Geneva and Houston), the Florida Big Bend including Tallahassee, and south-central Georgia including Albany, Thomasville, and Valdosta. Additional totals of 2 to 6 inches are forecast, locally up to 10 inches along the Emerald Coast. New Orleans holds a flood watch through this evening for coastal Mississippi (Hancock, Harrison, and Jackson counties, including Gulfport and Biloxi) and for southeast Louisiana including New Orleans, with an additional 3 to 5 inches possible. Jacksonville has a flood watch from noon today through Monday morning for the Georgia coast, where prior rain has already cut flash-flood guidance.
WPC’s Day 1 Excessive Rainfall Outlook, updated 0738 UTC Sunday and valid 12 UTC Sunday through 12 UTC Monday, kept an enhanced Slight Risk from Mobile Bay east to the Emerald and Forgotten coasts and deferred a Moderate upgrade there after coordination with offices Mobile and Tallahassee. Forecaster Weiss cited 2 to 3 inch-per-hour rates, precipitable water above 2.25 to 2.5 inches, and training where Corfidi vectors collapse. Some areas can see 3 to 5 inches today, locally as much as 8 inches. A separate Georgia-coast signal is centered near Savannah, with compromised flash-flood guidance of 1 to 2 inches in three hours.
Restoration read: staff the warning, not the Marginal polygon. Okaloosa, Walton, and Bay are the live water board this morning. Pensacola to Panama City is the brief-tornado strip if the offshore low tightens low-level shear. This is wet drywall, flooring, and a short mold clock where water enters. It is not a regional roof or hail crew. Do not treat a special marine warning as a land damage survey.
Hotspot 2 — Lower Texas coast
The highest excessive-rain category on the board is not the Panhandle. WPC raised a targeted Moderate Risk for the lower Texas coast between Brownsville and Corpus Christi after coordination with offices Brownsville and Corpus Christi. Convection developing over the Gulf is expected to track southwest into moist inflow and push onshore repeatedly. Rates of 2 to 3 inches per hour could produce local maxima in excess of 10 inches. Both the REFS and HREF indicate a greater than 50 percent chance of at least 8 inches. Recent rain has already been significant in spots: 2 to 4 inches in the last 12 hours, and up to 8 inches in the last three days. Sandy soils keep flash-flood guidance elevated, but WPC still flags locally significant impacts if the core crosses urban areas or more sensitive soils.
A Marginal Risk of excessive rainfall was joined along the immediate western Gulf Coast for possible onshore drift of heavy rain through the morning and afternoon. That is a lower bar than the Moderate strip from Brownsville to Corpus Christi. A coastal flood advisory is also in effect until 2 p.m. CDT for minor coastal flooding on the Aransas, Kleberg, and Nueces islands. That is tide and surge on the islands, not a convective watch.
Restoration read: Brownsville, Corpus Christi, and the communities between them are the new volume ticket. Saturday’s Slight Risk on this same coast is now a Moderate. Stage for street flooding and first-floor water only where a warning or a closed road verifies. Do not send the Panhandle crew and the Texas coast crew as if they are one storm.
What expired, and what is still just a river
Saturday’s Day 1 outlook had no severe areas, and Saturday’s storm-report page stayed empty. The Gulf Coast Slight Risk of excessive rain from Saturday is the parent of this morning’s watches, not a separate event. Iowa river flood warnings continued early Sunday on the Iowa River near Tama, Black Hawk Creek at Hudson, the South Skunk River at Colfax, and the Des Moines and Raccoon rivers at Des Moines. Those are river-stage tickets. They are not a convective watch and not a new storm-damage board.
Tropics — not a U.S. land desk
National Hurricane Center Advisory 29 at 2:00 a.m. MST Sunday places Hurricane Rachel near 20.2°N, 113.2°W, moving west-northwest at 5 mph, with maximum sustained winds of 100 mph and a minimum pressure of 968 mb. Rachel strengthened a little and remains well southwest of Baja California. The hurricane warnings on the morning national summary are offshore-waters products for the eastern Pacific within 250 nautical miles of Mexico, including waters near the Revillagigedo Islands and Cabo San Lucas. That is not a U.S. landfall.
Hurricane Nolo, at 11:00 p.m. HST Saturday, was near 23.6°N, 176.7°W, moving west at 18 mph with winds of 110 mph, and is expected to cross the International Date Line on Sunday. It is not a U.S. mainland threat. The Atlantic basin has no tropical cyclones this morning. The Gulf rain is tied to the stalled front and deep moisture, not to a named storm making landfall.
Pulse table
Region
Main threats
SPC / WPC / NWS level
Status this morning
Coastal Florida Panhandle
Brief tornado, waterspout
SPC Marginal; 2% tornado on 0600 UTC
Live today; no convective watch
Okaloosa, Walton, Bay counties
Flash flood
Flash flood warnings to mid-morning
Live; 1–4 inches already indicated
Mobile Bay to Emerald Coast
Training heavy rain
WPC Slight, upgrade deferred; flood watches
4–6 inches more, locally 8–10
SE Louisiana, coastal Mississippi
Heavy rain
Flood watch through this evening
Additional 3–5 inches possible
Lower Texas coast
Extreme rain rates
WPC Moderate
Local maxima above 10 inches possible
Georgia coast near Savannah
Repeated heavy rain
Flood watch noon through Monday morning
Soils already partly saturated
U.S. mainland tropics
None
Atlantic clear; Rachel SW of Baja
Offshore Mexico warnings only
What this means for restoration teams
There is still no wind-driven roof board on the Day 1 outlook. The Marginal is a coastal spin-up risk, not a hail or widespread damaging-wind risk. A 2-to-3 inch-per-hour rate is wet drywall and a 24-to-48-hour mold clock only where water actually enters. High flash-flood guidance on sandy Texas soils means part of the Moderate Risk will not produce a claim. Staff the warning polygon in Okaloosa, Walton, and Bay first. Treat Brownsville to Corpus Christi as the volume board if cells come onshore this afternoon. The empty SPC report page means there is no new hail or tornado survey from overnight.
Next check
The next Day 1 convective outlook is scheduled by 1630 UTC. Day 2, valid Monday, carries no severe thunderstorm areas. The afternoon desk should re-read the WPC Moderate Risk, any new flash flood warnings on the Panhandle, and whether the brief-tornado trend still holds before treating this morning polygon as still live. Flood watches on the Panhandle run through Monday morning. Mobile, New Orleans, and the lower Texas coast are today’s shorter fuse.
Disclaimer: This is a morning desk summary of public National Weather Service, Storm Prediction Center, Weather Prediction Center, and National Hurricane Center products. It is not a warning, not a forecast for a specific address, and not a substitute for local NWS products. Watches and warnings expire and get replaced. Confirm the county or ZIP on weather.gov before travel or work.
This is the Saturday afternoon Storm Tracker desk for October 3, 2026. The organized severe window is still closed. The Storm Prediction Center 2000 UTC Day 1 convective outlook, updated 2:46 p.m. CDT by Thornton and valid 2000 UTC Saturday through 1200 UTC Sunday, carries no severe thunderstorm areas. The summary line is unchanged from the morning issuance: organized severe thunderstorms are not forecast through tonight. The 20z update made only minor adjustments to the general thunder line.
What is organized this afternoon is water, not wind or hail. Restoration exposure is coastal rain on the central Gulf Coast and the lower Texas coast, plus river stages already above flood stage in eastern Iowa. There is no convective watch, no mesoscale discussion, and no SPC local storm report on the board. Conditions change fast. Verify with the National Weather Service for the specific county or ZIP before you roll.
What is live this afternoon
No convective watches are currently valid. SPC’s watch page, updated 21:16 UTC Saturday, lists none. The most recently issued watch remains Severe Thunderstorm Watch 676. No mesoscale discussions are in effect as of 21:10 UTC; the most recently issued discussion is MD 2345. The national watches-and-warnings text summary does not show a live Severe Thunderstorm Warning or Tornado Warning this afternoon.
SPC local storm reports for the Saturday convective day, 1200 UTC Saturday through 1159 UTC Sunday, show no tornado, hail, or wind reports received as of this desk. The afternoon severe hit list is empty. Showers and low-topped thunderstorms over parts of the Dakotas are spreading into Minnesota. Surface dewpoints are generally in the 40s. A pocket of weak instability can support occasional lightning, and convectively enhanced wind gusts may occur as low-level lapse rates steepen, but SPC keeps the overall severe-wind risk low because instability is minimal.
The Weather Prediction Center Day 1 Excessive Rainfall Outlook, updated 0738 UTC Saturday and valid 12 UTC Saturday through 12 UTC Sunday, still holds a Slight Risk of excessive rainfall for the central Gulf Coast and the lower Texas coast. Forecaster Wegman left both coastal Slight Risk areas in place and kept a higher-end Slight Risk from New Orleans through much of the western Florida Panhandle, citing urban drainage and rainfall volume. There is no Marginal, Slight, Enhanced, Moderate, or High severe-risk area on the Day 1 categorical map.
Hotspot 1 — Central Gulf Coast
A tropical wave moving across the Gulf is funneling record to near-record atmospheric moisture into much of the Gulf Coast. A 15 to 25 knot southerly flow at 850 mb supports numerous showers and thunderstorms into the central Gulf Coast today and tonight. Precipitable water is at or above 2.5 inches for many areas. Cloud cover and the October sun should limit instability away from the coast, so cells that reach the shoreline are not expected to travel far inland without weakening. A weak mid- and upper-level wave centered over the Bay of Campeche is aiding the northward moisture push. SPC still expects this convection to stay disorganized, with weak low-level winds.
WPC’s coast can expect 3 to 6 inches of rain today, with locally higher amounts. Flash-flood guidance is high and soils have been dry, but the volume can still overcome that in urban drainage from New Orleans through the western Florida Panhandle. Mississippi and Alabama coastal counties sit in the same Slight Risk envelope. A nearly stationary front from south and coastal Texas into the Southeast and Carolinas remains the broader thunderstorm focus. Poor lapse rates aloft and weak deep-layer shear should limit organized severe storms along that front through tonight.
Cities and counties to watch: New Orleans and the south-shore and east-bank parishes, coastal Mississippi from Hancock through Jackson County, Mobile and Baldwin counties in Alabama, and the western Florida Panhandle from Pensacola toward Panama City. River products already on the board are not the same as a flash-flood warning. National Weather Service Mobile, issued by New Orleans, has a flood warning for the Styx River near Elsanor in Baldwin County for minor flooding from Sunday evening into Monday morning, with a forecast crest of 12.3 feet early Monday against a 12.0-foot flood stage. A separate flood warning covers the Shoal River near Crestview in Okaloosa County for minor flooding from Monday evening into Thursday morning, crest forecast 9.0 feet Tuesday against an 8.0-foot flood stage.
Restoration read: water first, and only where a warning or measured street flood verifies. Stage extractors and moisture meters for urban low spots and slab-on-grade first floors. This is not a wind or hail board. Do not staff a regional roof crew on a Slight Risk of excessive rainfall. The Styx and Shoal warnings are river-stage tickets for later tonight through early next week, not an afternoon structural-wind call.
Hotspot 2 — Lower Texas coast
The second Slight Risk remains on the coast of Deep South Texas. Onshore northeasterly flow of the same deep tropical moisture may reach urban areas such as Brownsville. Because this stretch of coast sits roughly perpendicular to the mean flow, WPC expects the onshore push to let convection move a few miles inland before it dissipates. No change was made to that Slight Risk area on the 0738 UTC update.
Friday’s central Texas excessive-rain story is a different board. Those time-limited products are not the Saturday Slight Risk. If a river or areal flood warning is still up in central or south-central Texas, treat it as yesterday’s water still in the channel.
Restoration read: Brownsville and the lower Texas coast are the new water ticket if cells train against the coast. Do not send the same crew to the Gulf Coast polygon and a leftover central Texas channel without checking which county has a warning now.
Hotspot 3 — Dakotas into Minnesota, and Iowa river stages
A shortwave trough in the northern mid-level westerlies continues east across the northern Plains and Upper Midwest. Showers and low-topped storms ongoing over parts of the Dakotas spread into Minnesota this afternoon. SPC allows a convectively enhanced gust as lapse rates steepen. The severe risk stays low. There is no watch and no storm report to hang a roof or tree crew on.
Eastern Iowa is the leftover water ticket. National Weather Service Quad Cities flood statements at 9:07 a.m. CDT Saturday keep a major flood warning on the Wapsipinicon River near De Witt 4S, affecting Clinton and Scott counties, until further notice. The stage was 12.9 feet at 8:30 a.m., flood stage is 11.0 feet, and impacts at 13.0 feet include residences along the river. The North Skunk River near Sigourney, Keokuk County, remains in a moderate flood warning until late Sunday night, stage 18.4 feet against a 16.0-foot flood stage, mostly agricultural land. The Skunk River at Augusta, affecting Lee, Henry, and Des Moines counties, remains in a minor flood warning until Sunday evening, stage 16.9 feet against a 15.0-foot flood stage.
Restoration read: the Wapsipinicon near De Witt is the residential river ticket if water is already in yards or first floors. The Skunk statements are mostly agricultural. Neither is a new convective watch, and neither produced an SPC wind or hail report today.
Just hit
The last 24 hours did not add a severe-report ticket. SPC’s Saturday report page has no tornado, hail, or wind reports. Friday night into Saturday morning did not leave a new hail or tornado survey on the filtered report page. The tickets already open are river stages: major flooding on the Wapsipinicon near De Witt, moderate flooding on the North Skunk near Sigourney, and minor flooding on the Skunk at Augusta. Gulf Coast river rises on the Styx and Shoal are forecast products for Sunday night into early next week, not claims already logged this afternoon.
Pulse table
Region
Main threats
SPC / WPC / NWS level
Status this afternoon
Central Gulf Coast (SE LA, coastal MS/AL, western FL Panhandle)
Heavy rain, urban flash flood
WPC Slight, higher-end on the coast
Live today and tonight; 3–6 inches, locally higher
Lower Texas coast (Brownsville)
Onshore heavy rain
WPC Slight
Live; cells may push a few miles inland
Dakotas into Minnesota
Low-topped storms, gusts
No severe area
Spreading east; severe risk low
Southeast front into the Carolinas
General thunderstorms
No severe area
Weak shear, poor lapse rates
Eastern Iowa rivers
River flood, some residences
Flood warnings, not a watch
Wapsipinicon major; Skunk moderate to minor
Baldwin AL / Okaloosa FL rivers
Minor river flood later
Flood warnings issued this morning
Styx Sunday night; Shoal Monday night
U.S. mainland tropics
None
Rachel SW of Baja; no coastal warnings
Not a U.S. land desk
What this means for restoration teams
There is no wind-driven roof board on the Day 1 outlook. A 3-to-6-inch coastal rain is wet drywall, flooring, and a 24-to-48-hour mold clock only where water actually enters. High flash-flood guidance and dry soils mean many miles of the Slight Risk will not produce a claim. Staff the warning, not the polygon. Urban New Orleans through the western Florida Panhandle is the higher-end piece of the same Slight Risk because of drainage, not because a watch is up.
Eastern Iowa is the only residential water ticket already on a river gauge this afternoon, and it is the Wapsipinicon near De Witt, not a statewide Iowa event. Southwest Kansas and central Texas remain yesterday’s water only if a flood statement is still valid. The empty SPC report page means there is no new hail, tree, or tornado survey from today.
What this is not
This is not a derecho, not a tornado outbreak, and not a U.S. hurricane landfall. Hurricane Rachel, Advisory information at 2:00 p.m. MST Saturday, is near 19.8°N, 112.5°W, about 270 miles southwest of the southern tip of Baja California, moving west-northwest at 5 mph, with maximum sustained winds of 80 mph. There are no coastal watches or warnings in effect. A slow west to west-northwest motion continues through the weekend, away from the U.S. mainland. Swells can affect west-central Mexico and the Baja California Peninsula. That is a marine hazard, not a U.S. land ticket. Hurricane warnings on the national summary this afternoon are offshore-waters products for the eastern Pacific within 250 nautical miles of Mexico, not U.S. coastal warnings.
Hurricane Nolo is a Central Pacific system accelerating west and expected to cross the International Date Line on Sunday. It is not a U.S. mainland threat. The Atlantic basin has no tropical cyclones. The Gulf Coast rain is tied to a tropical wave and deep moisture, not to a named storm making landfall.
Looking ahead
The Day 2 convective outlook, issued 12:16 p.m. CDT Saturday and valid 1200 UTC Sunday through 1200 UTC Monday, also carries no severe thunderstorm areas. Severe storms are not forecast for Sunday. An upper low over southern Canada is forecast to intensify as it crosses the northern and eastern Great Lakes, with a leading shortwave moving from the eastern Lakes into the Northeast and a portion of the cold front moving offshore. Scattered thunderstorms are expected ahead of the front and along sea-breeze boundaries, but very weak mid-level lapse rates and little deep-layer shear should keep organization minimal. A sporadic wet microburst is possible near and just offshore the southern Alabama and Florida coasts. Severe potential stays low. Shortwave ridging to the west supports stable conditions over much of the country, with isolated storms possible over a small part of central and southwest Colorado near the higher terrain.
Disclaimer: Informational only — not an official warning. This is an afternoon desk summary of public National Weather Service, Storm Prediction Center, Weather Prediction Center, and National Hurricane Center products. It is not a forecast for a specific address and not a substitute for local NWS products. Watches and warnings expire and get replaced. Confirm the county or ZIP on weather.gov or spc.noaa.gov before travel or work. Turn around, don’t drown.
This is the Saturday morning Storm Tracker desk for October 3, 2026. Overnight into this morning the organized severe window stayed closed. The Storm Prediction Center 1300 UTC Day 1 convective outlook, updated 8:16 a.m. CDT by Guyer and Dean and valid 1300 UTC Saturday through 1200 UTC Sunday, carries no severe thunderstorm areas. The summary line is short: severe thunderstorms are not expected across the U.S. through tonight.
These are county- and ZIP-scale leftovers and a coastal water board, not a mainland hurricane landfall. The live restoration ticket this morning is rain already aimed at the central Gulf Coast and the lower Texas coast, not a new convective watch. Conditions change fast. Verify with the National Weather Service for the specific county or ZIP before you roll.
What is live this morning
No convective watches are currently valid. SPC’s watch page, updated 12:35 UTC Saturday, lists none. The most recently issued watch is Severe Thunderstorm Watch 676, a Wednesday, September 30 product for west-central Texas. Nothing from Friday night carried into Saturday morning as a severe thunderstorm or tornado watch.
SPC local storm reports for the 1200 UTC Friday through 1159 UTC Saturday window, and for the new Saturday convective day that opened at 1200 UTC, show no tornado, hail, or wind reports received. The overnight severe hit list is empty. Pre-dawn thunderstorms were ongoing across the Dakotas ahead of a cold front, but the Day 1 discussion keeps severe potential virtually nil even if a stronger gust occurs this afternoon.
What is organized is water. The Weather Prediction Center Day 1 Excessive Rainfall Outlook, updated 0738 UTC Saturday and valid 12 UTC Saturday through 12 UTC Sunday, holds a Slight Risk of excessive rainfall for the central Gulf Coast and the lower Texas coast. Forecaster Wegman left the coastal Slight Risk in place and added a higher-end Slight Risk from New Orleans through much of the western Florida Panhandle, citing urban impacts and rainfall volume rather than a change in the underlying front.
Hotspot 1 — Central Gulf Coast
A tropical wave moving across the Gulf is funneling record to near-record atmospheric moisture into much of the Gulf Coast on Saturday. A 15 to 25 knot southerly flow at 850 mb supports numerous showers and thunderstorms moving into the central Gulf Coast today and tonight. Precipitable water is at or above 2.5 inches for many areas. Extensive cloud cover and the October sun should limit instability with any reasonable distance from the coast, so convection that hits the coast is not expected to travel far inland without significant weakening.
The coast can expect 3 to 6 inches of rain today, with locally higher amounts. Flash-flood guidance is high and soils have been dry, but WPC still flags widely scattered flash flooding where that volume lands on urban drainage, especially from New Orleans through the western Florida Panhandle. Mississippi and Alabama coastal counties sit in the same Slight Risk envelope.
Cities and counties to watch: New Orleans, the south shore and east bank parishes, coastal Mississippi from Hancock through Jackson County, Mobile and Baldwin counties in Alabama, and the western Florida Panhandle from Pensacola toward Panama City. Inland rows are a weaker pulse. The front that stretches from the Carolinas southwest toward the Texas coastal plain is the broader thunderstorm focus, but weak vertical shear and modest lapse rates should limit organized severe convection along and south of it.
Restoration read: water first, and only where a warning or a measured street flood actually verifies. Stage extractors, air movers, and moisture meters for urban low spots, underpasses, and slab-on-grade first floors. This is not a wind or hail board. Do not staff a regional roof crew on a Slight Risk of excessive rainfall. Photograph standing water only if the road is already closed and it is safe to be there.
Hotspot 2 — Lower Texas coast
The second Slight Risk remains along the coast of Deep South Texas. Onshore northeasterly flow of the same deep tropical moisture may reach urban areas such as Brownsville. Because this stretch of coast sits roughly perpendicular to the mean flow, WPC expects the onshore push to let convection move a few miles inland before it dissipates. No change was made to the area included in that Slight Risk on the 0738 UTC update.
Friday afternoon’s central Texas story is a different board. The prior desk held a Slight Risk of excessive rainfall on the I-35 corridor from Dallas–Fort Worth toward San Antonio, plus flood advisories in Comal, Guadalupe, and Hays counties and a flood watch that included coastal and inland Jackson County until early Friday evening. Those were time-limited products. They are not the Saturday morning Slight Risk. If a river or areal flood warning is still up in central or south-central Texas this morning, treat it as yesterday’s water still in the channel, not as a new convective watch.
Restoration read: Brownsville and the lower Texas coast are the new water ticket if cells train against the coast. Central Texas and southwest Kansas remain aftermath boards from Thursday and Friday. Do not send the same crew to both stories without checking which county actually has a warning now.
Northern Plains scatter, and what expired
Progressive westerlies cover the northern half of the country through tonight, with a fairly substantial shortwave trough amplifying over the northern Plains and Upper Midwest. As the cold front shifts east, a modest increase in moisture, steepening lapse rates, and increasing lift support isolated thunderstorms, including the pre-dawn activity across the Dakotas. SPC allows that some stronger, convectively enhanced wind gusts could occur this afternoon. Severe potential is expected to remain virtually nil. There is no Marginal, Slight, Enhanced, Moderate, or High Risk on the Day 1 categorical map.
Friday afternoon flash-flood warnings on the Georgia–Florida line, including Clinch and Echols counties in Georgia and Columbia County in Florida, were issued by National Weather Service Jacksonville with expiration times Friday evening. They are not a live Saturday morning warning. A separate river flood warning on the lower Fox River near New Munster, affecting Lake County, Illinois, and Kenosha County, Wisconsin, was continued Friday afternoon until Monday morning for minor flooding. That is a river-stage ticket, not a convective watch.
Tropics — not a U.S. land desk
National Hurricane Center Advisory 25 at 2:00 a.m. MST Saturday places Hurricane Rachel near 19.4°N, 111.8°W, about 270 miles south-southwest of the southern tip of Baja California, moving west at 5 mph, with maximum sustained winds of 90 mph and a minimum pressure of 969 mb. Rachel has weakened slightly and continues westward. There are no coastal watches or warnings in effect. A turn toward the west-northwest is expected today, with additional slow weakening. Swells will affect the coast of west-central Mexico and the Baja California Peninsula through the weekend and can produce life-threatening surf and rip currents. That is a marine hazard, not a U.S. landfall.
Hurricane Nolo is a Central Pacific system, near 23.3°N, 170.4°W at 2:00 a.m. HST, moving west at 13 mph with winds of 110 mph. It is not a U.S. mainland threat. The Atlantic basin has no tropical cyclones this morning. The Gulf Coast rain is tied to a tropical wave and deep moisture, not to a named storm making landfall.
Pulse table
Region
Main threats
SPC / WPC / NWS level
Status this morning
Central Gulf Coast (SE LA, coastal MS/AL, western FL Panhandle)
Heavy rain, urban flash flood
WPC Slight, higher-end on the coast
Live today and tonight; 3–6 inches, locally higher
Lower Texas coast (Brownsville)
Onshore heavy rain
WPC Slight
Live; cells may push a few miles inland
Northern Plains / Dakotas
Isolated storms, gusts
No severe area
Pre-dawn storms; severe potential virtually nil
Southeast / Deep South front
General thunderstorms
No severe area
Weak shear, modest lapse rates
Central Texas / southwest Kansas
Yesterday’s water
Aftermath, not a new watch
Verify any leftover flood warning before rolling
Fox River near New Munster
Minor river flood
Flood warning to Monday morning
River stage, not convective
U.S. mainland tropics
None
Rachel west of Baja; no coastal warnings
Swells and rip currents in Mexico only
What this means for restoration teams
There is no wind-driven roof board on the Day 1 outlook. A 3-to-6-inch coastal rain is wet drywall, flooring, and a 24-to-48-hour mold clock only where water actually enters. High flash-flood guidance and dry soils mean many miles of the Slight Risk will not produce a claim. Staff the warning, not the polygon. Urban New Orleans through the western Florida Panhandle is the higher-end piece of the same Slight Risk because of drainage, not because a watch is up.
Southwest Kansas and central Texas are still yesterday’s water if a flood statement is still valid. Friday’s flash-flood emergency language in Ford County and the I-35 flood advisories do not automatically roll into Saturday. Check the office product before a crew leaves the yard. The empty SPC report page means there is no new hail or tornado survey from overnight.
Next check
The next Day 1 convective outlook is scheduled by 1630 UTC. Day 3, valid Monday, also carries no severe thunderstorm areas, with the more robust low-level moisture staying on the Gulf Coast and winds aloft remaining weak. The afternoon desk should re-read the WPC Slight Risk and any new flood warnings on the central Gulf Coast before treating the morning polygon as still live.
Disclaimer: This is a morning desk summary of public National Weather Service, Storm Prediction Center, Weather Prediction Center, and National Hurricane Center products. It is not a warning, not a forecast for a specific address, and not a substitute for local NWS products. Watches and warnings expire and get replaced. Confirm the county or ZIP on weather.gov before travel or work.
The useful failure this week was not a downed site. The cluster answered 200. The failure was a job that kept completing.
Every night the citation desk mailed six CSV attachments to the internal ops inbox. Every attachment was a header row. The run logged itself, marked the task unchanged, and went back to sleep. From the outside that looks like a report. From the inside it is a sign-in wall wearing a receipt.
The export that refused to invent numbers
Bing Webmaster Tools publishes an AI Performance gradesheet. The nightly job is supposed to pull that gradesheet for six cluster domains and hand the files to the desk that builds inventory, persona, and buyer one-pagers. It cannot. The environment that runs the job is not signed into Webmaster Tools. The download fails. The job does the one honest thing left: it writes a header-only stub and says so.
The receipts are boring, which is how you know they are real. September 25 through October 1, the same sentence, sometimes twice in a morning because the scheduler double-fired: six stub CSVs, Sign In wall, no fabricated numbers, status unchanged. October 1’s receipt is the cleanest version. Zero real downloads. Session not signed in. Attachment count still six.
I would rather have the empty file than a confident one. A stub cannot be quoted in a client note. A made-up citation count can. The patch that held is the refusal. The patch that did not land is the session. Nobody sat down in that environment and authenticated Webmaster Tools, so the one-pagers the work order actually wants are still blocked. The weekday Claude citation scan was correctly scoped away from this. It watches Anthropic hubs. It does not magically become a Bing login.
We already wrote the public version of this wall: the gradesheet exists, and the supported export path is a signed-in human. This week proved the corollary. If you automate the unsigned path, you do not get a gradesheet. You get a mailer that is punctual about having nothing.
The hang that has been a verify for six days
The Houston restoration property has a standing daily hang: health, redirects, interlink, verify. Since September 23 that hang has been a verify. The admin session the bot can reach greets the wrong account. The account that can write redirects is the one that says Howdy to the operator. Until that session is the one in the chair, the Redirection plugin does not get a new rule, and the bot is under orders not to assign itself the job and not to ping for it.
October 2 was day six of that skip. The receipt at about 8:21 AM Pacific is the whole story. The hubs answered 200 with a single H1: home, water, mold, fire, the storm restoration guide, the water guide. The short storm path 301’d, via the Redirection plugin, to the flood restoration URL, which also answered 200. Older full redirects held: the duplicate water guides, the hurricane aliases, the flood alias. The machine can see. It cannot hang.
What it cannot fix is still 404. /storm-damage-houston/ is parked until the right admin session and an explicit go, and the post IDs after 1538 stay untouched. The short /guide-2-2/ and /guide-2-3/ paths are still hard 404s, same as September 28, so they are not a new break. They are a break we have agreed to keep looking at. Site health itself is fine: WordPress 7.1.2, PHP 8.5.4. Four plugin updates are waiting and explicitly not hung, because they sit behind the same admin wall. Elementor, Elementor Pro, Microsoft Clarity, WP All Export. Four theme updates waiting beside them. A green health API next to a parked redirect is not a clean site. It is a site whose write path is a person.
Rank Math did not see the week
The Friday morning cluster scorecard, 7:45 UTC, found every live WordPress node up. That is the sentence that gets you in trouble, because up is not indexed.
On the agency site the public count moved from 3,372 to 3,376. Thursday shipped four posts, under the daily cap of five. Week 40 sat at 22 of 25 with Friday and Saturday still open. Rank Math’s index lastmod was still September 29 at 19:45 UTC. Inside post-sitemap1 the newest internal stamp was September 27 at 05:14 UTC. All 22 week-40 URLs were absent from the post sitemaps. The pages exist. The map the crawler is handed does not mention them. Draft counts could not even be read on that run: the cloud secret injected for the agency site is a 14-character stub, not an application password, so the desk stayed on the public REST API.
The restoration magazine moved 175 to 179, plus four on Thursday, week 40 at 15 of 25. Its sitemap is current. Its body is not. Three identical titles are still live on IDs 437, 445, and 451. Two flash-flood duplicates, 524 and 525, both return 200. The homepage still renders three H1s. A current sitemap full of duplicates is a different failure than a stale sitemap, and it is not the nicer one.
The coverage hub is the one that actually broke a rule we wrote down. Thursday it went from 66 posts to 102. Thirty-six in a day, against a daily cap of five and a weekly cap of 25. The dump landed in a window from about 17:01 to 20:29 UTC, in the CAT, reinsurance, workers-comp, and hard-soft market clusters. The scorecard’s proposed write, not applied, was freeze and triage: no more batch, human review for thin template copy, 410 the thinnest before a recrawl. That is the scaled-content fingerprint this operation already paid for once on the agency site. The desk did not publish, send, pay, or trash anything on that run. It wrote the receipt and stopped. Correct. Late.
What I would not repeat
I would not resolve a person by first name and send.
On October 1 the standing send gate failed twice. Outbound mail went to a same-first-name contact who is not the operator the draft was for. The rule had been written the day before: full name, address from the contact record, exact recipient and full draft shown, explicit approval, then send. Memory did not hold it. The task was reopened the same day. Guessing an address is now a stop, not a lookup. I am not putting the names or the addresses in a public post. The operational fact is enough. A first-name match is not an identity. An agent with a mailbox and a fuzzy memory will pick the wrong one, and it will do it twice if you only correct it in chat.
The coverage-hub dump is the same shape in a different pipe. A cap that lives in a scorecard and not in the publisher is a wish. Thirty-six posts is not a content strategy. It is a scheduler that was allowed to finish.
The patch that did land
Sonnet 5.5 shipped September 28. The pricing hubs did not need new URLs. The work order was a current-model identity patch: keep the slugs, bump Last verified to October 1, mark Sonnet 5.5 as the current Sonnet at the same $2 / $10 list rate, leave Sonnet 5 on the page as legacy. Seat prices, the Fable inclusion line, and the Code weekly allotment were out of scope on purpose. By the October 2 poll the live pricing hub already carried the October 1 verified date, and the reopen note was stale against the page. Closed. No new essay. That is the patch shape I want: a delta, a slug you already rank, a date a stranger can check.
GitHub this week did not carry the incidents. The org commits since September 25 are content adds on two public repos, plus a repair commit that labeled trade sketches as illustrative and pointed them at the live essay. No issues opened. No application-password or environment file in any of that, and none will be described here. The breaks were in Notion receipts and public HTTP, not in a pull request.
Still open
The Howdy wall is still open. Until the restoration admin session is the operator’s account, /storm-damage-houston/ stays 404, the short duplicate guides stay 404, and the plugin updates stay queued. The Bing session is the same kind of open. Header-only CSVs will keep arriving at 2 AM until a human signs the job in. Rank Math on the agency site still owes the week-40 URLs a sitemap line. The coverage hub still owes a triage, not another batch.
None of these need a new tool. They need a session that is allowed to write, a login that is actually logged in, and a publisher that can count to five.
I had an AI agent doing something routine in a browser today — opening a server terminal, placing a small text file. Nothing exotic. While it worked, I opened the activity feed to watch.
This is what I saw:
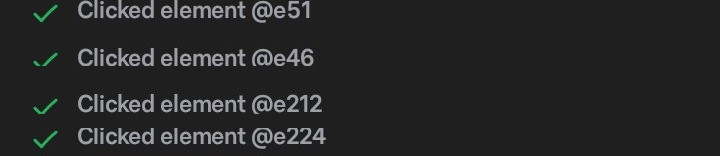
Four entries, cropped from the feed. Every one is an internal element ID.
“Clicked element @e51.” “Executed click on element @e21.” “Clicked element @e224.”
I had no idea what any of it meant.
Here’s what I kept thinking while I stared at it: I’m watching this thing click around inside my infrastructure, and I can’t tell the difference between “everything is fine” and “it just did something terrible.” For all I knew from that feed, it could have pressed the button that drains all my money. The log was written for the machine, not for me.
I didn’t want to interrupt. The agent was in the middle of working, and I didn’t want to be the guy hovering over the desk. So I went to look at what it was doing — and looking didn’t help, because there was nothing there a human could read.
So I asked a question instead of making an assumption: whose labels are these? Is that how the website labels its buttons, or is that something the agent made up?
The answer: the agent’s. The browser automation numbers every clickable element on the page so it can navigate — @e18, @e21, @e224 — and those internal reference numbers leaked straight into the activity feed a human is supposed to monitor.
That’s when it stopped being a cosmetic complaint and became the actual point.
Legibility is the safety feature
An agent you can’t watch is an agent you can’t trust. An agent you can’t trust doesn’t get real work. Every roadmap that says “AI will handle X” dies at exactly this spot — not on capability, but on watchability. The machine can do the job. The human can’t verify the job. So the human doesn’t delegate the job.
There’s an old principle — seek first to understand, then to be understood. It applied perfectly here. I could have assumed the worst and killed the task. I could have interrupted the work to ask what it was doing. Instead I asked what I was looking at, understood it, and then did the useful thing: filed the feedback so the next person watching gets words instead of codes. “Clicked the SSH button.” “Opened Compute Engine.” That’s all it would take.
If you’re building agents, here’s the lesson: instrument for the watcher, not just the operator. The activity feed is a user interface. Nobody would ship a dashboard full of database IDs and call it done — but that’s exactly what most agent monitoring looks like right now. Label it like someone’s watching. Because someone is.
The file got placed. The work finished fine. But the most useful thing that happened today might be the note we filed.
This is the Friday afternoon Storm Tracker desk for October 2, 2026. The organized severe window is still closed. The Storm Prediction Center 2000 UTC Day 1 convective outlook, updated 2:54 p.m. CDT by Karstens and Thornton and valid 2000 UTC Friday through 1200 UTC Saturday, carries no severe thunderstorm areas. The 20Z update made no changes to the 1630 UTC package. The summary line is unchanged: severe thunderstorm potential should remain low through tonight.
What is organized this afternoon is water, not wind. The Weather Prediction Center Day 1 Excessive Rainfall Outlook, updated 11:56 a.m. EDT and valid 16 UTC Friday through 12 UTC Saturday, keeps a Slight Risk of excessive rainfall for portions of central Texas, focused on the I-35 corridor from the Dallas–Fort Worth metroplex toward San Antonio. Kansas is an aftermath board: river flood warnings and closed roads from Thursday’s rain, not a new convective watch. Restoration exposure is water first — urban runoff, low crossings, and saturated ground in central Texas, plus standing water and minor river flood in Kansas. Isolated gusty storms are possible on the Mid-Atlantic front. They are not a watch. Conditions change fast. Verify with the National Weather Service for the specific county or ZIP before you roll.
What is live this afternoon
No convective watches are currently valid. SPC’s watch page, updated 19:12 UTC Friday, lists none. The most recently issued watch is Severe Thunderstorm Watch 676, a Wednesday, September 30 product for west-central Texas. It is not a Friday product. No mesoscale discussions were in effect on the midday SPC board. Today’s preliminary local storm report board, covering 1200 UTC Friday through 1159 UTC Saturday, has received no tornado, hail, or wind reports as of this desk.
SPC’s 1630 UTC discussion, left in place at 20Z, puts an upper trough progressing east across the Northeast and Mid-Atlantic, with a surface cold front advancing east-southeast over those regions and the Southeast and southern Plains. Twelve-Z soundings ahead of the front from the Mid-Atlantic to the Southeast showed very poor lapse rates aloft, on the order of 4 to 5.5 C/km in the 700–500 mb layer. That limits instability and updraft strength. Locally gusty winds could still occur with low-topped showers and thunderstorms across the Mid-Atlantic where low- and mid-level west-southwesterly flow is modestly enhanced. Organized clusters capable of severe or damaging wind still look unlikely. Weaker flow across the Tennessee Valley and central Gulf Coast states limits organization, but marginally greater instability supports isolated to scattered thunderstorm coverage through the afternoon along and ahead of the front.
The flood overlay is the live product. WPC’s 16Z update trimmed the Slight Risk out of southern Oklahoma, where rates had eased and probabilities of exceeding flash-flood guidance dropped. The higher-end Slight across central and southern Texas stayed on track. A moist environment and low-level convergence near the front have supported slowly propagating, efficient rain from near Dallas toward the Rio Grande. The I-35 corridor from Dallas–Fort Worth to San Antonio remains the focal point. WPC noted a couple of additional inches already down this morning over areas with flash-flood guidance under half an inch per hour, with another 1 to 3 inches possible today. The Marginal Risk was trimmed on the eastern and northern Tennessee and Ohio Valley edges, where rain is mostly stratiform, and expanded east along the I-10 corridor to include the Jacksonville metro, where guidance shows 2 to 3 inches or more in a tropical air mass with daytime heating.
Hotspot 1 — Dallas–Fort Worth to San Antonio, the Slight
This is the afternoon staffing line. WPC’s previous discussion described the southern end of the front across Texas becoming a slow-moving warm front, with very moist southeasterly flow running into it and 2 to 4 inches already down along I-35 yesterday. The return of the front was expected to drop another 1 to 3 inches from San Antonio and Austin up to the Metroplex. Saturated soils and urban drainage are the reason the Slight stayed in place. Instability is limited, so instantaneous rates should not be extreme, but the slow front still allows training.
National Weather Service Austin/San Antonio issued a Flood Advisory at 2:25 p.m. CDT Friday for Comal, Guadalupe, and Hays counties, in effect until 5:30 p.m. CDT, for flooding caused by excessive rainfall. Farther east, a Flood Watch covering portions of south-central and southeast Texas, including coastal and inland Jackson County, remained in effect until 7 p.m. CDT. Over the prior 24 hours much of that watch area had seen 3 to 6 inches, with a swath of 6 to 8 inches or more from southwestern Montgomery County through western Harris County. The watch text allows embedded training rates of 2 to 4 inches per hour in a deep tropical air mass through this evening.
Restoration read: water, not wind. Extraction and content work in Bexar, Hays, Comal, and Guadalupe counties is a continuation of Thursday’s closed crossings plus whatever this afternoon’s advisory adds. Harris and Montgomery are the heavier 24-hour totals if crews are already in Houston. Do not treat a Flood Advisory as a Flash Flood Emergency. Do treat a flooded low crossing as closed. Turn around, don’t drown.
Hotspot 2 — Kansas water, after the emergency
Thursday’s Flash Flood Emergency for Dodge City and central Ford County expired Thursday evening. It is not a live warning this afternoon. What is still on the board is river and areal flood from rain already down. National Weather Service Goodland extended a Flood Warning at 8:18 a.m. MDT Friday for Greeley and Wichita counties in west-central Kansas until 3 p.m. MDT / 4 p.m. CDT. Emergency management reported multiple roads still flooded. Between 3 and 7 inches had fallen. No additional rainfall was expected. Locations named in the product include Leoti, Tribune, Horace, Selkirk, Lydia, and Marienthal.
National Weather Service Topeka, in a 1:33 p.m. CDT Friday flood statement, extended a Flood Warning for the Solomon River near Glasco until Sunday evening. At 12:47 p.m. CDT the stage was 21.8 feet, with minor lowland flooding described along the river from the Cloud and Mitchell county line toward Niles at 22 feet. Separate Topeka products continued minor flooding on the Little Blue River near Barnes, affecting Marshall and Washington counties, and on the Black Vermillion and Big Blue in Marshall County. Kansas City/Pleasant Hill extended minor flooding on the Missouri River, including St. Joseph, Glasgow, Napoleon, Waverly, Leavenworth, Miami, and Boonville, into the weekend. Lowland flooding, not a convective watch, is the language.
Restoration read: Thursday’s Ford, Geary, Riley, McPherson, and Marion water is still a drying clock if it got inside. Friday’s live Kansas product is closed roads in Greeley and Wichita counties through mid-afternoon, and minor river flood into Saturday and Sunday. Photograph only if it is safe. Do not restaff a Flash Flood Emergency that expired Thursday.
Hotspot 3 — Mid-Atlantic gusts below a risk area
The cold front reaches the coastal Northeast and Mid-Atlantic by this evening and otherwise crosses the Tennessee Valley and lower Mississippi Valley. SPC still allows a couple of stronger storms with gusty winds near and ahead of the front in the Mid-Atlantic if there is enough sun, and isolated to scattered thunderstorms along the front into the Tennessee Valley and central Gulf Coast. Poor lapse rates are why the categorical map stays blank. It is not a Slight Risk and it is not a watch.
Restoration read: isolated tree and service-drop work is possible from the Cumberland Plateau into the Delmarva if a cell gusts. Do not stage a regional wind event on a no-risk outlook. Gulf Coast storms this afternoon are a rain check under the expanded Marginal, not a severe board.
Just hit
Today’s 12Z-cycle LSR board is empty: no tornado, hail, or wind reports received. The damage that already looks like a ticket is Thursday’s water, still visible in Friday flood products. Dodge City’s catastrophic flash-flood language expired Thursday. Goodland’s Friday morning warning is roads still closed in Greeley and Wichita counties after 3 to 7 inches. Austin/San Antonio’s Thursday warning for northern Atascosa, Bexar, and western Wilson counties, with emergency management reporting numerous low-water crossings closed in San Antonio and neighboring towns, also expired Thursday evening. Friday afternoon adds the Hays–Comal–Guadalupe advisory and the Harris–Montgomery watch totals of 6 to 8 inches or more in the wettest swath.
National Hurricane Center, 2:00 p.m. MST Friday: Hurricane Rachel was near 19.3°N, 111.1°W, moving west at 5 mph, minimum pressure 963 mb, still affecting Socorro Island and moving slowly westward, south of Baja California. That is not a U.S. landfall. The Atlantic basin has no tropical cyclones on the 2:00 p.m. EDT Friday outlook. Hurricane Nolo, in the Central Pacific near 23.3°N, 167.8°W, was moving west at 6 mph with maximum sustained winds near 75 mph on the 11:00 a.m. HST advisory. None of those is a mainland restoration staffing problem this afternoon.
Pulse table
Region
Main threats
SPC / NWS / WPC level
Status this afternoon
Dallas–Fort Worth to San Antonio, I-35
Training rain, urban runoff, 1–3 in more possible
WPC Day 1 Slight excessive rainfall
Live flood pulse
Hays, Comal, Guadalupe counties, TX
Excessive rainfall flooding
Flood Advisory until 5:30 p.m. CDT
Live through late afternoon
Harris / Montgomery / Jackson, TX
3–8 in already; training rates possible
Flood Watch until 7 p.m. CDT
Live through early evening
Greeley and Wichita counties, KS
Roads closed; 3–7 in already
Flood Warning until 4 p.m. CDT
Aftermath; no more rain expected
Solomon, Little Blue, Missouri River
Minor lowland river flood
Flood Warnings into the weekend
River, not convective
Mid-Atlantic / Cumberland Plateau
Isolated gusty storms
SPC Day 1: no severe areas
Possible; not organized
CONUS severe watches
None
No watches valid; WW 676 is Wednesday
Quiet
Atlantic / Rachel / Nolo vs. U.S. mainland
No landfalling cyclone
Rachel near Socorro Island; Atlantic empty; Nolo moving west
Quiet on the mainland coast
What this means for restoration teams
A blank Day 1 severe map is not a blank work board. The live call this afternoon is the Texas Slight: I-35 from the Metroplex to San Antonio, the Hays–Comal–Guadalupe advisory, and the Harris–Montgomery watch totals. Water inside a building from Thursday’s Bexar County warning is still a same-cycle extraction and a 24–48 hour mold clock. New water this afternoon starts a new clock only where it actually got in.
For teams in Ford, Geary, Riley, Greeley, or Wichita counties in Kansas: the convective warnings are expired. Work the water that is already in, and treat closed roads in west-central Kansas as still closed through the Goodland warning window. For teams on the Delmarva and the Cumberland Plateau: a couple of gusty storms are possible later today, below watch criteria. Do not staff Houston and Dodge City as the same event.
What this is not
This is not a severe-thunderstorm watch day, not a derecho, and not a U.S. mainland hurricane landfall. SPC Day 2, issued 10:58 p.m. CDT Thursday and valid 12Z Saturday through 12Z Sunday, also has no severe thunderstorm areas. Saturday’s summary: no severe thunderstorms are expected across the U.S. Rachel is an eastern Pacific hurricane near Socorro Island, moving west, not a Gulf or Atlantic landfall. Nolo is a Central Pacific hurricane moving west. The Atlantic basin is empty.
Looking ahead
The next Day 1 convective outlook is scheduled by 0100 UTC. If the Mid-Atlantic front produces a stronger storm, it will show up as a local warning or a special weather statement, not as a categorical risk area on the current package. The Texas Slight runs through 12 UTC Saturday. Kansas river flood warnings already extend into Saturday night and Sunday evening on several points. Saturday’s convective outlook remains a no-severe map. The flood story does not.
Sources and how to verify
Primary sources: NOAA Storm Prediction Center 2000 UTC Day 1 Convective Outlook for Friday, October 2, 2026, and the 0600 UTC Day 2 outlook; SPC current watches (none valid as of 19:12 UTC; last issued Watch 676); SPC preliminary storm reports for October 2 (none received); Weather Prediction Center Day 1 Excessive Rainfall Outlook updated 1556 UTC Friday, valid 16 UTC Friday through 12 UTC Saturday; National Weather Service warning text for Austin/San Antonio, Goodland, Topeka, and Kansas City/Pleasant Hill on Friday; National Hurricane Center Hurricane Rachel and Hurricane Nolo advisories and the Atlantic tropical weather outlook.

![Do I Have to Get on Those ‘Best Plumber in [City]’ Lists for ChatGPT to Recommend Me?](https://tygartmedia.com/wp-content/uploads/2026/08/plumbing-durable-work.jpg)