Every restoration owner over fifty has the same question stuck in the back of their head: what is this thing actually worth? The honest answer in 2026 is somewhere between 2.3x SDE and 7x EBITDA — and the spread between those two numbers is not luck. It is the difference between a company a buyer wants and a company a buyer tolerates.
Here is what is happening in the market right now, what private equity is paying, and what kills the deal at the eleventh hour.
The 2026 Multiple Spread
Restoration M&A in 2026 sorts cleanly into three tiers. The cutoffs matter — they are not aesthetic.
Tier 1 — Sub-$2M revenue shops. Owner-operator businesses with one or two trucks, dependent on the founder for sales and crew leadership. These transact on Seller’s Discretionary Earnings (SDE), not EBITDA. Typical multiples: 2.3x to 3.0x SDE. The buyer is usually another restoration owner, a search-fund operator, or an industry veteran on their second act. There is no PE in this tier. The owner doing the work IS the asset, and that is exactly the problem.
Tier 2 — $2M to $5M revenue shops. The PE feeder zone. These get bought by platforms like BluSky, First Onsite, Belfor, ATI, and Code Red as bolt-on acquisitions. Multiples: 3.0x to 3.5x SDE, or 4x to 5x EBITDA if the company is clean enough to have real EBITDA at all. Purchase prices land between $900K and $2.5M. This is the sweet spot for industry roll-ups — large enough to have a real second-in-command, small enough to absorb without indigestion.
Tier 3 — $10M+ revenue, $2M+ EBITDA platforms. Now you are talking to PE directly, not through a strategic. Multiples: 5x to 7x EBITDA, occasionally higher for the right footprint. BluSky has announced 13 acquisitions in the last six years under Kohlberg & Company and Partners Group ownership. American Restoration rolled up 8 brands before exiting to Morgan Stanley. HighGround did 13 deals in five years before selling to Knox Lane. The playbook is well-documented. PE has put more than $6 billion into the space since 2018.
What Buyers Actually Pay For
Buyers pay for transferability — not heroic owners.
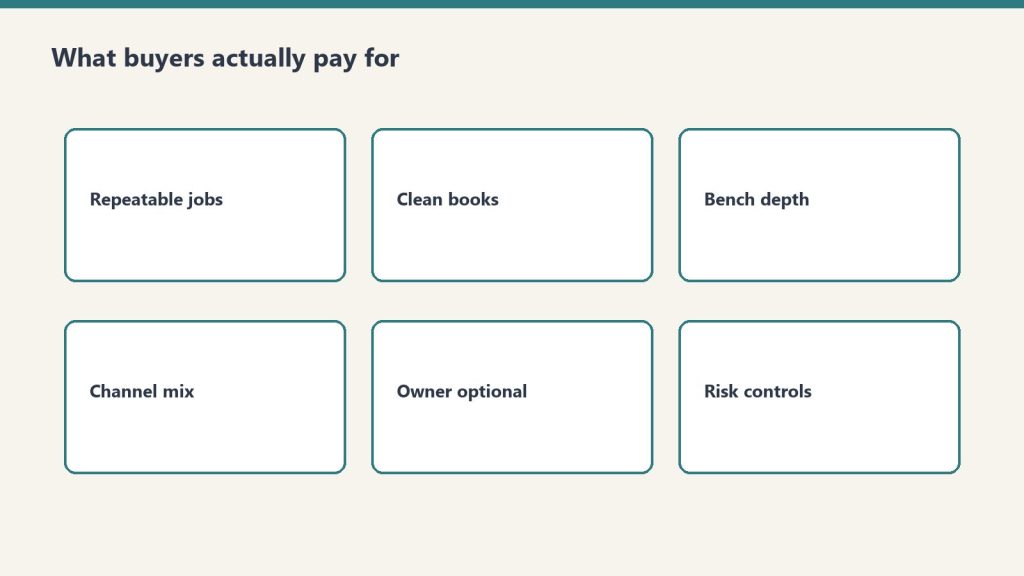
The multiple is a function of risk, not affection. Sophisticated buyers pay up for five things, in roughly this order:
1. Insurance carrier preferred-vendor status. If you are on the panel for State Farm, Allstate, USAA, Liberty Mutual, or any TPA program — Contractor Connection, Alacrity, Code Blue — that contract is the asset. It is also the hardest thing to replicate. Buyers will pay a premium for it because they cannot buy it any other way except by buying you.
2. Mitigation-heavy revenue mix. Water mitigation runs gross margins around 70-80%. Reconstruction often runs 10% or less. A company that is 65% mitigation and 35% reconstruction is worth materially more than the same revenue split inverted. Buyers will pull your job-cost reports line by line during diligence to confirm the mix is real and not just how you are categorizing.
3. Management depth below the founder. If you can take a two-week vacation and revenue does not blink, your multiple goes up by half a turn. If the phones stop ringing the moment you leave, you are selling a job, not a business. Hire a real general manager 18 months before you list.
4. CAT exposure under 20%. Catastrophic event revenue is lumpy and cannot be modeled. If 40% of your last three years came from one hurricane season, buyers will discount that revenue heavily — sometimes valuing CAT-driven dollars at half the multiple of recurring carrier work. Diversify your revenue base before going to market.
5. Clean books with a Quality of Earnings opinion. Every PE-backed deal includes a QoE — an outside accounting firm that re-audits your trailing twelve months and normalizes EBITDA. If your books are run on a personal-finance app and your CPA does taxes once a year, expect the QoE to find $200K-$500K of EBITDA adjustments that go against you. Spend $40K on a CFO-for-hire and a real GAAP P&L two years before sale.
What Kills the Deal
What kills the deal is usually quiet and operational.
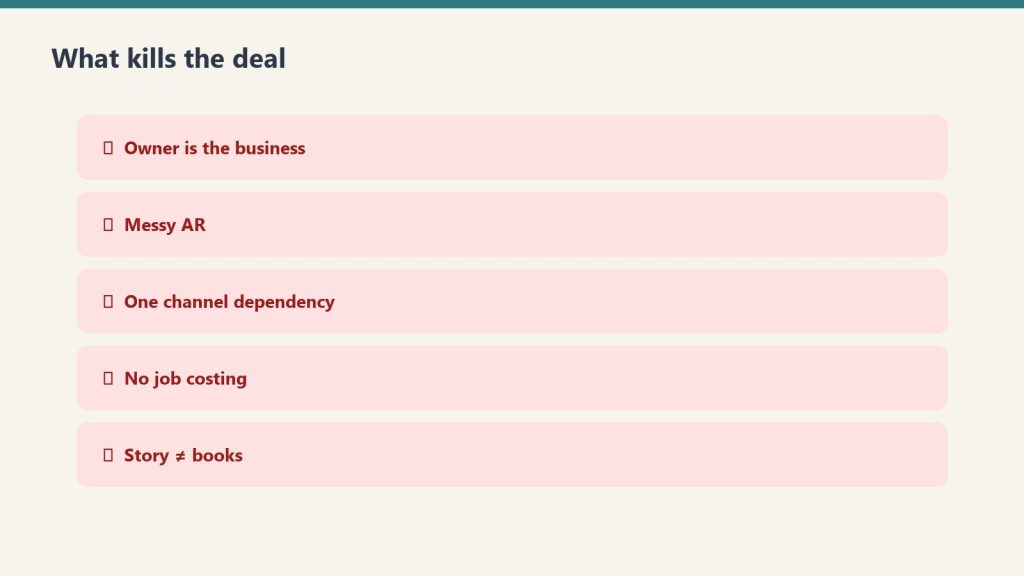
Roughly 30-40% of restoration LOIs do not close. Almost always for reasons the seller could have prevented.
The biggest deal-killer is customer concentration. If one TPA program represents more than 35% of revenue, buyers panic. They have seen what happens when Contractor Connection decides to rebid a region — entire $8M revenue lines disappear in a quarter. Diversify before you list.
The second is uncollected aged receivables. Restoration AR over 90 days is not an asset, it is a write-down waiting to happen. Buyers will deduct uncollected AR from purchase price dollar-for-dollar. Aggressively collect or write off everything before you go to market.
The third is licensing and certification gaps. IICRC, state contractor licenses, mold remediation certifications by state — buyers run a full compliance audit. A single expired contractor license in a key state can cost $50K-$150K at close.
The fourth is founder dependency on first-call relationships. If the property manager calls you personally when there is a flood — not a dispatch number, not a sales rep — buyers will require an earnout structure that makes you stay another three to five years. Most owners hate earnouts because they convert sale price into deferred contingent comp. Build the dispatch infrastructure before you list, and you keep the cash up front.
The Honest Bottom Line
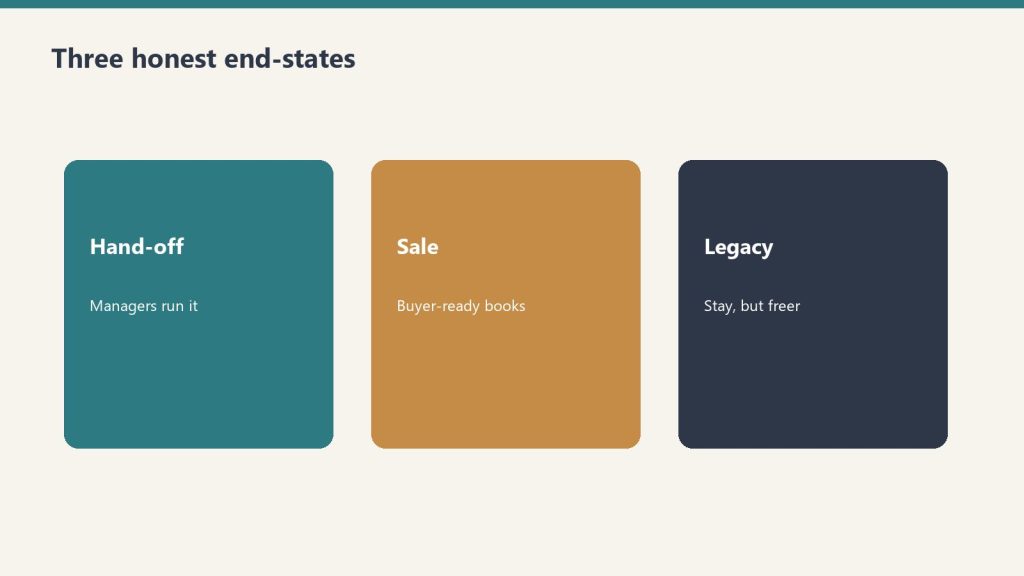
Honest bottom line: pick an end-state and work backward.
If you are a $3M revenue restoration company today and you want a clean exit at a real multiple, you have an 18-to-24 month preparation window. Use it to get the books on accrual, hire a GM, diversify off any single TPA, build mitigation revenue past 60% of mix, and get every certification current.
Do that, and a $3M shop running 18% EBITDA margins ($540K) sells at 4.5x to a strategic — about $2.4M cash at close. Skip it, and the same company sells at 2.6x SDE — closer to $1.4M, often with a punishing earnout attached.
The difference is one million dollars. The work to capture it is roughly nine months of operator focus. That is the highest-ROI work an exiting restoration owner can do.
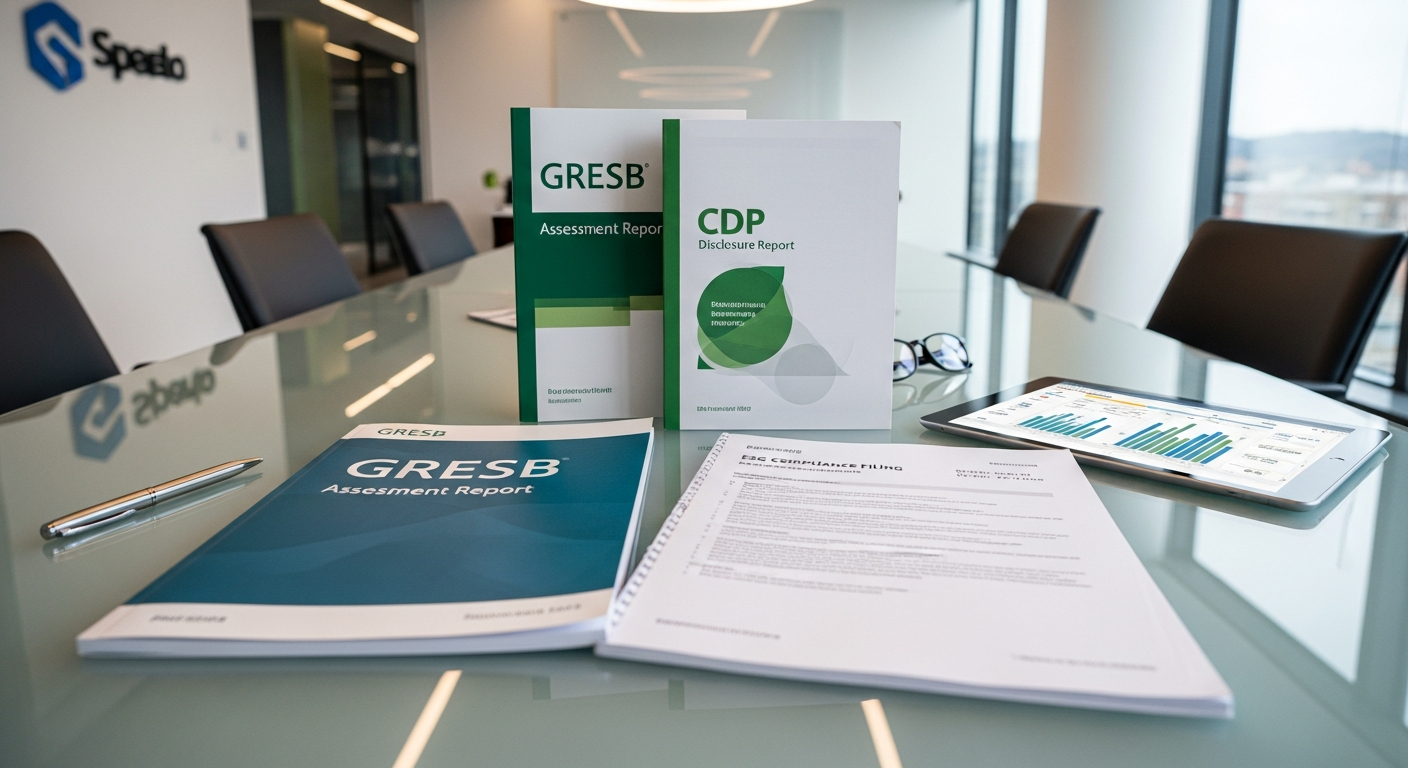
Property owners and asset managers in institutional real estate operate in an increasingly layered ESG disclosure environment. GRESB drives investor-facing ESG scoring. CDP provides voluntary supply chain disclosure that is increasingly investor-requested. California SB 253 mandates Scope 3 disclosure for large entities. And the EU’s Corporate Sustainability Reporting Directive (CSRD) extends mandatory ESG reporting to European operations and, through supply chain due diligence requirements, reaches global real estate companies with EU exposure.
For BOMA members — building owners, REITs, asset managers — understanding which framework governs which obligations, and where they overlap, is essential for building an ESG program that satisfies all of them without duplicating work. This article maps each framework against the specific Scope 3 obligations it creates for property owners, with particular focus on the contractor supply chain data gap that sits at the intersection of all three.
GRESB: Investor-Driven, Asset-Level, Annual
GRESB — investor-driven, asset-level, annual.
GRESB is the primary ESG accountability mechanism for institutional real estate globally. It is not a regulation — it is an investor-driven benchmark that most institutional property owners participate in voluntarily because their capital partners require it. GRESB assessments are annual, asset-level, and scored on a 0–100 scale that investors use to compare portfolio ESG performance.
For Scope 3, GRESB evaluates both governance (do you have a Scope 3 target and supply chain policy?) and performance (do you have actual Scope 3 data?). Contractor emissions — Scope 3 Category 1 — factor into both components. Property owners without contractor data collection programs score lower on supply chain governance and leave Category 1 data fields blank in the Performance section.
GRESB is the most immediate Scope 3 pressure for most BOMA members because it directly affects your capital relationships. A poor GRESB score can affect asset valuations, borrowing costs, and investor mandates in ways that regulatory compliance does not.
CDP: Voluntary, Supply Chain Driven, Escalating
CDP’s supply chain program allows large corporations — including real estate companies’ major tenants and capital partners — to request Scope 3 supply chain data from their vendors. For property owners, CDP requests typically arrive from two directions: from institutional tenants whose corporate ESG programs require supply chain data from their landlords, and from institutional investors whose own CDP commitments require portfolio-level Scope 3 supply chain data.
CDP participation is voluntary, but declining a CDP request from a major tenant or capital partner has commercial consequences. As CDP participation expands — the program now covers thousands of companies — the probability that a significant counterparty will request Scope 3 data from your organization continues to increase.
California SB 253: Mandatory, Regulated, Enforced
SB 253 is the only mandatory framework in this set, at least for US-domiciled organizations. It applies to entities doing business in California with revenues above the threshold, requires Scope 1 and 2 disclosure starting with fiscal year 2025 data, and adds Scope 3 starting with fiscal year 2026 data. CARB administers the program and has authority to assess penalties for non-compliance and material misstatement.
For real estate entities with California assets, SB 253 transforms the Scope 3 contractor data question from an investor relations consideration into a legal compliance obligation. The same contractor emissions data that improves your GRESB score and satisfies CDP supply chain requests now also needs to be accurate enough to withstand CARB review.
Where Restoration Contractor Data Fits in Each Framework
The Restoration Carbon Protocol addresses the same data gap across all three frameworks. An RCP-compliant restoration contractor provides project-level emissions data in a format aligned with GHG Protocol Category 1. That data feeds directly into your GRESB Performance section, satisfies CDP supply chain data requests for Category 1, and provides the documented, methodology-backed Scope 3 Category 1 data that SB 253 requires.
The strategic efficiency argument for RCP adoption by property owners is that solving the restoration contractor data problem once solves it for all three frameworks simultaneously. You do not need different data for GRESB, CDP, and SB 253 — you need GHG Protocol Category 1 data, and RCP produces it in that format.
Building a Unified Response
For BOMA members navigating GRESB, CDP, and SB 253 simultaneously, the most efficient path is a unified Scope 3 data program rather than three separate compliance efforts. The foundation is a GHG Protocol-aligned inventory methodology that covers all fifteen Scope 3 categories. Contractor data — collected through RCP-compliant vendor agreements and green lease extensions — feeds into that inventory once and satisfies all three frameworks.
The timeline pressure is real: SB 253 Scope 3 data collection for fiscal year 2026 should already be underway, GRESB 2026 assessments will open in the first quarter, and CDP supply chain requests arrive year-round. The property owners who have built the contractor data infrastructure now — preferred vendor panels with RCP adoption, ESG clauses in service agreements, documented methodology — will be the ones with defensible Scope 3 inventories when all three frameworks converge on the same data set in 2027.
Both require Scope 3 GHG data aligned with the GHG Protocol Corporate Standard. GRESB collects it through an annual assessment submitted to the benchmark platform. SB 253 requires public disclosure filed with CARB. The underlying data set is the same — a GHG Protocol-compliant Scope 3 inventory by category — which is why building one unified inventory program satisfies both frameworks efficiently.
How does CSRD affect US-based property owners?
The EU’s Corporate Sustainability Reporting Directive (CSRD) applies directly to large EU-domiciled companies and EU subsidiaries of non-EU companies above defined thresholds. For US-based real estate companies with EU operations or EU-listed capital partners, CSRD may apply directly. Even for those it does not reach directly, CSRD’s supply chain due diligence requirements mean EU-based capital partners and tenants will increasingly request Scope 3 supply chain data from their US counterparties as part of their own CSRD compliance.
What is the Restoration Carbon Protocol and why do BOMA members need it?
The Restoration Carbon Protocol (RCP) is an industry self-standard that gives restoration contractors a structured GHG accounting methodology for project-level emissions reporting. For BOMA members, RCP-compliant contractors provide the Scope 3 Category 1 data needed for GRESB performance scores, CDP supply chain responses, and SB 253 mandatory disclosure — in a format directly compatible with GHG Protocol reporting requirements.
Green leases have been a standard tool in the institutional real estate ESG toolkit for over a decade. Originally designed to align landlord and tenant incentives around energy efficiency, green lease clauses have evolved to cover data sharing, sustainability reporting, and — in more sophisticated agreements — explicit GHG emissions obligations.
The same contractual logic that makes green leases effective for tenant emissions management can be applied to the contractor supply chain. Property owners who have invested in green lease programs for tenant Scope 3 (Category 13) data now have a parallel opportunity: using vendor agreement language to systematically collect Scope 3 Category 1 data from the contractors who perform work on their assets.
What Green Lease Language Has Achieved — and Where It Stops
Modern green lease frameworks — developed by BOMA, the Institute for Market Transformation, the Urban Land Institute, and others — have established standard clauses for energy data sharing, sub-metering requirements, sustainable operations standards, and ENERGY STAR reporting. These clauses give property owners a contractual mechanism to collect the tenant data needed for GRESB Category 13 reporting and corporate GHG inventories.
Green leases stop at the tenant boundary. They do not govern the contractors the property owner engages for capital projects, maintenance, and emergency response. Those contractor relationships are covered by master service agreements, purchase orders, and emergency vendor panel arrangements — none of which have traditionally included GHG data reporting requirements.
Extending the Logic: Contractor ESG Clauses
The Green Lease 2.0 framework extends the proven lease-language approach to contractor agreements. The principle is identical: establish a contractual data delivery obligation, specify the format and methodology, and make compliance a condition of the vendor relationship.
For restoration contractors specifically, the relevant clause structure covers three elements. A methodology requirement — specifying that the contractor must use a recognized GHG accounting methodology (such as the Restoration Carbon Protocol) for calculating project emissions. A data delivery requirement — specifying that a project emissions report in a format compatible with GHG Protocol Category 1 reporting must be delivered within 30 days of project completion. And a pre-qualification requirement — specifying that participation in the property owner’s preferred restoration vendor panel requires demonstrated GHG reporting capability prior to emergency deployment.
Why the Pre-Qualification Step Matters
The most important element of the contractor ESG clause framework is pre-qualification — establishing GHG reporting capability before the loss event occurs. Property owners cannot negotiate data requirements at 2 AM when a pipe bursts. The contractual infrastructure needs to exist before the emergency.
Pre-qualification creates a preferred vendor panel of restoration contractors who have adopted RCP or an equivalent methodology and are contractually committed to delivering project emissions data. When a loss event occurs, the property manager calls from that panel — and GHG data collection is already built into the engagement.
What This Looks Like for GRESB and SB 253
For GRESB participants, a documented contractor ESG clause program with demonstrated adoption across your preferred vendor panel satisfies the supply chain governance requirements in the Management component of the GRESB assessment. It shows that your organization has policies in place, that those policies have contractual teeth, and that you are actively collecting contractor emissions data — not estimating it.
For SB 253, the contractor ESG clause approach provides the documented data collection methodology that CARB’s guidance suggests as the evidentiary standard for Scope 3 Category 1 reporting. Organizations that can demonstrate a systematic contractor data collection program — rather than spend-based estimation — are better positioned for both initial compliance and the audit scrutiny that mandatory disclosure programs inevitably generate over time.
Green Lease 2.0 is not a dramatic reinvention. It is the application of a framework that already works — for tenants — to the contractor relationships where property owners have an equivalent data obligation and an equivalent contractual lever to close it.
Property owners managing large commercial real estate portfolios have made significant progress on Scope 1 and Scope 2 emissions. Energy management systems, green building certifications, and utility procurement strategies have given asset managers real tools for reducing and reporting direct and indirect energy emissions. Scope 3 Category 1 — the contractor supply chain — has been the persistent blind spot.
The Restoration Carbon Protocol (RCP) is designed to close the most acute piece of that gap: the emissions generated by restoration contractors during loss events and emergency response projects. This article explains what the RCP covers, how it generates the data property owners need, and how to integrate it into your ESG program and vendor management processes.
Why Restoration Contractors Are a Unique Scope 3 Challenge
Why restoration contractors are a unique Scope 3 challenge.
Most contractor Scope 3 challenges can be addressed through procurement policy — adding ESG reporting requirements to RFPs, master service agreements, and annual vendor reviews. This works for planned, recurring vendor relationships where you control the selection process and the contract terms.
Restoration contractors operate differently. They are engaged reactively, after a loss event. The property manager calls whoever is on the emergency vendor panel. The contractor mobilizes immediately. There is no competitive procurement, no ESG pre-qualification review, and no time to negotiate reporting requirements before work begins. The emissions happen regardless of whether data is collected.
This is why the RCP matters: it establishes the data collection methodology on the contractor’s side, before the loss event. A contractor who has adopted the RCP arrives at your property already equipped to generate the emissions data you need — no negotiation required at the time of loss.
What the RCP Measures
The Restoration Carbon Protocol covers four primary emissions categories for a typical restoration project. Equipment fuel consumption — diesel generators, drying equipment, dehumidifiers, extraction units, and vehicles — is measured against hours of operation and fuel consumption logs. Materials with embedded carbon — replacement drywall, flooring, insulation, and structural components — are estimated using industry-standard embodied carbon factors. Waste generation — demolition debris, contaminated materials, and packaging — is tracked by weight and disposal method. Transportation — contractor vehicle miles, equipment hauling, and materials delivery — is calculated using distance and load data.
The RCP output is a project-level emissions report expressed in metric tons of CO2 equivalent, broken down by category. That format maps directly to GHG Protocol Scope 3 Category 1 reporting requirements — making it usable for GRESB data submissions, CDP supply chain responses, and SB 253 Scope 3 inventory filings.
How to Ask Your Vendors About RCP
For property owners building RCP adoption into their vendor management process, the conversation with restoration contractors has three components. First, ask whether the contractor has adopted the RCP or an equivalent GHG reporting methodology — this establishes whether data collection infrastructure exists. Second, ask what the output format looks like and whether it maps to GHG Protocol Category 1 — this determines whether the data is actually usable for your reporting obligations. Third, ask about the delivery timeline — GRESB, CDP, and SB 253 all require annual inventory data, and you need project-level data within the fiscal year it occurred.
Contractors who have not adopted RCP but are aware of it may be willing to do so if a significant client requests it. The RCP is an industry self-standard, not a certification program with fees or audits — the barrier to adoption is methodology, not cost.
Integrating RCP Data into Your ESG Program
Integrating RCP data into your ESG program.
Once you have RCP-compliant contractors on your preferred vendor panel, the data integration is straightforward. Each completed project generates an emissions report. Those reports are aggregated annually by property and portfolio. The totals feed into your Scope 3 Category 1 inventory alongside data from other contractor categories. The result is a documented, methodology-backed contractor emissions number — not a spend-based estimate — that satisfies the evidentiary standard for GRESB, CDP, and SB 253 reporting.
For BOMA members managing portfolios under institutional ESG frameworks, this is the difference between a defensible Scope 3 inventory and a gap that investors, auditors, and regulators will flag. The RCP does not solve the entire contractor Scope 3 problem — but it solves the most unpredictable piece of it, and it does so in a format property owners can actually use.
California’s Climate Corporate Data Accountability Act (SB 253) has been widely discussed in the context of large manufacturers and technology companies. Less discussed — but equally significant — is the exposure it creates for real estate entities. Property owners, REITs, and asset managers with California operations and revenues above the threshold face mandatory Scope 3 disclosure beginning with fiscal year 2026 data, due in 2027.
For BOMA members managing California commercial real estate, SB 253 changes the contractor relationship in a material way. The restoration contractor who responds to a water loss event at your San Francisco office tower, your Los Angeles industrial park, or your San Diego mixed-use development is generating Scope 3 Category 1 emissions that will need to appear in a mandatory public disclosure. And that contractor almost certainly has no mechanism for providing you that data today.
Who SB 253 Applies To
Who SB 253 applies to.
SB 253 applies to entities doing business in California with total annual revenues exceeding $1 billion. The law is administered by the California Air Resources Board (CARB). For Scope 3, the first reporting year is fiscal year 2026 — meaning data collection for Scope 3 needs to begin now for organizations that have not already started.
Many institutional real estate owners — national REITs, pension fund asset managers, sovereign wealth fund-backed property companies — clear the revenue threshold and have California assets. For these entities, SB 253 Scope 3 reporting is not a future consideration. It is an active compliance requirement with a defined first filing date.
The Reactive Vendor Problem for Real Estate
SB 253’s Scope 3 requirement covers all fifteen GHG Protocol categories. For property owners, Category 1 (Purchased Goods and Services) includes every contractor engaged during the reporting year — planned maintenance vendors, capital project contractors, and reactive emergency-response vendors like restoration companies.
The planned vendor relationship is manageable. You can add ESG data reporting to your master service agreements with recurring maintenance contractors, HVAC firms, and janitorial services. You can build it into your RFP process and annual vendor reviews.
Reactive vendors are the structural problem. You do not choose when a pipe bursts or when a fire damages a tenant floor. You do not run a competitive procurement when a Category 1 water loss event hits your building at 2 AM. The restoration contractor who shows up is whoever your property manager calls — and the emissions from their equipment, materials, and transportation are your Scope 3 Category 1 obligation regardless of whether they provide data or not.
The Restoration Carbon Protocol as a Compliance Bridge
The Restoration Carbon Protocol (RCP) was developed specifically to address the reactive vendor data gap. It provides restoration contractors with a standardized methodology for calculating project-level GHG emissions across equipment fuel consumption, materials, waste, and transportation — and for communicating that data to property owner clients in a format aligned with GHG Protocol Category 1 requirements.
For SB 253 compliance purposes, an RCP report from your restoration contractor provides the documented, methodology-backed data needed to populate your Scope 3 Category 1 inventory for loss events. Without it, your organization faces the CARB-specified alternative: estimation using spend-based methods — which typically overstate emissions and provide no path to reduction.
What to Put in Your Vendor Agreements Now
What to put in vendor agreements now.
For California property owners preparing for SB 253 Scope 3 compliance, three vendor agreement changes directly address the restoration contractor gap. Add a GHG data delivery requirement to your preferred restoration vendor agreements, specifying RCP-compliant project emissions reports as a deliverable within 30 days of project completion. Add an ESG pre-qualification question to your emergency vendor panel selection process, asking whether candidates have adopted RCP or an equivalent methodology. And brief your property managers on the new data requirement — so that when a loss event occurs, GHG data collection is part of the project closeout process, not an afterthought six months later during annual reporting.
SB 253 enforcement has a ramp period, but the data collection requirement is retroactive to fiscal year 2026. The time to build the vendor data pipeline is now, before the loss events that will generate the data you need occur.
For property owners and asset managers in institutional real estate portfolios, the Global Real Estate Sustainability Benchmark (GRESB) is not optional — it is the standard by which your ESG performance is measured, scored, and reported to institutional investors. And as GRESB’s scoring methodology continues to align with TCFD, ISSB, and the GHG Protocol, Scope 3 supply chain data has moved from a nice-to-have to a measurable gap in your assessment score.
This article examines exactly where contractor Scope 3 data fits in the GRESB Real Estate Assessment, what the consequences of a data gap look like in practice, and how the Restoration Carbon Protocol (RCP) gives property owners a direct path to closing it.
How GRESB Measures Scope 3
How GRESB measures Scope 3.
The GRESB Real Estate Assessment is structured around two components: Management (governance, policy, targets, and reporting) and Performance (actual environmental and social data). Scope 3 emissions surface in both.
In the Management component, GRESB evaluates whether your organization has a GHG emissions reduction target that includes Scope 3, and whether your supply chain policies address emissions reporting from contractors and vendors. Property owners without explicit contractor emissions standards in their procurement policies lose points here.
In the Performance component, GRESB collects actual GHG data at the asset level — and Scope 3 Category 1 (Purchased Goods and Services, including contractors) is part of the expected data set for organizations reporting under GHG Protocol Corporate Standard.
The Contractor Data Gap in Practice
Most property owners managing large portfolios have reasonable visibility into Scope 1 (direct combustion at owned assets) and Scope 2 (purchased electricity). The contractor supply chain is where the inventory breaks down.
Restoration contractors are among the highest-emission vendor categories in a property owner’s supply chain — yet they are engaged reactively, after loss events, and almost universally lack any mechanism for providing GHG data to their clients. A commercial building fire or flood event that triggers a six-figure restoration project will generate significant Scope 3 Category 1 emissions. Those emissions belong in your GRESB data. In most cases, they are simply missing.
What RCP-Compliant Contractors Provide
The Restoration Carbon Protocol gives restoration contractors a standardized methodology for calculating and communicating project-level emissions data — covering equipment fuel consumption, materials with embedded carbon, waste generation, and transportation. RCP output maps directly to GHG Protocol Category 1 reporting requirements.
For GRESB participants, this means an RCP-compliant restoration contractor can provide the data needed to populate your Scope 3 Category 1 inventory for loss events — closing a gap that most property owner GHG inventories currently leave blank. That data supports your GRESB Performance score and demonstrates supply chain governance maturity in the Management component.
Tenant Emissions: The Category 13 Problem
While contractor data is the most actionable gap for most BOMA members, tenant emissions represent the largest Scope 3 exposure in most property portfolios. GRESB specifically evaluates whether property owners collect tenant energy and emissions data — and whether green lease clauses are in place to facilitate that collection.
The contractor and tenant problems are structurally similar: both involve third parties operating within your assets whose emissions appear in your Scope 3 inventory, but whose data collection you do not directly control. Green leases address the tenant side. Contractor ESG requirements in your procurement standards — and RCP adoption by your preferred vendor panel — address the contractor side.
Practical Steps for GRESB Participants
Practical steps for GRESB participants.
For property owners currently completing or preparing for GRESB assessments, three actions directly improve your Scope 3 contractor data position. First, add an ESG data reporting requirement to your preferred vendor agreements — specifying that contractors must provide project-level GHG data in a format compatible with GHG Protocol Category 1 reporting. Second, ask your preferred restoration contractors whether they have adopted the Restoration Carbon Protocol or a comparable methodology. Third, build contractor emissions data into your post-loss project closeout process — making GHG reporting a deliverable alongside cost documentation and certificate of completion.
These are not theoretical improvements. They are the specific steps that convert a data gap in your GRESB Performance section into a documented, improving metric — the kind institutional investors recognize as evidence of genuine ESG program maturity rather than checkbox compliance.
When the sustainability conversation turns to Scope 3 emissions, property owners and facility managers are often lumped together. Both manage buildings. Both hire contractors. Both face regulatory pressure from California SB 253, CSRD, and investor frameworks like GRESB and CDP. But the obligations, the data gaps, and the strategic levers are fundamentally different depending on which side of the lease you sit on.
BOMA members — building owners, asset managers, and property managers — occupy a distinct position in the Scope 3 landscape. You own or control the asset. Your tenants generate Scope 3 emissions inside your buildings under Category 13 (Downstream Leased Assets). Your contractors generate Scope 3 emissions during capital projects and maintenance under Category 1 (Purchased Goods and Services). And your investors increasingly require you to disclose both — through GRESB assessments, CDP supply chain requests, and emerging mandatory frameworks.
The Core Distinction: Asset Owner vs. Building User
Asset owner vs building user — the core Scope 3 distinction.
IFMA’s membership is primarily the corporate occupier — the facility manager who runs operations inside a building their employer leases or owns for non-real-estate purposes. Their Scope 3 exposure is Category 1: what they buy, including the contractors they hire for restoration, maintenance, and capital projects.
BOMA’s membership is the asset side of that equation. As a property owner, your Scope 3 inventory is more complex:
Category 1 (Purchased Goods and Services): Contractors you hire — restoration companies, mechanical contractors, janitorial services, construction firms during capital improvements
Category 13 (Downstream Leased Assets): Your tenants’ energy consumption and operations inside your building — the hardest Scope 3 category to measure and the one GRESB scrutinizes most closely
Category 11 (Use of Sold Products): For REITs and developers who sell or transfer properties
The tenant emission problem is uniquely a BOMA problem. Your tenants control the space. They set the thermostat, they bring in their own contractors, they determine actual energy consumption. But under GHG Protocol rules for property owners, their emissions may appear in your Scope 3 inventory — and GRESB will ask about them.
The Contractor Data Gap: Where BOMA and IFMA Converge
Here is where BOMA and IFMA face the same structural problem: restoration contractors, mechanical service firms, and specialty trade vendors who perform work on your properties have no standardized mechanism for reporting their Scope 3 emissions data back to you.
When a water damage event triggers a restoration project — emergency extraction, structural drying, mold remediation — the contractor mobilizes equipment that burns diesel, deploys materials with embedded carbon, and generates waste. All of that falls under your Scope 3 Category 1. And almost none of it gets captured in any formal emissions inventory.
The Restoration Carbon Protocol (RCP) is an emerging industry self-standard designed to fix this. It gives restoration contractors a structured methodology for calculating and communicating Scope 3 emissions data to their property owner clients — in a format that maps directly to GHG Protocol Category 1 reporting requirements.
GRESB and the Asset Manager Accountability Stack
GRESB and the asset-manager accountability stack.
For BOMA members managing assets in institutional portfolios, GRESB is the primary accountability mechanism. The GRESB Real Estate Assessment scores assets on environmental, social, and governance performance — and Scope 3 supply chain data is an increasingly weighted component.
GRESB participants who cannot provide contractor Scope 3 data leave points on the table. More importantly, as GRESB scoring evolves to align with TCFD and ISSB frameworks, the absence of supply chain data will increasingly flag as a material gap to institutional investors.
Green Leases: The BOMA Lever IFMA Doesn’t Have
One strategic lever available to property owners that IFMA FMs typically lack is the lease itself. Green lease clauses — requirements embedded in tenant agreements around energy reporting, contractor ESG standards, and waste management — give asset managers a contractual mechanism to drive Scope 3 data collection that facility managers simply cannot replicate.
The Institute for Market Transformation’s Green Lease Leaders program and BOMA’s own sustainability frameworks both provide templates. The opportunity is to extend the same logic to contractor agreements — requiring vendors like restoration companies to provide RCP-compliant emissions data as a condition of contract.
What This Series Covers
This BOMA Scope 3 series on Tygart Media examines the Scope 3 challenge specifically through the property owner and asset manager lens. We cover GRESB reporting obligations, green lease strategy, SB 253 and CSRD compliance for real estate entities, and the contractor data gap that sits at the intersection of both the BOMA and IFMA worlds.
The RCP thread runs through all of it — because whether you are a corporate occupier FM or a property owner, the restoration contractor showing up after a loss event is generating Scope 3 emissions that belong in someone’s inventory. This series is about making sure yours is complete.
Does GRESB require Scope 3 Category 1 contractor data?
GRESB’s Real Estate Assessment includes supply chain and contractor emissions as part of its environmental data collection. While the specific weighting evolves annually, institutional investors using GRESB increasingly expect property owners to demonstrate Scope 3 supply chain visibility. Gaps in contractor data weaken your GRESB score and signal portfolio risk to asset managers.
How is a property owner’s Scope 3 different from a tenant’s?
Property owners report Scope 3 from the asset ownership perspective — including downstream tenant emissions (Category 13), upstream contractor supply chain (Category 1), and capital project emissions. Tenants report from the occupier perspective — primarily Category 1 for their own purchased services. The same building can appear in both inventories under different Scope 3 categories.
What is the Restoration Carbon Protocol and why does it matter to BOMA members?
The Restoration Carbon Protocol (RCP) is an industry self-standard that gives restoration contractors a structured framework for calculating and reporting the Scope 3 Category 1 emissions associated with their work. For BOMA members, RCP-compliant contractors provide the data needed to close the contractor gap in your GHG inventory — supporting GRESB reporting, CDP responses, and SB 253 compliance.
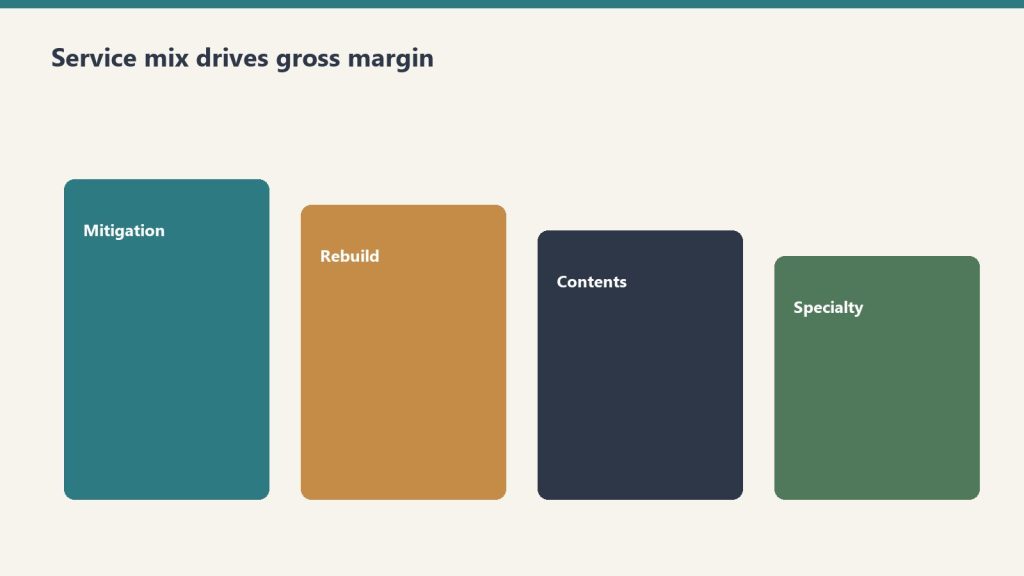
Direct answer: A restoration company’s profitability is determined more by service mix than by total revenue. Industry references consistently show water mitigation gross margins of 70-80%, mold remediation 40-50%, fire damage 25-30% with some references showing 20-25%, and reconstruction commonly cited around 10% with high-capacity volume shops achieving up to 50%. Two shops with the same $5 million revenue and the same operational competence can produce radically different profit dollars depending on whether the mix is mitigation-heavy or reconstruction-heavy. The well-run shop measures gross margin by line, prices each line to absorb appropriate overhead, and chooses mix deliberately rather than letting it drift based on whatever walks through the door.
The previous article in this cluster framed the AR cycle as the foundation discipline. This article frames service mix as the most important strategic decision an operator makes. The decisions are linked — the cycle problem is harder to solve in a reconstruction-heavy mix than in a mitigation-heavy mix, because reconstruction billing cycles are inherently longer and reconstruction margin is inherently thinner. An operator working on both at once will find that fixing service mix actually compounds the AR cycle improvements from the previous article.
The case for thinking carefully about mix starts with arithmetic. Consider two restoration companies, both running $5 million in annual revenue with identical overhead structures, identical labor costs, and identical operational discipline. Company A runs 60 percent water mitigation at 75 percent gross margin and 40 percent reconstruction at 15 percent gross margin. Company B runs 30 percent water mitigation at 75 percent gross margin and 70 percent reconstruction at 15 percent gross margin. Same revenue, same competence — different financial outcomes. Company A produces roughly $2.55 million in gross profit; Company B produces roughly $1.65 million. The mix decision alone costs Company B about $900,000 in gross profit, which after fixed overhead becomes a far larger gap in net profit. The two companies look similar from the street and from the customer-facing pitch. They are not similar businesses.
This is the conversation most restoration owner-operators do not have with themselves. They think of revenue as the goal and mix as whatever happens. They take the work that comes in. The discipline this article describes is to invert that — to treat mix as the deliberate choice and revenue as the consequence of mix multiplied by efficient execution.
What each service line actually pays
Mix shifts margin more than slogans do.
Industry references including Restoration Profits, Kiwi Cashflow’s restoration CFO commentary, the Cost of Doing Business Survey covered by Restoration & Remediation Magazine, and restoration franchise public materials produce a consistent directional picture of gross margin by service line. The numbers vary by region, geography, and company-specific factors, but the relative ordering is robust.
Water mitigation. Gross margin 70-80 percent. The highest-margin line in restoration. The economic engine: equipment does most of the work. Air movers, dehumidifiers, and air scrubbers run on 24-hour cycles with limited human attendance. Xactimate’s mitigation pricing rewards the equipment-heavy model. A typical mitigation job has labor cost around 15-20 percent of revenue, equipment rental or amortization around 5-10 percent, materials and consumables around 2-5 percent, leaving roughly 70-80 percent for overhead absorption and profit. The math works because equipment, once owned, has marginal cost approaching zero per additional job day. Industry coverage from Claims Delegates and others has explicitly described high-margin mitigation strategies as “$1,000 per hour” lines when Xactimate is used correctly.
Mold remediation. Gross margin 40-50 percent. Lower than water mitigation because the labor content is heavier and the protective cost (PPE, containment, disposal) is real. Mold work is also more documentation-intensive, more regulated, and often more disputed by carriers, all of which add cost without proportional revenue. Mitigation-style equipment (HEPA filtration, negative-air, dehumidification) supplements but does not replace skilled hand labor for source removal and structural cleaning. Mold is a real margin line for shops with the capability, but it is not the equipment-leveraged windfall that water mitigation can be.
Fire damage restoration. Gross margin 25-30 percent commonly cited; 20-25 percent in some references. The work is labor-intensive, slow, contents-heavy, and odor-and-soot-management-heavy. Fire jobs are larger and more complex than water jobs, requiring skilled project management and coordination layered on the technical work. The pricing in Xactimate supports the work but does not provide the equipment-leverage that water enjoys. Fire-damage restoration is good revenue at honest margin, but it does not produce the windfall margin that an underloaded mitigation crew can produce on the right water job.
Reconstruction. Gross margin 10-20 percent in typical operator references; up to 50 percent for high-volume operators per Cleanfax-published commentary on the most efficient operators. The wide range reflects two different business models. The standard model treats reconstruction as a service line layered onto the restoration relationship — the restoration company handles the rebuild because the customer is already in their hands, but margins are construction-industry margins (10-15 percent) plus general overhead absorption. The high-volume model treats reconstruction as a primary business with restoration relationships as the customer acquisition channel — these shops have invested in subcontractor management, project management depth, scheduling systems, and supplier relationships that allow them to run reconstruction at 30-50 percent gross margin through volume efficiency and subcontractor leverage. Most owner-operator restoration shops run reconstruction in the 10-20 percent range. A few have built the operational discipline to run it higher.
Contents cleanup. Gross margin around 50-65 percent for shops with capability. Per the same Cleanfax operator commentary, high-capacity contents shops achieve 65 percent gross margin on cleaning and around 50 percent on packouts when subcontractor pricing is doubled into invoiced cost. Contents work is real margin for shops that specialize, more variable for shops that treat it as ancillary to structure work. This line has the largest gap between specialist operators and generalist operators.
Specialty services. Gross margin variable but often strong on coordination revenue. As covered in the specialty restoration cluster, specialty work performed through a vetted subcontractor bench produces coordination revenue at high effective margin (the coordination fee is high-margin because the direct work cost is the specialist’s, not the restoration company’s). Specialty work performed in-house by the restoration company is rare and is its own business model.
Biohazard, trauma, and crime scene cleanup. Gross margin commonly cited 40-60 percent for trained operators with appropriate licenses. This is a smaller volume, higher-emotional-stakes line that pays at a premium because few operators are equipped or willing to do it. Operators who specialize here can run profitable practices at relatively low total revenue.
The overhead absorption problem
Pure gross margin numbers do not tell the full story because each service line absorbs a different proportional share of fixed overhead. A shop that runs at $5 million revenue with $1.5 million in fixed overhead (rent, salaried staff, fleet, equipment depreciation, insurance, software, marketing) has to allocate that overhead across the work it produces.
The well-run shop allocates overhead to service lines based on the share of resources each line consumes, not based on revenue share. A reconstruction job uses substantially more project-management time, more office support, more procurement effort, and more accounting time per revenue dollar than a water mitigation job. If overhead is allocated by revenue share, reconstruction looks more profitable than it actually is and mitigation looks less profitable than it actually is.
The accounting fix is service-line P&L with deliberately allocated overhead. The shop sets up its accounting to track direct cost (labor, materials, equipment, subs) by service line, then allocates fixed overhead using a cost-driver methodology — project-management time, billing time, office support time, fleet usage — that reflects actual consumption. The result is service-line contribution margin that shows what each line is actually earning after overhead absorption, not just what it earns before overhead.
Most restoration shops do not run this analysis. Most operators are surprised by the answer when they do. Reconstruction often emerges as a marginal contributor or actual loser after appropriate overhead allocation, even when its gross margin looks acceptable. Water mitigation often emerges as a much larger contributor than its revenue share suggests. The strategic implications follow from the analysis — and they are usually different from what the gut-feel running of the business produced.
How mix actually shifts in the day-to-day operation
Day-to-day mix shifts are decisions — not accidents.
Mix is not chosen in a strategy session. It shifts based on a series of small decisions made across the operation, often without anyone realizing they are shifting mix.
Marketing channels favor specific lines. Google Ads bids on emergency water keywords drive water mitigation calls. Roofer partnerships drive storm-damage reconstruction. Insurance preferred-vendor program leads come in line-mix patterns specific to each program. The marketing decisions made in the prior cluster (Marketing Stack on Tygart Media) directly shape mix.
Sales scripts favor specific lines. The way the call-taker scopes the conversation, the way the on-site rep frames the work, and the way the project manager presents options to the customer all subtly steer the work mix. A shop whose sales conversation centers on “let us handle everything” tends to capture more reconstruction. A shop whose sales conversation centers on “we are the mitigation specialist” tends to keep more focused mix.
Staffing tilts the mix. A shop that has hired heavily on reconstruction project managers will sell more reconstruction because that is what the team is configured to deliver. A shop with deep mitigation lead techs and a thin reconstruction PM bench will lean toward mitigation. The org structure and the work mix shape each other.
Carrier program enrollments drive specific line mixes. Some carrier programs are mitigation-heavy, others are reconstruction-heavy, others are biohazard-and-emergency-response-heavy. The shop’s program portfolio shapes its inbound mix more than most operators recognize.
Customer relationship behaviors drive mix. A shop that subcontracts reconstruction to trade partners on relationship terms (offering them the rebuild work in exchange for emergency referral flow) keeps mitigation margin while passing through reconstruction. A shop that holds reconstruction in-house captures both lines but absorbs both margin profiles.
Recognizing that mix is the cumulative result of these small decisions is the first step. Choosing to make those decisions deliberately is the second.
Strategic mix archetypes
Most well-run shops fall into one of four mix archetypes, each with its own logic and its own trade-offs.
Mitigation specialist. Mix heavily weighted toward water mitigation and mold remediation, with reconstruction passed through to trade partners or refused entirely. Highest gross margin profile of the four archetypes; smallest revenue per claim; highest claim volume requirement to hit a given revenue target. This model works well in metro markets with high water-loss frequency and a reliable network of reconstruction partners. The trade-off is that the specialist sees a smaller share of total restoration spend per claim — the rebuild work and the contents work go to others — and the customer relationship is shorter.
Full-service generalist. Mix balanced across mitigation, reconstruction, and contents. Most common archetype in mid-size independent shops. Captures the full claim economically but at blended margin that includes the lower reconstruction line. Works in most geographies. Trade-offs: requires operational depth across multiple service lines, requires management depth to run reconstruction at acceptable margin, and tends to produce lower overall gross margin than the specialist model.
Specialty commercial wedge. Mix weighted toward commercial accounts with specialty recovery components (documents, electronics, art, medical equipment) plus the general mitigation and reconstruction those accounts produce. The model described in the previous specialty restoration cluster. Higher revenue per relationship, higher complexity, higher operational bar. Trade-offs: longer sales cycles, regulatory and compliance overhead, and dependency on a smaller number of larger accounts.
High-volume reconstruction operator. Mix weighted toward reconstruction at scale, with mitigation as a feeder. Less common as a deliberate strategy but possible — these are the operators who have built reconstruction operational discipline equivalent to a homebuilder or commercial GC and who run reconstruction at 30-50 percent gross margin. The Cleanfax-cited high-capacity volume shops fall in this archetype. Trade-offs: requires substantial management investment in reconstruction operations, exposes the business to construction-cycle dynamics, and runs into the long-cycle AR problem from the prior article harder than the mitigation-led models.
The choice of archetype is not permanent. Many shops evolve from one to another as they grow, change ownership, or respond to market shifts. The point is to choose deliberately, build the operations to support the chosen archetype, and resist drift back to whatever-walks-through-the-door because that drift is what produces undisciplined service mix and the lower margins that follow.
Pricing each line to absorb appropriate overhead
The 10-and-10 myth — that restoration contractors should bill 10 percent overhead and 10 percent profit on top of direct costs as the standard markup — is one of the most damaging conventions in the industry. Industry coverage from Restoration & Remediation Magazine has covered this extensively under the “10 and 10 myth” framing. The math simply does not work. A shop with $5 million in revenue and $1.5 million in fixed overhead is running at 30 percent overhead, not 10 percent. Pricing at 10-and-10 means the shop is losing money on every job and making it up only when extreme volume covers the gap.
The disciplined alternative is to know the shop’s actual overhead rate as a percentage of direct cost and to price each service line with a markup that absorbs an appropriate share. For a shop with 30 percent overhead, the minimum markup over direct cost is roughly 50 percent (which produces gross margin around 33 percent — exactly the breakeven before profit). For acceptable profit, markup of 75-100 percent over direct cost is more common. The Xactimate price list, when used correctly, supports this markup level on most service lines. The shop’s price list and Xactimate practice should reflect the true overhead structure and the target profit margin, not industry conventions that are decades out of date.
The pricing decision differs by service line. Water mitigation can support high markup because the equipment-heavy model produces low direct cost, leaving room. Reconstruction is harder to mark up because direct cost is dominated by subcontractor and material cost, both of which are visible to customers and adjusters. The well-run shop applies different markup logic to different lines and matches its pricing to its actual cost structure rather than to a uniform convention.
For shops that are uncertain whether their pricing is right, the diagnostic is simple. Pull twelve months of P&L. Compute gross margin by line. Compute fixed overhead as a percentage of revenue. Compute net margin. If net margin is below 8-10 percent, pricing or mix is wrong. If gross margin on water mitigation is below 70 percent, Xactimate practice is the likely culprit. If gross margin on reconstruction is positive at any level, the shop is doing better than many; the question is whether the reconstruction is absorbing its appropriate share of overhead. The numbers reveal the problem; the operator’s job is to diagnose specifically and intervene at the right point.
What to refuse
What to refuse is a margin decision wearing a values jacket.
The hardest discipline in service mix is refusing work that does not fit. Most restoration owner-operators struggle with this because every job feels like revenue and revenue feels like progress. But work that runs below contribution margin (revenue minus direct cost minus appropriate overhead allocation) actually subtracts from the business — every dollar of bad-fit revenue requires the next dollar of good-fit revenue to make up the loss.
Specific patterns of work that the disciplined shop is willing to refuse:
Reconstruction at price points that require the shop to break its actual cost structure. Customers and adjusters who insist on 10-and-10 markup on reconstruction are asking the shop to lose money on the rebuild. The discipline is to either decline or to pass the rebuild to a trade partner who can do it at the contemplated price.
Out-of-area work that requires excessive mobilization. The labor and equipment cost of crews working far from base eats margin in ways the customer does not see. A shop with capacity issues during a CAT event can sometimes justify out-of-area work at higher pricing, but routine out-of-area work at standard pricing is usually a margin loser.
Carrier programs whose pricing structure does not fit the shop’s cost structure. Some preferred-vendor programs price meaningfully below market with the expectation of volume making up for unit margin. Whether this trade is worth taking is operator-specific, but the shop that signs into every program offered without doing the math is signing into structural losses.
Customer relationships that consume management time at scale. Some customers and adjusters require an hour of phone time and three documentation revisions for every invoice. The shop’s project management cost on these accounts often exceeds the gross profit. The discipline is to identify these accounts and either reset the relationship or end it.
Work the shop does not have the operational depth to deliver well. Taking a fire job when the shop has no fire-experienced lead tech, or a commercial loss when the shop has no commercial PM, is taking work the shop will execute poorly and damage its reputation on. The work feels like revenue; the reputation cost compounds against future revenue.
The operator who can decline bad-fit work calmly and confidently is operating from financial clarity. The operator who cannot is operating from fear that the next call may not come. The financial clarity is what comes from running this analysis and knowing the numbers cold.
How this article fits the cluster
Mix is the second foundation decision after AR cycle. With both in place, the rest of the cluster has solid ground to stand on. The next article — equipment economics — depends on understanding mix because equipment ROI is line-specific (water mitigation equipment has different utilization economics than reconstruction equipment). The crew structure and KPI dashboard articles that follow build on both foundation decisions.
If the prior article (AR cycle) is the highest-leverage operational improvement most restoration shops can make, this article (service-line mix) is the highest-leverage strategic improvement. They are different kinds of work — AR is a tactical, weekly operating discipline; mix is a quarterly and annual strategic discipline — but both produce outsized returns relative to the effort required.
Should I be running service-line P&L if my accounting system doesn’t support it natively?
Yes, with manual allocation if necessary. The first version can be a quarterly spreadsheet exercise — pull total revenue, total direct cost, and total overhead from the financial statements, then estimate the mix and the line-specific direct cost ratios. The numbers are imprecise but directionally accurate, and they will surface the strategic question even before the accounting system is reconfigured. Once you have decided that mix matters, invest in setting up the accounting to produce the analysis automatically.
Why is reconstruction so much harder to make money on?
Three structural reasons. First, the work is dominated by labor and materials, both of which are heavily benchmarked by competitors and carriers. Second, the cycle is long, so working capital cost is higher. Third, the customer can see the cost of the materials and the visible labor in ways they cannot for mitigation, which makes pricing pressure harder to absorb. The operators who run reconstruction at high margin have invested in subcontractor management, supplier relationships, and project-management efficiency that takes years to build.
Should an owner-operator pursue the high-volume reconstruction archetype?
Probably not as a starting strategy. The high-volume reconstruction model requires substantial management infrastructure that is expensive to build and difficult to maintain. Most owner-operators who try to evolve into this model end up with reconstruction-heavy mix at standard 10-15 percent margin rather than the 30-50 percent the well-built operators achieve. The honest assessment is that this archetype works for a small number of operators who have the construction-management capability, and most owner-operators are better served by mitigation specialist or full-service generalist archetypes.
What is a realistic mix to target if I want to maximize gross profit?
A mix-of-business analysis specific to your geography, capability, and capacity is needed for an actual answer. As a directional reference, mitigation specialists often run 60-75 percent mitigation and mold (combined), 15-25 percent contents and specialty, and 0-15 percent reconstruction (often passed through). Full-service generalists run 35-50 percent mitigation and mold, 15-20 percent contents and specialty, and 30-50 percent reconstruction. The right mix for a specific shop is a function of the local market, the shop’s operational depth, and the owner’s risk tolerance.
Does the specialty restoration wedge from the prior cluster fit into mix strategy?
Yes, directly. Specialty work is a high-coordination-margin add to the mix. The specialty cluster’s commercial-account focus produces relationships that generate mitigation, reconstruction, and specialty revenue together, and the specialty coordination component is high-margin in a way that lifts the blended profile. Operators who have built specialty capability typically see their mix shift toward more mitigation and specialty, less commodity reconstruction.
How often should I revisit the mix question?
At minimum, annually as part of business planning. More frequently if the shop is growing fast, going through ownership changes, expanding geography, or seeing significant changes in carrier program enrollments. A quarterly directional review is good discipline. Monthly is overkill. Weekly is panic.
What if I’m carrying lines I’m bad at because I haven’t done this analysis before?
The disciplined response is to either invest in becoming good at the line (hire, train, partner) or exit the line. Carrying lines you are bad at is carrying work that produces below-average margin and below-average customer experience. It is the worst of both worlds. The annual review process should produce these decisions explicitly.
Are biohazard, trauma scene, and unattended death cleanup really good margin work?
For shops with proper licensing and trained crews, yes. The pricing supports the work and the competitive density is low because most operators do not want the work. The trade-offs are emotional weight on the crew, careful customer-facing communication, and licensing and disposal compliance overhead. For shops with the right operational fit, this is a legitimate niche.
What’s the relationship between mix and consolidator interest in acquiring my shop?
Consolidators value mix-driven margin profile. A shop with disciplined mitigation-heavy mix at clean margin is a more attractive acquisition target than a shop with the same revenue but lower margin from undifferentiated reconstruction-heavy mix. The mix work this article describes is also exit-positioning work, and operators who run it well over a few years are positioning for a stronger acquisition outcome whether or not they intend to sell.
What is the single move I should make this week from this article?
Pull last quarter’s P&L, estimate revenue and direct cost by service line, compute the implied gross margin per line, and compare to the industry directional ranges in this article. If your mitigation gross margin is below 70 percent, your reconstruction gross margin is below 10 percent, or your overall mix is reconstruction-heavy without operational depth supporting it, the analysis has identified the largest profitability lever in your business. Treat the answer as the agenda for the next quarter.
Direct answer: A restoration company’s profit and loss statement and its bank account tell two different stories, and the gap between them is the AR cycle. Industry data references show construction-sector DSO averaging around 83 days — the highest of any major industry — and restoration claim cycles stretching well beyond 60-90 days are common. The well-run shop measures days sales outstanding by carrier, by service line, and by job size, builds working capital reserves sized to the actual aging profile rather than the optimistic version, and runs documentation discipline that removes the most common reasons adjusters delay payment. Compressing days-to-cash from 90+ down to a defensible 45-60 is worth more to most restoration companies than a 5-point margin improvement, because it directly funds growth without external capital.
The single most common silent killer of growing restoration companies is not bad work, bad marketing, or bad people. It is the gap between when the cash goes out and when the cash comes in. A restoration company growing at 30 percent per year is, by definition, funding 30 percent more labor, more equipment, more materials, and more subcontractor invoices than the previous year — out of working capital that has not yet been replenished by the carrier checks for last quarter’s work. The math compounds. Every additional dollar of revenue requires roughly the same proportional dollar of working capital. A growth rate that exceeds the working-capital cycle eventually exhausts the bank account, even while the P&L looks healthy and the owner cannot understand why payroll is suddenly hard to make.
The first move toward fixing this is recognizing that the AR cycle is not a back-office annoyance. It is the central operational metric of the restoration business model. Operators who understand and manage it correctly run growing companies without external capital. Operators who do not understand it either grow slower than their market opportunity allows or take on debt they do not need to take on. The well-run shop treats AR cycle as a strategic discipline.
This article is the first cluster piece in the finance and operations stack and is the one most operators should attack first. The rest of the cluster builds on the assumption that the AR cycle is under control. Without it, the other improvements in service mix, equipment economics, crew structure, and KPI hygiene cannot compound.
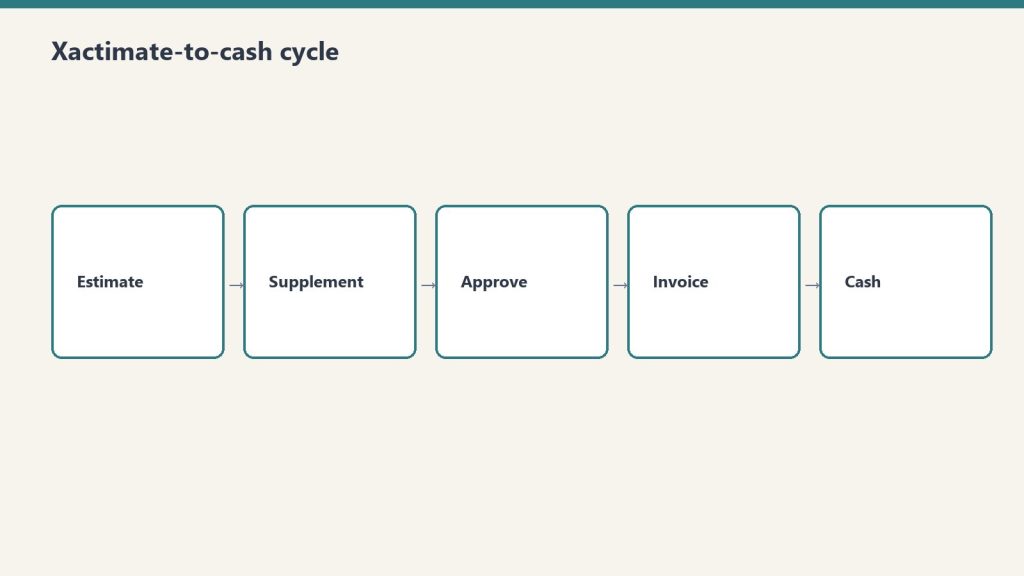
What the Xactimate-to-cash cycle actually looks like
What the Xactimate-to-cash cycle actually looks like.
The Xactimate-to-cash cycle has more steps than most operators map out. Each step is a place where days accumulate. The full sequence on a typical commercial or residential insurance claim:
Loss event and dispatch. Day zero. Restoration company arrives, performs emergency mitigation, begins documentation.
Mitigation completion. Days three to seven on a typical water loss. Drying complete, dry standards verified, mitigation invoice ready to assemble.
Mitigation invoice submission. Days seven to fourteen. Restoration company assembles the mitigation invoice — Xactimate estimate, photos, moisture logs, daily reports, work authorization, certificate of completion — and submits to the adjuster.
Adjuster review and approval. Days fourteen to thirty-five. Adjuster reviews the submission, may request additional documentation, may negotiate scope or pricing, eventually approves the invoice in whole or in part. Independent industry references from restoration billing services note that documentation gaps are the most common reason adjusters extend this window — missing photos, incomplete moisture logs, inconsistent line items, or scope items that cannot be supported by the documentation.
Carrier payment processing. Days thirty-five to sixty. Carrier processes the approved invoice and issues payment. For claims involving a mortgaged residential property, the check is typically made out jointly to the policyholder and the contractor, which means the homeowner has to endorse and forward, and lender involvement is required for claims above a threshold (commonly $10,000-$15,000) where mortgage companies release funds in stages.
Reconstruction or repair phase. Begins after mitigation phase. The reconstruction scope is developed, approved, and executed. The cycle for reconstruction billing repeats — invoice assembly, adjuster review, carrier processing — but on a longer cycle because reconstruction work itself takes longer.
Final invoice and closing. Days ninety to one-hundred-eighty for a fully reconstructed loss. Final scope reconciliation, depreciation holdback recovery on RCV claims, retainage release if applicable.
The aggregated cycle on a typical mid-size residential or commercial loss runs sixty to one-hundred-twenty days from loss to full payment. On larger commercial losses with multiple phases, scope disputes, or coverage issues, it stretches to one-hundred-eighty days or more. On problematic claims with denied items, public adjuster involvement, or litigation, it can stretch into multi-year territory.
For working-capital math, the simple version is that every dollar of revenue requires roughly the proportional dollars of cash held in AR for the average cycle length. A shop with $10 million in annual revenue and a 90-day cash cycle is carrying roughly $2.5 million in average AR — and that AR is funding the labor, equipment, materials, and subcontractor cost the shop is incurring on the next set of jobs. Compress the cycle to 60 days and the shop’s working-capital requirement drops to roughly $1.65 million, freeing $850,000 in cash for growth, debt reduction, equipment investment, or distribution. Compress further to 45 days and the freed cash hits $1.25 million. These are real, recoverable numbers, and they show up in the bank account, not just on the spreadsheet.
Why DSO is the wrong single metric and the right multi-metric
Most restoration companies that measure AR at all measure a single overall DSO number, calculated as accounts receivable divided by total revenue, multiplied by the number of days in the period. This is the standard cross-industry calculation and it produces a useful directional read — but on its own it is not actionable, because the underlying AR is not homogenous. The well-run shop measures DSO three ways simultaneously.
DSO by carrier. The DSO with State Farm is different from the DSO with USAA, which is different from the DSO with Allstate, which is different from the DSO with the local independent commercial carriers. Some carriers pay reliably in 30-45 days; some stretch to 60-90; some stretch beyond 90 routinely. The shop that knows its DSO by carrier can make rational decisions — which programs to lean into, which to pull back from, which to limit exposure on. The shop that knows only its blended DSO is making aggregate decisions on heterogeneous data.
DSO by service line. Mitigation invoices typically pay faster than reconstruction invoices because they are smaller, simpler, and structured to industry-standard mitigation Xactimate line items. Reconstruction invoices pay slower because they involve more scope negotiation and more adjuster review. Specialty work — documents, electronics, art, medical — pays in patterns that depend on the carrier’s familiarity with the specialty pricing and on whether the specialist bills direct or through the prime restoration company. A shop that knows DSO by service line can spot whether the cycle problem lives in mitigation, reconstruction, or specialty.
DSO by job size. Small jobs (under a few thousand dollars) often pay quickly because adjusters approve them with minimal review. Mid-size jobs ($10,000-$50,000) often hit the worst of both worlds — large enough to require full documentation review, small enough to lack the executive attention that moves large losses through the system. Large jobs (over $100,000) often have dedicated adjuster attention, large-loss specialists involved, and faster decision-making once scope is settled, although the cycle from loss to first payment can still be long. A shop that knows DSO by job size can identify the band where the cycle is most painful and target documentation and follow-up effort there.
The combined picture — DSO by carrier, by service line, by job size — is what produces actionable management information. Most restoration companies do not produce this view because their accounting systems are not configured to slice AR this way and their internal reporting effort has been on top-line metrics. Configuring the accounting system to support this slicing is a one-time investment that pays back almost immediately.
What is causing the long cycle, and which causes are operator-controllable
Operator-controllable causes of a long cycle.
The long restoration cycle has multiple causes, and the operator’s intervention point is different for each.
Documentation gaps. Operator-controllable, high impact. Industry references from restoration billing services consistently identify documentation as the single largest cause of payment delays. An invoice missing photos, moisture logs, daily reports, signed work authorizations, or scope justification gives the adjuster a defensible reason to delay payment with a request for more information. Each round trip costs five to fourteen days. A shop that submits complete, clean, defensible documentation on the first submission collects faster than a shop that submits incomplete documentation and chases revisions.
Xactimate scope quality. Operator-controllable, high impact. An Xactimate estimate that uses incorrect line items, that prices outside the standard price list without justification, or that includes scope items not supported by the documentation will be reduced or returned. Real Xactimate proficiency — Level 1 certification at minimum, Level 2 ideal, in-house or contracted — pays for itself on the first half-dozen invoices. Operators who use Xactimate as a glorified word processor without understanding the underlying line-item logic submit estimates that produce avoidable disputes.
Carrier program structure. Partially operator-controllable. Different carrier preferred-vendor programs have different documentation requirements, different review cycles, and different payment-processing timelines. Some require submission through specific portals (Verisk’s claims platforms, Symbility, carrier-specific systems) that produce faster cycles than email-based submission. Some require pre-approval at scope thresholds. The operator’s intervention point is to learn the program’s specifications cold and submit to specification, and to selectively de-prioritize programs whose cycle structure does not work for the shop’s working-capital tolerance.
Mortgage company involvement. Limited operator-controllability. On residential losses where the property is mortgaged, the lender’s check-handling protocol adds a cycle layer the contractor cannot eliminate. The intervention is to communicate the lender process to the homeowner early, provide the documentation the lender will require (final invoices, work completion certificates, lien waivers) ahead of need, and follow up actively rather than passively waiting.
Public adjuster involvement. Mixed operator-controllability. When a PA is on the file, scope is scrutinized harder and disputes take longer. The contractor’s intervention is to maintain documentation discipline strict enough to survive PA scrutiny, communicate professionally with the PA on scope questions, and avoid behaviors that escalate the file unnecessarily.
Coverage disputes. Limited operator-controllability. When the carrier disputes coverage on items the contractor has performed, the cycle stretches indefinitely. The intervention is upfront — confirming coverage on questionable items before performing the work, getting written authorization on scope expansions, and avoiding work the policy clearly does not cover.
Litigation. Not operator-controllable except by avoidance. Once a claim is in litigation, the cycle is governed by the legal process rather than the claims process. The contractor’s defense is to not get into litigation in the first place, which means honest scope, complete documentation, professional communication, and a willingness to walk away from disputes that are not worth litigating.
The pattern in this list: the highest-impact causes are operator-controllable. Documentation discipline and Xactimate scope quality are the two largest levers, and they are entirely within the shop’s control. Operators who blame the long cycle on the carriers without first auditing their own documentation and Xactimate practice are diagnosing the wrong problem.
The operational moves that compress the cycle
Operational moves that compress the AR cycle.
The well-run shop runs a specific set of operational practices that compress the AR cycle. These are not novel and they are not glamorous. They are the practices that produce the difference between a 90-day cycle and a 45-60 day cycle.
Document at the job level, in real time. Not at invoice time. Photos taken on day one, moisture logs updated daily, daily reports completed by the lead tech before leaving site, scope-of-loss documented progressively as the work develops. Documentation assembled at invoice time is documentation that has gaps. Documentation assembled in real time is documentation that is complete on day seven when the mitigation invoice is ready to go out.
Use a documentation platform. Several industry-standard platforms — including CompanyCam for photos, MICA and ENCIRCLE for full documentation packages, and proprietary platforms from larger carriers’ preferred-vendor programs — automate documentation capture. Operators using these platforms submit cleaner invoices and submit them faster than operators relying on phone photos and paper logs.
Build the Xactimate estimate as the work progresses, not after. The mitigation Xactimate estimate should be largely written by the time the drying is finished. The reconstruction Xactimate estimate should be developed during the mitigation phase, not after the customer authorizes the rebuild. Operators who treat Xactimate as a billing-time activity add days to the cycle that the operators who treat it as a project-execution activity do not.
Submit the invoice on a schedule. The shop’s standard should be invoice within seven days of mitigation completion, with no exceptions for shop-side delays. Customers and adjusters pay invoices that arrive promptly faster than they pay invoices that arrive late, partly because the file is fresh and partly because prompt invoicing signals professional operations.
Follow up on a schedule. Adjuster contact at day fourteen post-submission if not approved, day twenty-one with escalation request, day thirty with escalation to the carrier’s claims service line. Adjusters have hundreds of files. The files that get attention are the ones the contractor stays present on. The files that drift are the ones where the contractor submits and waits silently.
Reconcile cash to invoices weekly, not monthly. The accounting team should know which invoices are open, by carrier and by adjuster, every week. Stale aging that is not reviewed is aging that gets older. Weekly review with explicit follow-up assignments produces faster collections than monthly review.
Use a billing service when in-house capacity does not exist. Restoration-industry-specific billing services — companies like Restoration Insurance Billing, Blackwater Billing Services, NetClaimsNow, and others — exist specifically to handle Xactimate invoice assembly, submission, and follow-up. For shops that do not have in-house Xactimate competence or in-house collections discipline, outsourcing this function to a specialist often produces a faster cycle than handling it in-house at the shop’s current capability level. The fee is paid out of the cash-cycle compression.
Working capital strategy
Compressing the AR cycle reduces but does not eliminate working capital intensity. Even at a defensible 45-60 day cycle, a growing restoration company carries substantial cash in receivables. The well-run shop has a deliberate working capital strategy that funds this intensity without surprises.
Cash reserve sized to the actual aging profile. A shop with a 60-day cycle should carry cash reserves sufficient to operate for at least 60 days at current burn rate, plus a buffer for delayed collections on specific files. Many operators size reserves to 30 days of operating cost, which is too thin for restoration’s cycle. Sizing reserves to 75-90 days of operating cost, with a clear policy on when reserves can be drawn down for growth investment versus when they must be held, gives the shop room to absorb a slow collection month without payroll stress.
Line of credit as a flex tool, not a permanent funding source. Most growing restoration shops should have a working-capital line of credit with a commercial bank, sized to cover one to two months of operating cost. The line is a tool for absorbing month-to-month variation in collections, not a tool for funding ongoing operations. Shops that operate continuously on the line of credit are shops with a structural cash problem they have papered over with debt.
Customer financing as a deliberate tool. On residential reconstruction work where insurance does not cover the full scope, customer financing can be offered through restoration-industry-specific finance partners or general home-improvement finance platforms. This converts a payment-cycle question into a marketing question and shifts the cycle off the shop’s balance sheet.
Avoid AOB-driven cash flow models. Some restoration companies build their cash flow on aggressive use of assignments of benefits, where the carrier pays the contractor directly. AOBs solve the homeowner-endorsement step but do not address the underlying claim cycle, and several states have passed AOB reform that complicates or restricts the practice. Building working capital strategy around AOBs is fragile both legally and operationally.
Factoring as last resort, not first option. Specialty receivables-factoring firms exist that will advance against restoration AR, but the cost is meaningful (often 2-4 percent per month effective rate) and using factoring routinely indicates that the underlying cycle problem has not been fixed. Use factoring only as a bridge while implementing the operational improvements that compress the cycle, not as a permanent solution.
What the AR cycle reveals about the rest of the business
The AR cycle is a diagnostic tool as much as it is an operational metric. Specific patterns in the AR aging report point to specific underlying issues elsewhere in the operation.
Long cycle on a specific carrier. The carrier’s program structure may not fit the shop’s working-capital tolerance, or the shop’s documentation may not fit the carrier’s submission requirements. Either way, this is a focused intervention point.
Long cycle on a specific service line. The Xactimate competence in that service line may be weaker, or the documentation discipline may be looser. Investigate the lead tech and project manager on that service line and compare practice to the better-performing service lines.
Long cycle on a specific job size. Process gaps in the size band — possibly insufficient project-management attention on mid-size jobs or insufficient documentation rigor on small jobs that get treated casually. Address process at the size band rather than the job level.
Long cycle on jobs led by a specific project manager. The PM’s documentation, communication, or follow-up practice may be substandard. Coachable, often quickly.
Spike in cycle in a specific month. Look for upstream issues — was a billing person out, did a software change disrupt invoice generation, did a regulatory change affect a common scope item, did a carrier change its program. The cycle is the downstream symptom of upstream operations.
The shop that uses AR aging as a diagnostic produces continuous improvement. The shop that uses AR aging only as a financial-statement input misses most of the management information the metric carries.
How this article fits the cluster
The AR cycle is the foundation. The next article in the cluster — gross margin by service line — depends on the AR cycle being defensible, because service-line economics that look good on margin but fail on cash conversion are not actually good economics. The articles that follow on equipment economics, crew structure, KPI dashboards, and the rest all assume the operator has working capital under control. An operator who works through the rest of the cluster without first fixing the AR cycle is building on sand.
If you take only one operational improvement from this entire cluster, take this one. The investment is modest — documentation discipline, Xactimate competence, scheduled follow-up, weekly cash review. The return is direct, measurable, and recurring. Compressing days-to-cash from 90 to 60 frees roughly two months of revenue in working capital. For a $5 million shop, that is roughly $830,000 in cash. For a $20 million shop, it is roughly $3.3 million. Those are not theoretical numbers. They are sitting in your AR right now.
What is a realistic DSO target for a restoration company?
For mitigation-heavy work with disciplined operations, 45-60 days is achievable. For mixed mitigation and reconstruction work, 60-75 days is realistic. For reconstruction-heavy work, 75-90 days is realistic. Operators running 90+ days have specific operational issues that should be diagnosable from the by-carrier, by-service-line, by-job-size view. Targeting under 30 days is unrealistic in this industry; targeting under 45 is achievable on the mitigation side but not the reconstruction side.
Should I use a restoration-specific billing service or build in-house?
Depends on shop size and current capability. Shops under $3 million with no in-house Xactimate-certified estimator typically benefit from a billing service — the cost is roughly offset by the cycle compression. Shops over $5 million should generally have in-house capability because the service fees become a real expense at scale and because in-house ownership of the cycle produces better discipline. Shops in between can go either way; the deciding factor is whether in-house capacity is genuinely competent or whether it is the owner-operator’s spouse doing it on weekends.
How do I get my AR aging by carrier, service line, and job size if my accounting system doesn’t slice it that way?
This is a one-time configuration project. Most accounting systems used by restoration companies (QuickBooks Online, QuickBooks Enterprise, Sage Intacct, NetSuite, restoration-specific platforms like Albi, KnowHow, and others) support custom fields or class tracking that can produce this slicing. The configuration takes a few days of accountant time and pays back permanently. If your current system genuinely cannot support this, the system is the bottleneck.
What about retainage on commercial work?
Commercial reconstruction often involves retainage (commonly 5-10 percent held until project completion) which extends the cycle on the retained portion well beyond the standard cycle. Build retainage into the AR aging view as a separate category so the operating cycle on the non-retained portion is visible cleanly. Retainage release is its own follow-up activity that should be treated as a managed process, not as something that happens automatically.
What if a specific carrier program is producing a long cycle but represents a meaningful portion of revenue?
This is a strategic decision, not just an operational one. The cycle math is real — if a carrier program produces revenue at acceptable margin but stretches AR by an extra 30 days, that’s a working-capital cost that the program revenue should justify. Quantify the cost (roughly the additional AR carried at the cost of capital), compare to the program’s contribution to gross profit, and decide whether the program is net positive on cash-adjusted economics. Many operators discover that programs they thought were valuable are actually drag once the cycle cost is accounted for.
How do I handle homeowners who do not endorse the joint check from the mortgage company?
This is a customer-service issue layered on a cash-cycle issue. Communicate the joint-check process to the homeowner before the loss is even mitigated, get them comfortable with the workflow, and follow up actively when the check is issued. Most customers cooperate; the few who do not usually have a deeper issue (dispute over scope, dispute over quality, financial distress) that needs to be addressed directly. Avoid letting these accounts age silently.
Is a line of credit absolutely necessary, or can a shop run without one?
Smaller shops under $1-2 million can sometimes run without one if reserves are healthy and growth is moderate. Shops over $3 million typically benefit from having one even if it sits unused most months — the optionality is worth the modest commitment fee. The decision is risk tolerance: a line of credit is insurance against a slow collection month, and like all insurance, it is most valuable when not needed.
How do I know if my Xactimate practice is the bottleneck?
Pull your most recent ten mitigation invoices and ten reconstruction invoices. For each, document the date submitted, the date approved, and any back-and-forth requests from the adjuster. If more than 30 percent of submissions trigger requests for revisions, your Xactimate practice has gaps. The specific gaps will be visible in the revision requests — line items used incorrectly, pricing outside standard with insufficient justification, scope items unsupported by documentation. Address those gaps directly, and the cycle compresses.
Can compressing the AR cycle actually replace the need for outside capital on a growing shop?
For most shops in the $1-30 million range, yes. The math works because each dollar of cycle compression frees a proportional dollar of working capital, and that capital recurs every cycle. Compressing cycle from 90 to 60 days on a $10 million shop frees roughly $830,000 in cash; on a $20 million shop, roughly $1.7 million. Those numbers fund meaningful growth without any external capital. Operators with cleaner AR cycles typically do not borrow for working capital because they do not need to.
What is the single most important practice I can install this week?
Daily documentation by the lead tech on every job, completed before the tech leaves site. Photos of pre-mitigation and post-mitigation conditions, moisture readings logged with timestamps, daily report covering work performed and conditions encountered, signed work authorization on file from day one. This single practice will compress your invoice submission time and reduce documentation-driven adjuster delays by more than any other change. Everything else in this article matters; this is where to start.
If you are a facility manager trying to understand your Scope 3 ESG obligations, you have almost certainly encountered three acronyms that sound similar but operate very differently: GRESB, CDP, and SB 253. Each one creates real obligations for FM operations — but they apply to different organizations, require different data, and serve different audiences. This article maps the landscape so you can determine which frameworks govern your program and what each one specifically requires from your contractor data collection.
GRESB: The Asset-Level Framework
GRESB (the Global Real Estate Sustainability Benchmark) is an investor-driven ESG assessment framework for real estate portfolios. It is primarily used by property owners, REITs, and real estate investment managers who need to demonstrate sustainability performance to institutional investors.
Who it primarily affects: BOMA-type property owners and real estate investors. If you are an FM at a corporate occupier — a company that uses its buildings for operations, not as investment assets — GRESB is typically your asset manager’s problem, not yours.
What it asks about contractors: GRESB’s Real Estate Assessment includes questions about green building certifications, energy performance, and sustainability policies for construction and renovation projects. It does not currently have a Scope 3 contractor data requirement comparable to GHG Protocol Category 1. However, GRESB is evolving its framework to incorporate more supply chain data as investor pressure increases.
IFMA relevance: Low to medium, unless your corporate occupier organization owns its real estate portfolio and participates in GRESB as both occupier and investor. In that case, GRESB and GHG Protocol obligations overlap.
CDP: The Voluntary Disclosure Framework
CDP (formerly the Carbon Disclosure Project) operates a global disclosure system that allows companies to report their environmental data to investors, purchasers, and the public. CDP’s Supply Chain program specifically requests Scope 3 data from suppliers — which means your organization may receive CDP questionnaires from your own customers asking about the emissions associated with the services you provide to them.
Who it primarily affects: Companies that participate voluntarily in CDP disclosure, and companies whose corporate customers require supplier CDP responses. CDP is used by many large corporate occupiers as a sustainability disclosure mechanism.
What it asks about contractors: CDP’s corporate questionnaire includes Scope 3 Category 1 disclosure. If your organization reports to CDP, you are expected to include Category 1 emissions from your contractors — including restoration vendors — in your response. CDP accepts activity-based and spend-based estimates; it also tracks year-over-year improvement in data quality.
IFMA relevance: High for FM teams at organizations that participate in CDP or whose parent companies have signed CDP commitments. CDP is often the first Scope 3 reporting pressure FM teams experience, because it is voluntary but publicly visible — investors and customers can see whether your organization reports and how complete your data is.
SB 253: The Mandatory Disclosure Framework
California SB 253 — the Climate Corporate Data Accountability Act — is mandatory, not voluntary. It requires companies with over $1 billion in annual revenue doing business in California to disclose Scope 1, 2, and 3 emissions on a phased schedule: Scope 1/2 starting in 2026 (for fiscal year 2025 data), Scope 3 starting in 2027 (for fiscal year 2026 data). Reports must be independently verified by a CARB-registered third-party auditor.
Who it primarily affects: Any company doing business in California with over $1 billion in annual revenue. This is a wide net — it captures many large corporate occupiers regardless of headquarter location.
What it asks about contractors: SB 253 uses GHG Protocol methodology, which requires reporting all material Scope 3 categories. Category 1 (contractors and suppliers) is a mandatory category under the GHG Protocol for most organizations. Restoration contractors are a Category 1 source. SB 253’s independent verification requirement means your auditor will scrutinize the quality of your Category 1 data — spend-based estimates will be accepted but flagged as lower quality than activity-based data.
IFMA relevance: High for FM teams at large corporate occupiers doing business in California. This is the framework with the hardest deadline and the most compliance consequence.
EU CSRD: The European Mandatory Framework
For completeness: the EU Corporate Sustainability Reporting Directive (CSRD) applies to large EU companies and, in some cases, non-EU companies with significant EU operations or revenue. CSRD requires disclosure under the European Sustainability Reporting Standards (ESRS), which include Scope 3 under ESRS E1. Like SB 253, it requires third-party verification and covers supply chain emissions.
IFMA relevance: High for FM teams at multinational corporate occupiers with European operations. CSRD and SB 253 overlap in their Scope 3 requirements, meaning data infrastructure built for one framework largely serves both.
The Framework Decision Matrix
Framework
Voluntary or Mandatory
Who It Applies To
Contractor Scope 3 Required?
IFMA FM Priority
GRESB
Voluntary (investor-driven)
Real estate owners and investors
Not directly — asset-level focus
Low (unless dual occupier/investor)
CDP
Voluntary
Companies disclosing to investors
Yes — Category 1 in corporate questionnaire
Medium-High (if your org participates)
SB 253
Mandatory
>$1B revenue, does business in CA
Yes — GHG Protocol Category 1
High (if threshold met)
EU CSRD
Mandatory
Large EU companies + some non-EU
Yes — ESRS E1 Scope 3
High (if European operations)
What This Means for Contractor Data Collection
If your organization is subject to SB 253, or participates in CDP, or both — you need Category 1 contractor data. The specific data points required are the same across all three frameworks because they all use GHG Protocol methodology as their basis. Building a contractor data collection process that satisfies GHG Protocol Category 1 requirements will satisfy SB 253, CDP, and CSRD simultaneously.
The Restoration Carbon Protocol is designed to produce exactly that data. Its output — the per-job RCP Carbon Report — maps to Category 1 inputs for all three frameworks. FM teams that implement RCP-compliant vendor requirements do not need to build separate data collection processes for each framework.
If my company participates in GRESB, do I still need to collect contractor Scope 3 data?
GRESB’s current framework focuses on asset-level energy and water performance rather than supply chain Scope 3 data. However, if your organization also participates in CDP or is subject to SB 253 or CSRD, those frameworks require contractor Category 1 data regardless of GRESB participation. Check which frameworks your sustainability team is reporting to.
Can I use one dataset to satisfy multiple frameworks?
Yes. Because GRESB, CDP, SB 253, and CSRD all use GHG Protocol methodology as their technical basis, data collected to satisfy one framework’s Scope 3 Category 1 requirements is compatible with the others. Build the data collection process once; use it across all frameworks your organization reports to.