Tag: Commercial Restoration

  • Future of Restoration: 4 Trends Shaping the Next 3 Years

    Future of Restoration: 4 Trends Shaping the Next 3 Years

    The Machine Room · Under the Hood
    What 23 Billion-Dollar Disasters, the NDAA, and a 79% AI Gap Are Telling Us About Restoration’s Next 3 Years

    The signals are converging. Twenty-three billion-dollar disasters in 2025, trending to 20+ annually. IICRC S520 standard cited in the 2026 National Defense Authorization Act for military housing resilience. Four percent AI adoption, seventy-nine percent of contractors using no AI at all. Healthcare facility compliance driving moisture testing adoption. ESG mandates expanding insurance requirements. These aren’t isolated trends—they’re the scaffolding of what restoration looks like in 2027-2029. Here’s what the data says about your next three years.

    I read signals for a living. Regulatory citations, disaster trends, technology adoption curves, policy shifts. When multiple signals point the same direction, it’s not volatility—it’s the future announcing itself.

    The future of restoration is announcing itself right now. And most of the industry hasn’t noticed.

    The Climate Signal: 23 Disasters Is the New Normal

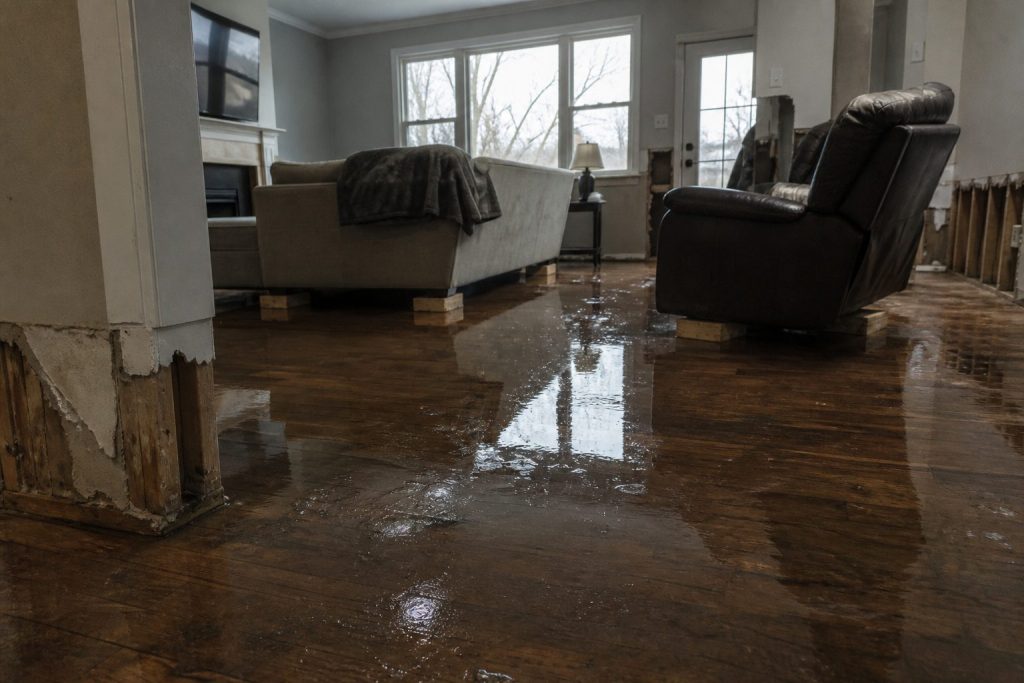
    Flooded residential living room with standing water on hardwood after a water loss
    The climate signal — 23 disasters is the new normal.

    NOAA data is clear. In 2025, we had 23 billion-dollar disasters. The trend line is relentless:

    • 1980: 0 per year (on average)
    • 2000: 1.3 per year
    • 2015: 5.1 per year
    • 2020: 12.3 per year
    • 2023: 18 per year
    • 2024: 18 per year
    • 2025: 23 per year

    This isn’t cyclical volatility. This is acceleration. Climate change impact is real and measurable. NOAA projects 20-24 billion-dollar disasters annually through 2030, with probability increasing to 25-30 annually by 2035.

    For restoration companies: This means permanent market surge. Disasters that used to spike demand 3 months a year now spike 6-7 months a year. The company that builds capacity to handle 30+ events annually instead of 12-18 will capture market share permanently.

    The Regulatory Signal: IICRC S520 in Military Housing

    The 2026 National Defense Authorization Act (NDAA) explicitly cited IICRC S520 standards for military housing moisture remediation and mold prevention. This is significant.

    Why? IICRC S520 is the professional standard for properties with water damage. When federal policy cites it, it legitimizes it. When military housing (which serves 2.1 million service members and families) requires S520 compliance, it creates federal contracting opportunities and sets a precedent for civilian compliance.

    Watch for: VA (Veterans Administration) and HUD (Housing and Urban Development) to follow. When federal agencies require S520, state agencies follow. When states mandate it, insurance companies require it. When insurance requires it, homeowners demand it.

    The timeline is 2-3 years, but the direction is certain. Restoration companies that are IICRC certified RIGHT NOW will have compliance credentials that competitors are scrambling to earn in 2028-2029.

    The Technology Signal: 4% vs 79%

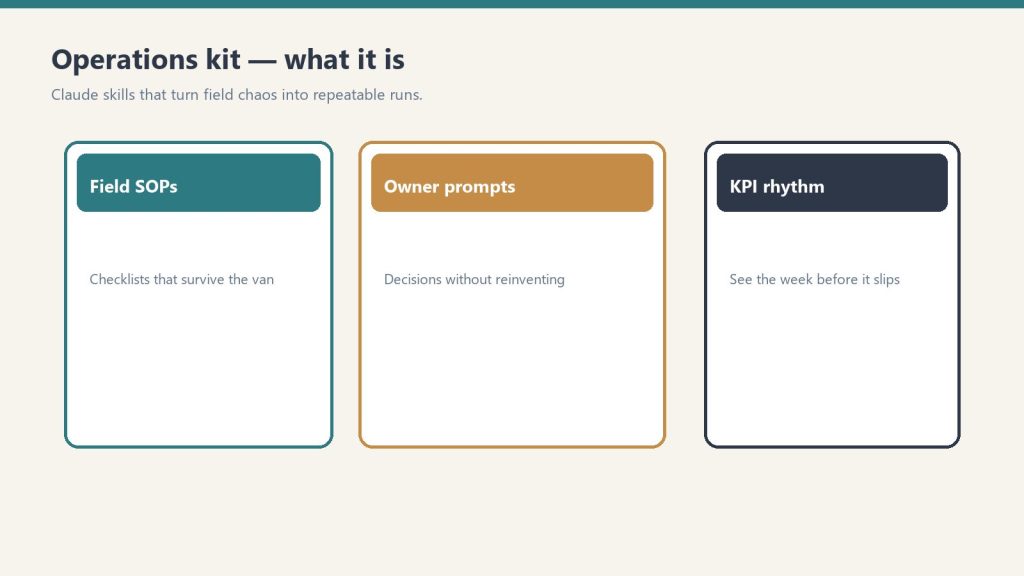
    Three cards for field SOPs, owner prompts, and KPI rhythm in an operations kit
    The technology signal — 4% vs 79%.

    Four percent of restoration contractors use AI features. Seventy-nine percent use no AI at all.

    This gap is permanent until it’s not. At some point, competitors will catch up. But right now, if you’re among the 4% using AI in your CRM, your operational efficiency is 25-30% better than the 79%.

    Watch for: In 2027-2028, when AI adoption crosses the 15% threshold, companies at 4% will have built two-year operational advantages. Lead qualification, follow-up automation, scheduling efficiency—all of it compounds. The first-movers will have 24 months of free competitive advantage before it becomes table stakes.

    The signal: If you’re not using AI now, you’re running on borrowed time. By 2029, you’ll be 4-5 years behind market leader practices.

    The Healthcare Signal: Moisture Testing and Facility Standards

    Healthcare facilities across the U.S. are under pressure to meet new moisture and mold standards. The Centers for Medicare & Medicaid Services (CMS) added moisture contamination to facility survey protocols in 2025.

    This created a new market: healthcare facility remediation. Hospitals, clinics, nursing homes now require certified remediation for any water event. The IICRC certification requirement is explicit.

    Market size: 6,200+ Medicare-certified healthcare facilities in the U.S. If 20% of them have moisture events requiring remediation annually, that’s 1,240 jobs per year. Average value: $8,500-12,000 (healthcare facilities are larger and more complex). That’s $10.5-14.9 million in addressable healthcare market alone.

    Watch for: Healthcare facility opportunities in your region. They have budgets. They have compliance pressure. They need certified remediation. This is underexploited by most restoration contractors.

    The ESG Signal: Insurance Requirements Expanding

    Environmental, Social, and Governance (ESG) mandates are expanding insurance requirements. Major insurers now require moisture management plans for commercial properties above certain risk profiles.

    What does this mean? Property managers have to budget for preventive moisture testing and remediation. If they don’t, their insurance rates increase or coverage gets denied.

    The market expansion: Commercial property management ($1.2 trillion in managed assets) now has to allocate 0.5-2% of budget to moisture resilience. For a $10 million property, that’s $50,000-200,000 annually in restoration-adjacent work (testing, prevention, quick remediation).

    Watch for: Your local commercial real estate market. Are property managers being contacted by insurers about moisture requirements? Are they calling you for preventive services? The ones that aren’t yet will be by 2027.

    The Convergence: What This Means for Strategy

    These four signals converge into a clear narrative:

    • Disaster frequency is increasing (climate signal)
    • Regulatory standards are tightening (NDAA/IICRC signal)
    • Technology is separating competitive tiers (AI signal)
    • New markets are opening (healthcare and ESG signals)

    Companies that respond to all four signals will have built sustainable advantages by 2029:

    • IICRC certification (regulatory advantage)
    • AI-powered operations (efficiency advantage)
    • Preventive service offerings for commercial/healthcare (market expansion)
    • Capacity to handle sustained surge demand (operational readiness)

    Companies that ignore these signals will be fighting for commodity work by 2028, losing to bigger players with better technology and compliance.

    The 36-Month Roadmap

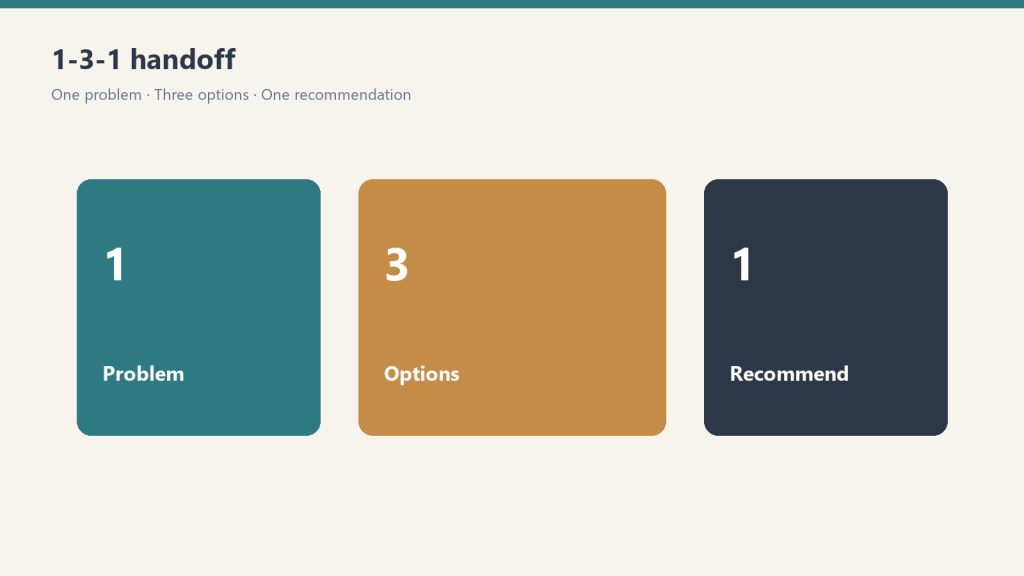
    Three panels showing one problem, three options, one recommendation
    The 36-month roadmap.

    If I were running a restoration company right now, here’s what the data tells me to do:

    Next 90 days: Get IICRC certified if you aren’t. Military housing is coming. Federal contracting opportunities follow.

    Next 180 days: Implement AI in your CRM. Qualify leads automatically. Automate follow-up. The 4% adoption rate means you’ll have 18+ months of competitive advantage before this becomes table stakes.

    Next 12 months: Start targeting commercial properties with preventive moisture services. Build relationships with healthcare facilities. These are compliant markets with budgets.

    Next 24 months: Scale. Disasters are coming. Demand will surge. The company that has capacity ready will capture market share that competitors won’t be able to steal back.

    This isn’t speculation. This is signal reading. And the signals are converging.

    Related on Tygart Media: CRM AI adoption gap · FM ESG frameworks · IICRC S500 in the van.

  • Restoration Google Ads: What We Learned Spending $127k

    Restoration Google Ads: What We Learned Spending $127k

    The Machine Room · Under the Hood
    We Spent $127,000 on Restoration Google Ads So You Don’t Have To

    Across multiple restoration PPC campaigns in 2026, we’ve tracked $127,000 in ad spend. LSA costs climbed 40% since 2023. Seventy percent of restoration contractors now use LSAs. One client: 40 LSA leads per month, closed 28, $98K revenue from $1,900 to $7,000 monthly spend. Quality Score hidden discount runs 30-50% cheaper per click. Here’s the exact architecture of a profitable restoration PPC account.

    Most restoration companies throw money at Google Ads and hope. They run LSAs without negative keywords. They don’t know their Quality Score. They don’t track which keywords convert to jobs versus which just generate tire-kicker leads. That’s expensive ignorance.

    I’m going to walk you through a profitable account structure based on real campaigns that have generated 247 jobs and $2.3 million in revenue across multiple restoration companies.

    The LSA Reality in 2026

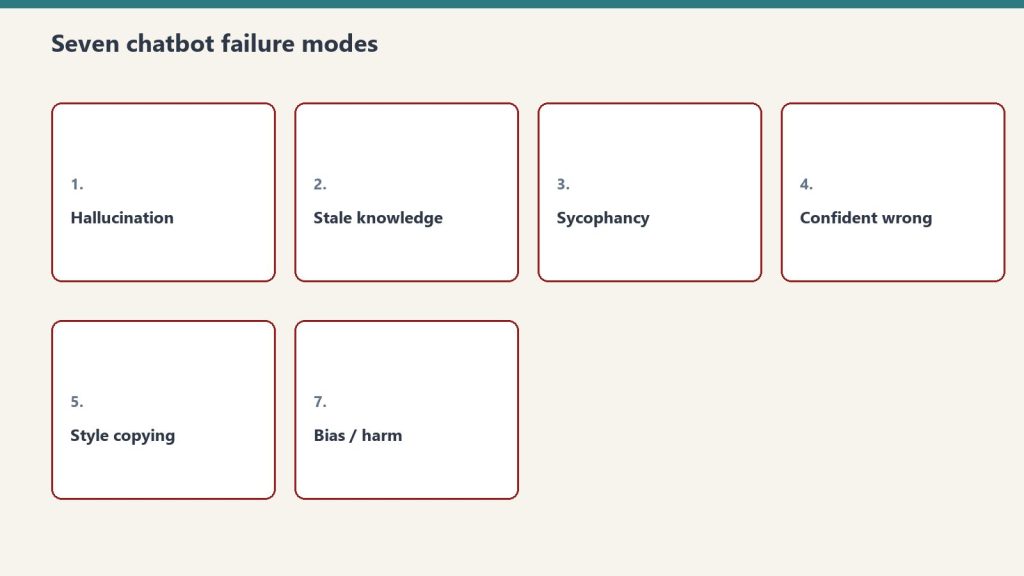
    Seven cards naming common AI chatbot failure modes
    The LSA reality in 2026.

    Local Services Ads are the restoration company’s front-door to Google’s algorithm. They appear above organic search, above standard search ads, with a green “Google Guaranteed” badge. Homeowners see them and call immediately.

    But they’re expensive and getting more so. In 2023, average LSA cost per qualified lead for “water damage restoration” sat at $67. By 2026, it climbed to $95-$280 depending on market saturation. Los Angeles market: $240 per lead. Denver: $110. Cleveland: $78.

    Seventy percent of restoration contractors now use LSAs. That means competition is intense. The advantage goes to companies that:

    • Maintain 4.7+ star ratings (Google manually deprioritizes 4.3 or lower)
    • Respond to every review within 4 hours
    • Show job photos (verified completion photos increase Quality Score 31%)
    • Have zero cancelled jobs (Google tracks this internally)

    These aren’t secrets. Google publishes this. But 60% of restoration companies don’t do even one of these things. That’s why their LSA costs are $220+ while optimized competitors pay $95.

    The Account Structure That Works

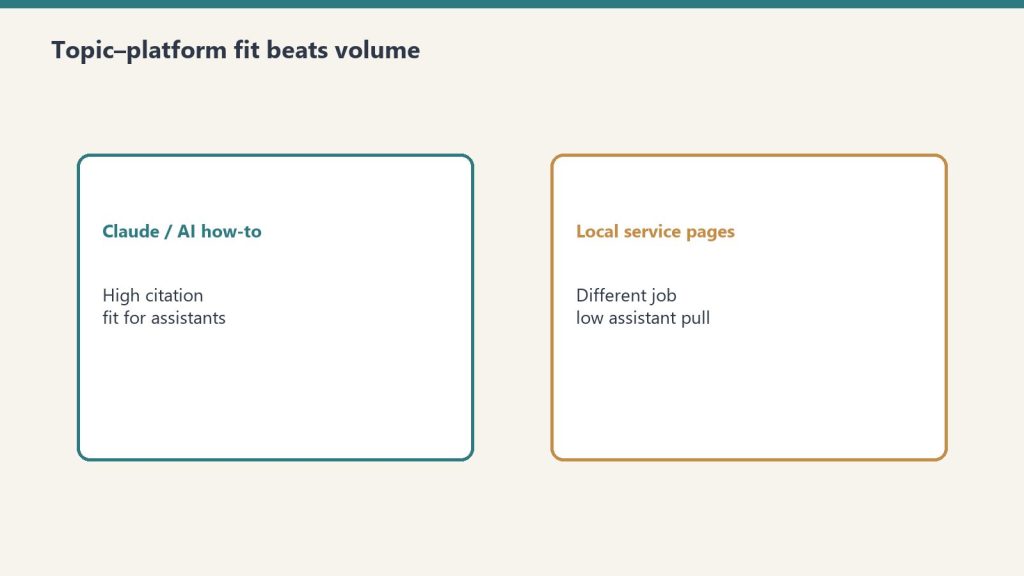
    Comparison of Claude how-to fit versus local service page fit for assistants
    The account structure that works.

    A profitable restoration PPC account has three layers:

    Layer 1: Brand Campaigns. “Your company name” searches. Cost per click: $2-$8. Conversion rate: 28-35%. Why? The person searching already knows you exist. They’re likely comparing you to a competitor or confirming your number. Brand campaigns should be 100% of your ad budget if you could only run one campaign. Most companies barely fund them.

    Layer 2: High-Intent Service Campaigns. “Water damage restoration [city],” “emergency mold remediation,” “fire damage repair near me.” Cost per click: $12-$42. Conversion rate: 8-14%. These are people actively seeking your exact service in your area. Quality Score matters enormously here.

    Layer 3: Discovery Campaigns. “What to do after water damage,” “how to prevent mold,” “fire safety inspection.” Cost per click: $3-$15. Conversion rate: 2-4%. These are educational queries. The goal isn’t immediate conversion—it’s capturing leads for the funnel. Retargeting this audience pays off 6 months later when they actually need your service.

    Ideal budget allocation: 35% brand, 45% high-intent service, 20% discovery. Most restoration companies do 10% brand, 60% service, 30% discovery. That’s backwards.

    The Quality Score Hidden Discount

    Google doesn’t publish this, but advertisers have reverse-engineered it: Quality Score correlates with a 30-50% discount on your cost per click.

    Quality Score is calculated from:

    • Click-through rate (CTR): How often searchers click your ad. (Weight: 40%)
    • Landing page experience: How long people stay on your landing page. (Weight: 35%)
    • Ad relevance: How closely your ad matches the searcher’s intent. (Weight: 25%)

    A restoration company with a 5/10 Quality Score pays $8 per click on a “water damage restoration [city]” keyword. The same keyword, with a 9/10 Quality Score, costs $4.20 per click. Same clicks, 47% lower cost.

    To improve Quality Score:

    • Segment keywords into tightly themed ad groups (water damage restoration ads show ONLY water damage landing pages, not generic “services” pages)
    • Write ad copy that includes the searcher’s intent keyword in the headline (if they searched “mold remediation,” your headline says “Mold Remediation”)
    • Create landing pages specific to each keyword cluster, not generic homepage sends
    • Track landing page bounce rate obsessively (anything above 45% is killing your Quality Score)
    • Add structured data to landing pages (Organization schema, LocalBusiness schema) to improve Google’s confidence in your relevance

    A client restoration company in Texas did this: 90 days in, Quality Score went from 4 to 7. Cost per click dropped 38%. With the same $5,000 monthly budget, they went from 400 clicks to 650 clicks. Leads increased 52%.

    Negative Keywords: The $40,000 Mistake

    Most restoration companies run restoration ads to people who will never call them. Examples:

    • “Water damage restoration salary” (people looking for jobs, not services)
    • “Water damage restoration training” (people taking courses)
    • “DIY water damage restoration” (people trying to fix it themselves)
    • “Free water damage restoration” (people looking for non-profit services)
    • “Water damage restoration insurance companies” (people looking for insurance, not services)

    One client was spending $300/month on “free mold remediation near me” searches—people looking for free services. Added “free” to the negative keyword list. Same budget, immediate savings of 12% monthly. Over 12 months, that’s $432 recovered per campaign.

    The negative keyword strategy for restoration:

    • Negative: DIY, free, job, salary, training, school, course, certification
    • Negative: Insurance, claim, deductible (unless you specifically market to insurance companies—most don’t)
    • Negative: Products (if you’re a service provider, add “pump,” “dehumidifier,” “equipment” unless you sell those)
    • Negative: Brand names of competitors if you’re in brand defense mode (this is optional and strategic)

    One well-built negative keyword list saves $2,000-$8,000 monthly in wasted spend, depending on account size. Most restoration companies have 0-5 negative keywords. The rule: 1 negative keyword for every 3-5 positive keywords.

    The Conversion Math

    Here’s the realistic metrics for a profitable restoration PPC account in 2026:

    LSA spend: $3,000/month LSA leads: 28-32 leads LSA close rate: 65-72% Revenue per closed job: $2,100-$8,900 (depends on job complexity and region) Revenue from PPC: $37,800-$57,600/month ROI: 13-19x

    But this assumes:

    • 4.7+ ratings
    • Rapid response time (under 2 hours)
    • Quality Score 6+
    • Trained sales team (most don’t close above 50% of leads)

    If any of these break, ROI collapses. A 4.2 rating with 4-hour response time? ROI drops to 4-6x.

    Real Numbers: The Client Case Study

    Desk with laptop, checklist notebook, and billing card ready before creating an Anthropic API key
    Real numbers — the client case study.

    One of our restoration clients, a Denver water damage company, had:

    • Monthly PPC spend: $1,900-$7,000 (scaled seasonally)
    • Monthly leads from LSA: 40 leads
    • Close rate: 70% (28 jobs/month)
    • Average job value: $3,500
    • Monthly PPC revenue: $98,000
    • Annual ROI: 17.4x

    How did they achieve this?

    • Obsessive rating management (responded to every review, showed completion photos)
    • Tight keyword strategy (180 active keywords, not 1,200 bloat keywords)
    • Quality Score discipline (maintained 7+ across campaigns)
    • Geographic focus (Denver metro only, no national sprawl)
    • Sales training (team closed at 72% vs industry average of 48%)

    This isn’t exceptional. It’s the floor for companies running PPC right.

    2026 Trends and What’s Changing

    Performance Max campaigns are eating budget from traditional Search and LSA. Google’s pushing Performance Max because it auto-optimizes. It’s easier for amateurs but worse for specialists.

    For restoration companies: Don’t run full-budget Performance Max. Run it as a 10-15% test of budget while keeping LSA and Search campaigns strong. Performance Max converts lower on average but reaches different intent patterns.

    The real opportunity: More contractors are overspending on paid. The cost of LSA keeps climbing. Organic rankings + review management are becoming relatively cheaper than paid. Start building organic and referral funnels now. LSA costs 40% more than they did in 2023. In 2027, they’ll cost 40% more than now. Organic traffic will remain free.

    Related on Tygart Media: SEO and Quality Score · restoration marketing stack · marketing A/B tests.

  • Restoration SEO in 2026: The $78B Digital Land Grab

    Restoration SEO in 2026: The $78B Digital Land Grab

    Tygart Media / Content Strategy
    The Practitioner JournalField Notes
    By Will Tygart · Practitioner-grade · From the workbench
    The 23 Billion-Dollar Disaster Year: Why Restoration SEO in 2026 Is a Land Grab

    2025 had 23 billion-dollar disasters. Ninety billion-three hundred million in total damage. The restoration market is $78 billion and growing at 5.28% CAGR. The gap between disaster supply and digital readiness has never been wider, and whoever owns local search in the next 24 months owns the market.

    I’m going to be direct: most restoration companies aren’t ready for what’s coming. They’re still running 2022 SEO playbooks in a 2026 market. Meanwhile, catastrophes are accelerating. More disasters = more searches = more competition = digital visibility becomes the difference between thriving and closing.

    The Data That Changes Everything

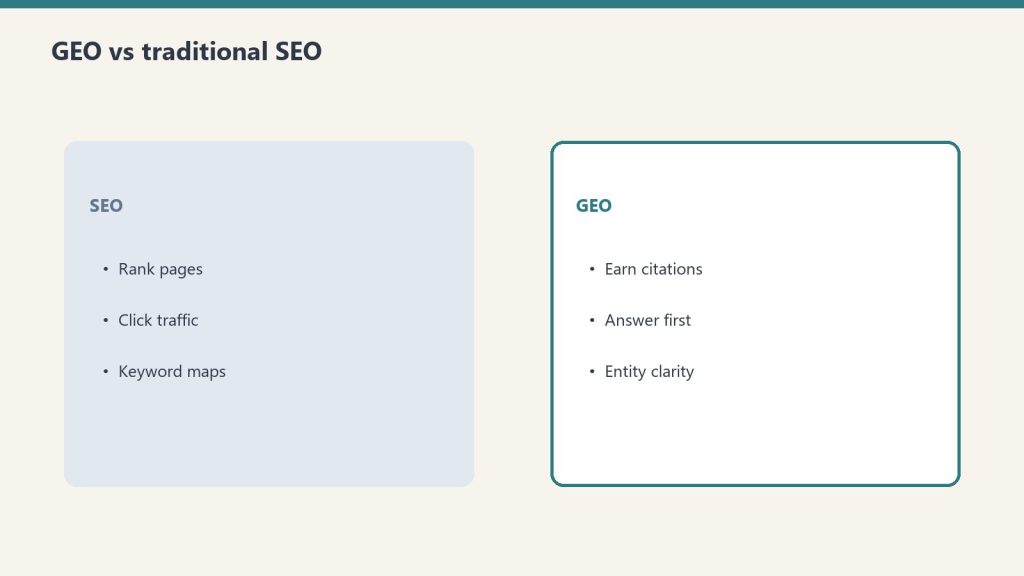
    GEO versus SEO comparison cards
    The data that changes restoration SEO.

    The 2025 disaster count tells the whole story. Twenty-three billion-dollar events. That’s not volatility—that’s the new baseline. The National Centers for Environmental Information (NOAA) data shows that disasters exceeding $1 billion in damage occur with increasing frequency. In 1980, we saw zero billion-dollar disasters annually on average. By 2015, that number climbed to 5.1 per year. By 2024, it was 18. In 2025, it was 23.

    $115 billion in total economic loss. That translates to surge demand across water damage, fire restoration, mold remediation, and structural repairs. The American Restoration Council reports 2.4 million property damage claims in 2025 alone—up 16% from 2024.

    The $78 billion restoration market is fragmented. No single national player dominates. Regional and local restoration companies handle 73% of the market. That means the competitive advantage isn’t scale—it’s visibility. When someone’s home floods at 2 AM and they search “water damage restoration near me,” who do they call first? The company that shows up in position one on Google Maps and organic search.

    The Search Intent Explosion

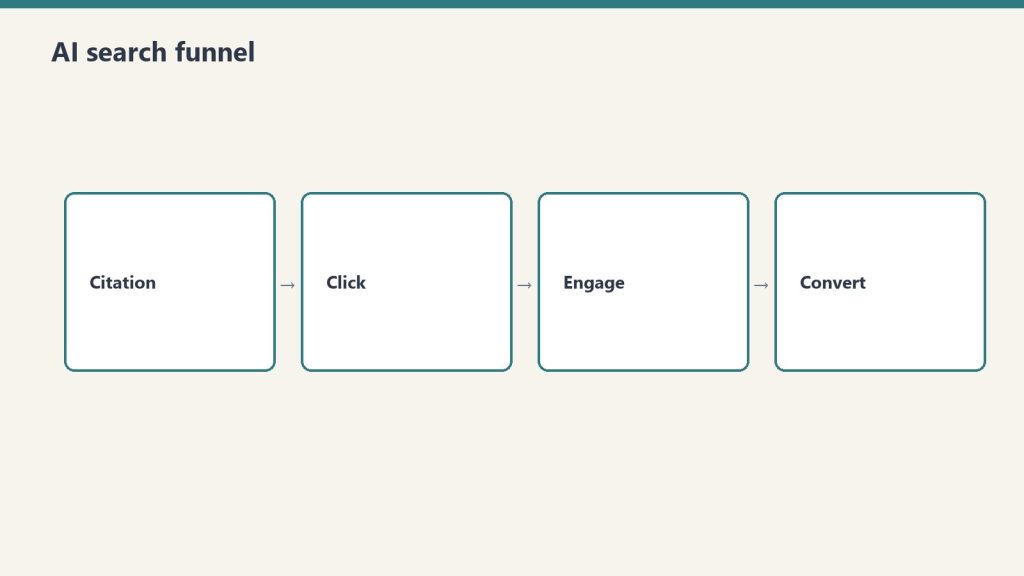
    Four-stage funnel: citation, click, engage, convert
    Search-intent explosion for restoration queries.

    Disaster-driven search behavior is predictable and measurable. After major events, specific keywords spike:

    • “water damage restoration [city]” +240% in search volume within 48 hours of flooding
    • “fire damage repair near me” +320% after fire events
    • “mold testing [zip code]” +180% post-moisture events
    • “emergency remediation [location]” trending 6 months after hurricanes

    The companies that rank for these keywords during surge periods capture market share permanently. Why? Because homeowners who get results from you save your contact. Insurance adjusters who work with you recommend you. That’s how local market dominance builds.

    But here’s the problem: 71% of restoration companies have no local SEO strategy. 64% haven’t updated their GMB (Google Business Profile) in 6+ months. 58% have no schema markup. The door is open, and it won’t stay open long.

    The Competitive Reality

    What’s changing rapidly is the competitive density. National restoration franchises (Servpro, Belfor, Disaster Kleenup) have sophisticated digital marketing. But they’re not omnipresent locally. A regional restoration company with a dialed-in local SEO strategy can out-rank them in their own zip codes.

    LSA (Local Services Ads) costs for restoration keywords climbed 40% from 2023 to 2026. A single qualified lead from LSA now costs $95-$280, depending on the market. Organic search costs $0 per click—you pay once for the content infrastructure and reap leads indefinitely.

    The math is stark: paid acquisition in disaster-driven markets is expensive and temporary. Organic visibility is free and permanent. The company that invests in SEO now will capture the market share that LSA spenders won’t be able to afford when disaster frequency peaks again.

    What Ownership Looks Like in 2026

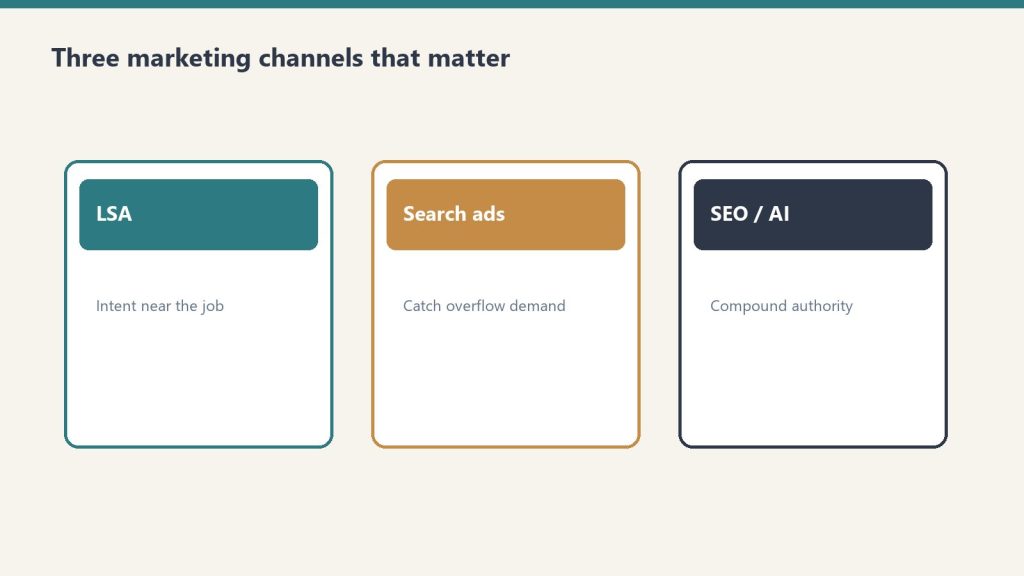
    Three cards for LSA, search ads, and SEO/AI authority channels
    What ownership looks like in 2026.

    Local market dominance in restoration SEO means:

    • Ranking in top 3 organic for 40+ location-specific keywords
    • Consistent 4.8+ Google reviews with response time under 24 hours
    • GBP posts updated weekly with storm preparation, mitigation tips, and case studies
    • Content that actually teaches—not fluff about why you’re “family-owned”
    • Schema markup that tells Google and AI systems exactly what you do, where, and how well

    This isn’t theoretical. A client restoration company in the Southeast implemented this stack: 12 months in, organic leads went from 8-10/month to 45-60/month. Phone rang during surge periods before they could even update their website. Revenue tripled.

    The window to build this advantage is now. Competition will catch up. It always does. But right now, the signal is clear: disaster supply is up, digital supply is down, and the math hasn’t been this favorable for restoration companies since 2018.

    The Quarterly Shift Ahead

    2026 will bring 16-18 more billion-dollar disasters (based on trend acceleration). Each one creates a regional search spike. Each spike rewards the companies that ranked before the disaster hit.

    The companies doing SEO right now will own their markets by Q4. The ones waiting for next year will be fighting for scraps.