Last verified: June 1, 2026. Crime figures change constantly and the numbers below are drawn from official annual reports with their year stated; for current, real-time counts always check the official sources linked throughout this page rather than treating any figure here as today’s tally.
If you live, work, or own property in Tacoma, “is crime going up or down?” is rarely a simple question. The honest answer depends on which year you’re measuring, which neighborhood you’re standing in, and whose report you’re reading. This desk pulls the authoritative threads together: the official Tacoma Police crime dashboard, the state’s annual Crime in Washington report, the FBI’s national data, and the anonymous tip channel run by Crime Stoppers of Tacoma/Pierce County. Use it as your starting point, then click through to the live data when you need a number that’s current to the day.
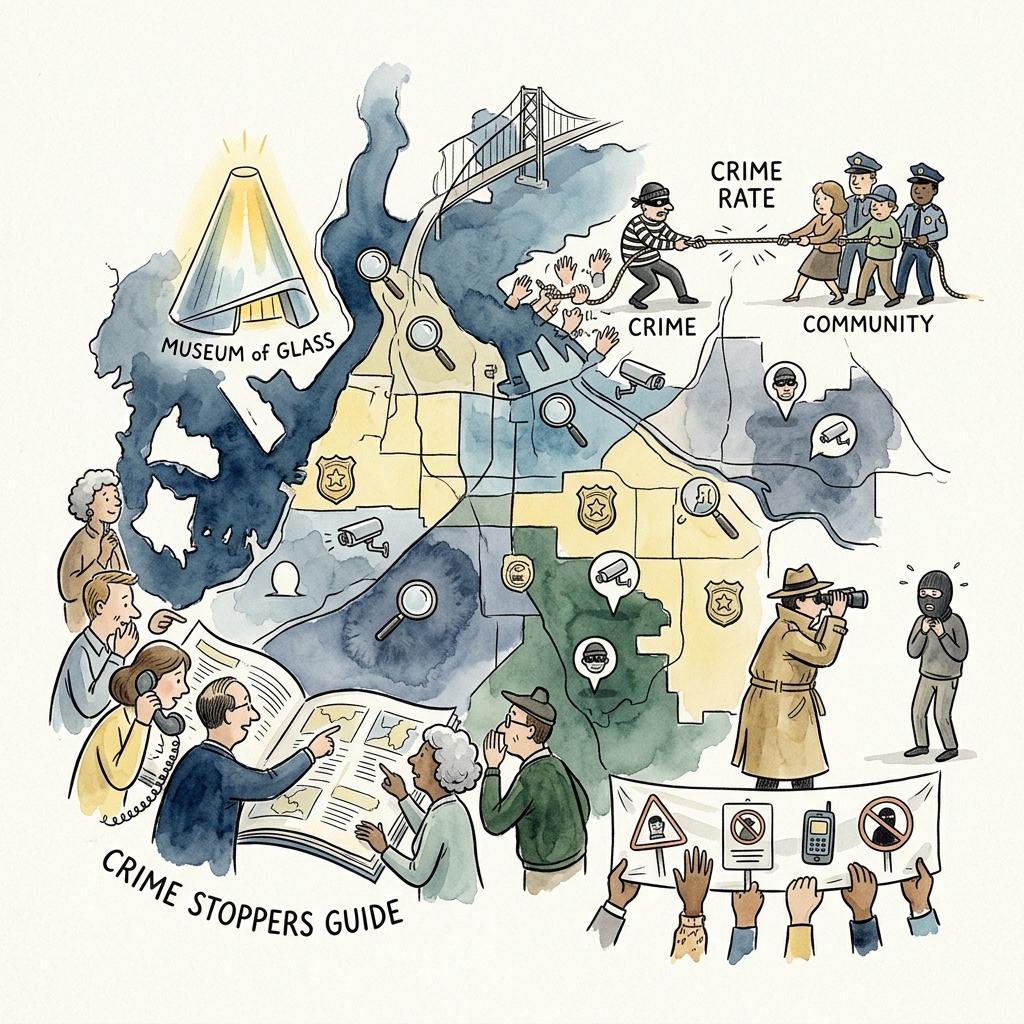
Tacoma crime data at a glance
- Official interactive crime map: The Tacoma Police Crime Dashboard lets you filter reported incidents by crime type, council district, and police sector — this is the live source, so check it directly for current counts.
- Latest homicide count: Tacoma recorded 22 homicides in 2024, down from 27 the prior year, per data summarized from the Tacoma Police Department and FBI reporting (FBI UCR).
- Violent-crime trend: The City reported a 13.2% drop in violent street-crime incidents in the second half of 2024 versus the same period in 2023, with violence-related calls for service down 23.6% citywide (Tacoma Police Department).
- Statewide context: Washington logged 480,875 offenses in 2024 with statewide murders falling about 18% year over year, per the WASPC Crime in Washington annual report.
- Report a crime anonymously: Call Crime Stoppers of Tacoma/Pierce County at 1-800-222-TIPS (800-222-8477), 24/7, for tips that may earn a cash reward (tpcrimestoppers.com).
What the Tacoma crime rate actually tells you
Tacoma carries a higher crime rate than the U.S. average — that has been true for years and tends to drive the headline “Tacoma crime rate” searches. But a single rate number flattens a more useful story. The Tacoma Police Department’s own reporting showed measurable improvement through 2024: violent street-crime incidents fell 13.2% in the back half of the year compared with the same stretch in 2023, and homicides dropped from 27 to 22.
Why the gap between “high rate” and “falling crime”? Crime rates are calculated per 1,000 residents over a full year, so they lag and they smooth. A neighborhood can feel safer month-to-month while the annual rate still reads high relative to the national baseline. The practical move is to read the direction (trend) and the local cut (your sector) rather than the citywide headline. The official crime dashboard is built exactly for that — it segments reported crime by police sector and council district so you can see your slice of the city rather than the average.
One staffing note that shapes everything downstream: in 2024 Tacoma Police fielded roughly 389 full-time law-enforcement employees, about 343 of them sworn officers. Washington consistently ranks at or near the bottom nationally for officers per capita, which is part of why calls-for-service trends and response context matter as much as raw incident counts.
The official Tacoma crime map and dashboard
For anything time-sensitive, the City of Tacoma’s open-data crime dashboard is the source of record. It’s the tool searchers mean when they look for the “Tacoma crime map.” It lets you:
- Filter reported incidents by crime type (e.g., burglary, motor-vehicle theft, assault).
- Narrow by geography — council district and police sector — to isolate your neighborhood.
- View time-range trends to see whether a category is rising or falling.
The same dataset is mirrored on the City’s Tacoma Open Data portal, which is the better entry point if you want to download raw records or build your own analysis. Because these dashboards reflect reported incidents and update continuously, treat them as the live layer: I deliberately don’t quote a “current” incident count on this page, because by the time you read it the dashboard will already be ahead. Click through for the number that’s true today.
Where the annual statistics come from
Three official sources feed almost every credible Tacoma crime statistic, and knowing which is which keeps you from comparing apples to oranges:
- WASPC — Crime in Washington: The Washington Association of Sheriffs and Police Chiefs compiles the statewide annual report from agency submissions. It’s the authoritative county- and city-level Washington dataset and the right place for Pierce County context. The 2024 edition reported 480,875 statewide offenses and an 18% statewide drop in murders. Find current and past editions on the WASPC CJIS statistics page.
- FBI UCR / NIBRS: The FBI aggregates agency data nationally, which is what lets you compare Tacoma against other U.S. cities. Note that FBI figures typically publish on a lag — the 2024 national data was released in late 2025 (FBI UCR).
- City of Tacoma open data: The most granular and most current layer, but Tacoma-only. Use it for neighborhood detail; use WASPC and FBI for comparisons.
For broader criminal-justice context across the county — jail bookings, case filings, and related measures — Pierce County publishes its own Criminal Justice Data stories on its open-data platform.
Crime Stoppers and how to report tips
Crime Stoppers of Tacoma/Pierce County, hosted in partnership with the Tacoma Police Department, runs the region’s anonymous tip program. If you have information on an unsolved crime or recognize someone on a most-wanted bulletin, you don’t have to give your name:
- Phone: Call 1-800-222-TIPS (800-222-8477), staffed 24 hours a day, 7 days a week.
- App: Submit through the P3 Tips app, a secure anonymous channel available on the App Store and Google Play.
- Web: File a tip at tpcrimestoppers.com/leave-a-tip.
Tips that lead to an arrest and charges can qualify for a cash reward. When you call, you’re given a unique tip number — keep it, because that number (not your identity) is how you later claim any reward. Most-wanted bulletins and reward eligibility change frequently, so check the Crime Stoppers site for the current lineup. For an emergency or a crime in progress, always call 911 instead.
Frequently asked questions
What is the Tacoma crime rate right now?
Tacoma’s crime rate runs above the national average, though the most recent full-year reporting (2024) showed violent crime falling — homicides dropped from 27 to 22, and violent street-crime incidents fell 13.2% in the second half of the year. For a current, neighborhood-level read, use the Tacoma Police Crime Dashboard rather than any single rate figure.
Where is the official Tacoma crime map?
The official interactive map is the Tacoma Police Crime Dashboard on the City’s open-data site, also available through the Tacoma Open Data portal. It lets you filter reported incidents by crime type, council district, and police sector.
How do I report a crime anonymously in Tacoma?
Call Crime Stoppers of Tacoma/Pierce County at 1-800-222-TIPS (800-222-8477), available 24/7, use the P3 Tips app, or submit online at tpcrimestoppers.com. Qualifying tips can earn a cash reward. For emergencies, call 911.
Where do Tacoma crime statistics come from?
Annual statistics come from three official sources: the WASPC Crime in Washington report (statewide and county detail), the FBI UCR/NIBRS program (national comparisons), and the City of Tacoma’s open-data dashboard (most granular and most current, Tacoma-only).
Is crime in Tacoma going up or down?
By the most recent full-year reporting (2024), key violent-crime measures were down: homicides fell to 22 from 27, and the Tacoma Police Department reported a 13.2% reduction in violent street-crime incidents in the second half of 2024 versus 2023. Statewide, Washington murders fell about 18% in 2024 per WASPC. Check the live dashboard for the latest trend in your area.
Leave a Reply