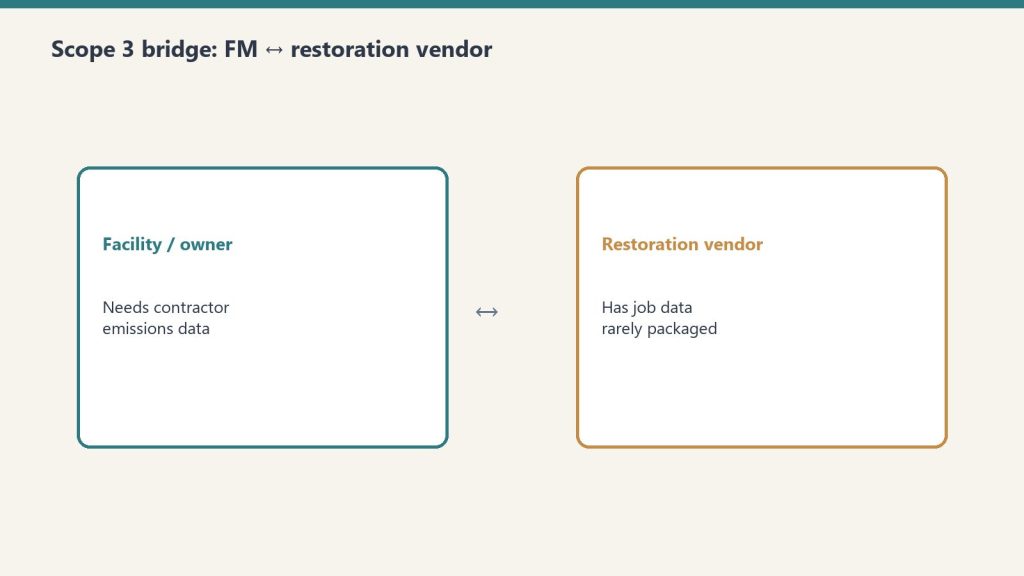
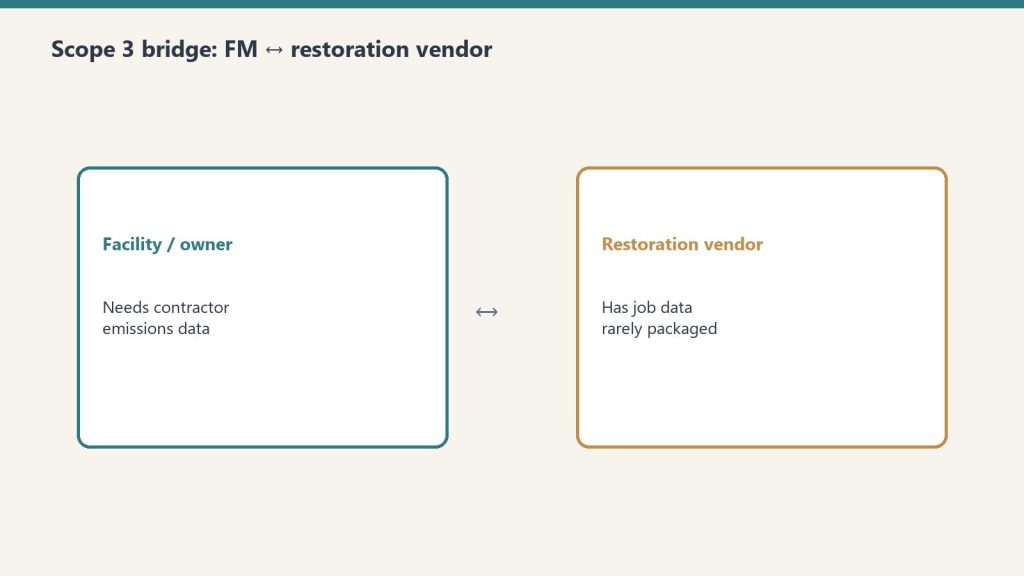
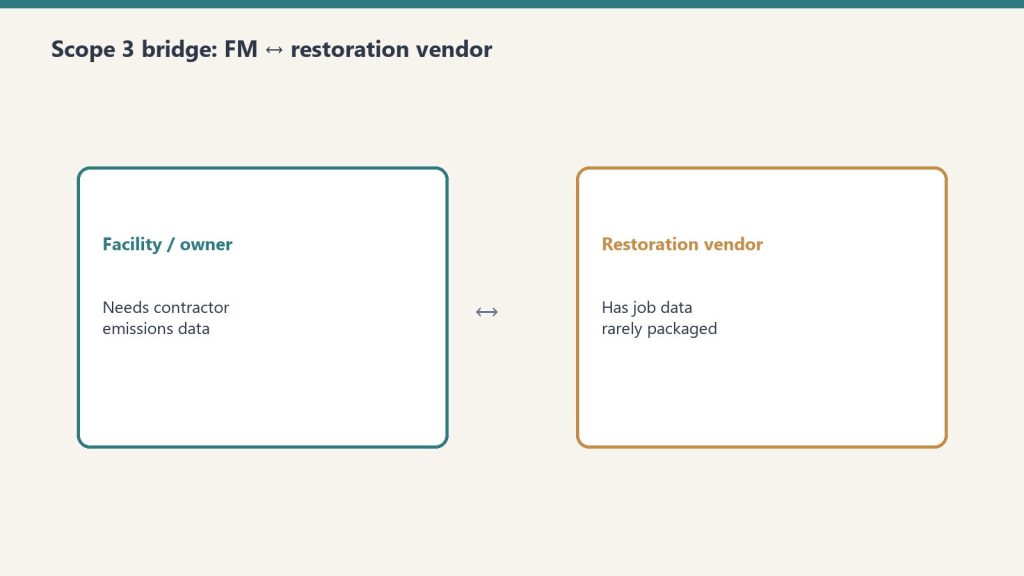
Scope 3 compliance for facility managers is fundamentally a vendor management problem. You cannot calculate your Category 1 emissions without data from your contractors, and you cannot get data from contractors without a systematic process for requesting, receiving, and storing it. This article provides a practical checklist for building that process — one that works for FM teams of any size and scales as your contractor pool grows.
Free Interactive Workbook
Use the live Scope 3 contractor compliance workbook
Map contractor categories, tier vendors, generate the contract clause, and export a program summary. Five phases. Live scoring. Work email unlocks the clause.
Before you can build a Scope 3 data collection process, you need to know which contractors generate material emissions on your behalf. Not all vendors are equal Scope 3 risks — prioritize based on emission intensity and spend.
Step 1: Map your contractor categories
List every category of contractor your FM program engages. For most corporate FM teams, the highest emission-intensity contractor categories are:
Construction and tenant improvements — embodied carbon in materials, significant waste
HVAC maintenance and retrofits — refrigerant handling, combustion equipment
Grounds and landscaping — fuel-burning equipment, fertilizer (N₂O emissions)
Janitorial and facility services — lower intensity but high volume
Step 2: Score by emission intensity × annual spend
Multiply each category’s estimated emission intensity (high/medium/low) by your annual spend in that category. The highest-scoring categories are your priority Scope 3 data gaps. Emergency restoration typically scores high on intensity even when annual spend is variable, because a single large water damage event can generate a meaningful emissions figure.
Phase 2: Vendor Qualification Updates
Step 3: Add Scope 3 capability questions to RFP and vendor qualification forms
For new vendor solicitations, add the following questions to your qualification criteria:
Does your organization track greenhouse gas emissions associated with individual project work?
Are you familiar with GHG Protocol Scope 3 Category 1 methodology?
Have you adopted the Restoration Carbon Protocol (for restoration vendors)?
Can you provide a per-project emissions summary upon project completion?
What job management system do you use, and does it support emissions data export?
Step 4: Tier your existing vendors
Survey your existing contractor pool with the same questions. Categorize vendors into three tiers: Tier 1 (already tracking emissions data), Tier 2 (willing to adopt a framework with support), and Tier 3 (unable or unwilling to provide data). Tier 3 vendors become a procurement risk factor — flag for transition to Tier 1 or 2 alternatives at contract renewal.
Phase 3: Contract Language
Step 5: Add Scope 3 data provisions to new contracts
For restoration contractors specifically, reference the Restoration Carbon Protocol as the accepted methodology standard. For other contractor categories, reference GHG Protocol Scope 3 Category 1 methodology and specify the data fields required. Include:
Obligation to provide a per-project emissions summary within 30 days of completion
Minimum data fields required (fuel, vehicle miles, waste type and weight, equipment hours)
Accepted methodology standard (RCP for restoration; GHG Protocol Category 1 for others)
Data format and delivery method (PDF report, CSV, or API-compatible format)
Right to audit contractor data collection processes during the contract term
Phase 4: Data Collection and Storage
Step 6: Establish a receiving process for contractor emissions reports
Decide where contractor emissions data will live in your FM systems. Options include: a dedicated folder in your CMMS work order system attached to each job record, a shared ESG data repository managed by your sustainability team, or a direct integration with your ESG reporting platform. The key is that every restoration job has an associated emissions record — not a separate tracking system you have to reconcile at year-end.
Step 7: Build a gap-filling protocol for missing data
Some contractors will not provide data even after you request it. Build a proxy calculation protocol for data gaps using spend-based or activity-based estimation. The RCP provides proxy tables for restoration jobs. For other categories, the GHG Protocol’s Scope 3 Calculation Guidance provides spend-based emission factors you can apply to invoice data.
Phase 5: ESG Inventory Integration
Phase 5 — ESG inventory integration.
Step 8: Integrate contractor data into your annual Scope 3 Category 1 calculation
At the end of each fiscal year, compile all contractor emissions reports and proxy estimates into your Scope 3 Category 1 input. Document your methodology, note which vendors provided primary data and which required proxy estimation, and flag any material gaps for disclosure in your ESG report. Most third-party ESG auditors will accept a documented methodology with known limitations more readily than an unexplained data gap.
The Checklist Summary
☐ Map contractor categories by emission intensity and annual spend
☐ Score and prioritize: emergency restoration at the top
☐ Add Scope 3 capability questions to vendor qualification forms
Direct answer: A restoration company is not just a service company. It is a working-capital-intensive, claims-cycle-dependent, equipment-rich, labor-leveraged business where gross margin varies from 70 percent on water mitigation to 10 percent on reconstruction, where net margin compresses as revenue grows, and where the gap between the average operator and the well-run operator is several multiples of profitability. The discipline that separates the two is not heroic effort; it is financial and operational rigor applied consistently to a small set of decisions about service mix, AR cycle, equipment leverage, crew structure, KPI hygiene, carrier-program exposure, multi-location structure, and exit posture. This pillar introduces those eight decisions and frames the cluster that explores each one in depth.
The restoration industry sits in a strange place. Industry analysts cite a market range from $7.1 billion to $80 billion in U.S. revenue, depending on how the boundary is drawn — water mitigation only, all property restoration, all property and remediation including mold and biohazard, or the full disaster-recovery economy including reconstruction and contents. The Restoration Industry Association and Restoration & Remediation Magazine have referenced the wider range publicly, and the consensus growth rate sits at 4-6 percent CAGR. Within that aggregate market, the operator-level reality is that the industry is fragmented — thousands of independent shops in the $1M to $30M range, several hundred regional operators in the $30M to $200M range, and a small set of national consolidators with revenue over $200M. The fragmentation is the opportunity. It is also the trap.
The opportunity is that no national brand has captured commodity property restoration the way ServiceMaster did in dry cleaning or Home Depot did in retail. Independent operators with discipline can build $5M to $50M businesses with strong margins and durable client relationships. The trap is that fragmentation lets bad businesses survive longer than they should. A restoration company can run for a decade with sloppy AR, undisciplined service mix, and informal operations and still pay the owner well in good years — until a CAT-event swing, a carrier-program change, or a key-employee departure exposes the underlying weakness and the business loses years of compounding to the cleanup. The well-run shop avoids this not by being smarter on the day of the event but by having installed financial and operational discipline before the event ever arrived.
This article is the pillar for the cluster that follows. The cluster covers eight specific decisions where finance and operations rigor moves the needle the most: AR aging and the Xactimate-to-cash cycle, gross margin by service line, equipment economics, crew structure and labor cost, KPI dashboards, preferred-vendor program economics, multi-location growth, and M&A and exit dynamics. This pillar walks through each at altitude so an owner-operator can see how they connect before deciding which to attack first.
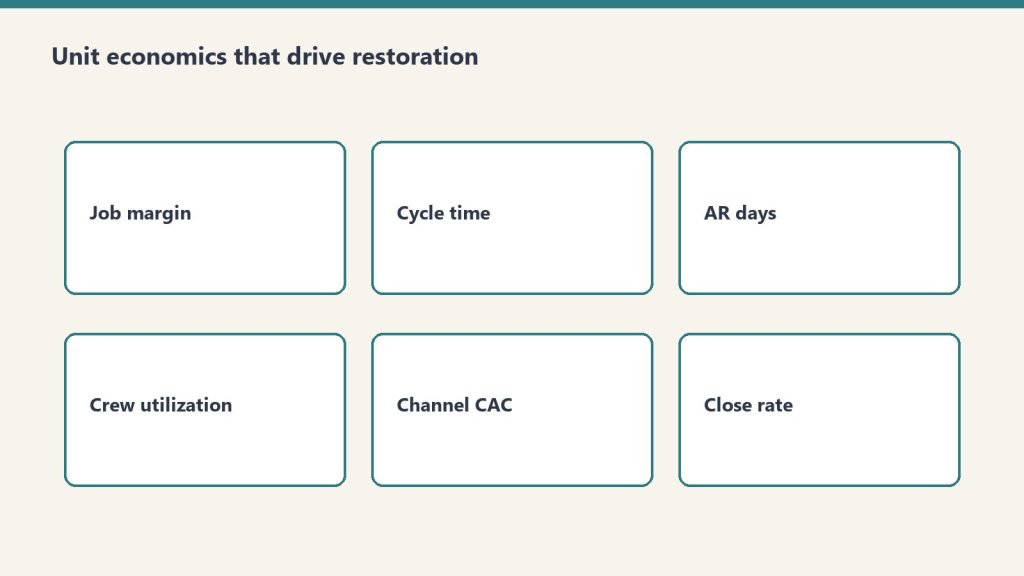
The unit economics that actually drive a restoration company
Unit economics that actually drive a restoration company.
The restoration industry’s unit economics are unusual in three specific ways that operators frequently miss until they are scaling and the math stops working.
Service-line gross margin is wildly different by line. Water mitigation typically runs 70-80 percent gross margin because equipment does most of the work — air movers and dehumidifiers run on 24-hour cycles with limited human labor — and the Xactimate price list rewards this with strong unit pricing. Mold remediation runs 40-50 percent gross margin because the labor content is heavier and the protective and disposal cost is real. Fire damage restoration runs 25-30 percent gross margin because the work is labor-intensive, slow, and contents-heavy. Reconstruction runs around 10 percent gross margin because it is a construction business with construction margins layered on top of the restoration relationship.
That spread — 70 percent on the front of the loss to 10 percent on the back — means that two restoration companies with the same revenue can have radically different profitability depending on the mix. A $5 million shop with 60 percent water and mold and 40 percent reconstruction makes meaningfully more money than a $5 million shop with 30 percent water and mold and 70 percent reconstruction, even if both are running competent operations. Mix is the single most important financial decision an operator makes, and it is rarely an explicit decision — it tends to drift based on what comes through the door. Treating mix as a deliberate strategic choice is the first move a finance-aware operator makes.
Net margin compresses as revenue grows. Independent industry references — including operator surveys cited by Restoration & Remediation Magazine and analysis from restoration-industry CFO advisors like Kiwi Cashflow — show that smaller restoration shops under $1M revenue can sustain gross margins near 70 percent, while shops over $50M typically run net margins in the 6 percent range and shops in the $30-50M band typically run net margins around 15 percent. The shape of the curve is consistent across multiple sources: the smaller the shop, the higher the gross margin and the more variable the net margin; the larger the shop, the more compressed the gross margin and the more stable but lower the net margin.
Why? Three structural reasons. First, smaller shops do less reconstruction proportionally — they pass it off — which keeps gross margin high. Second, smaller shops carry less overhead because the owner is doing the management work; larger shops require professional management layers that show up in SG&A. Third, larger shops carry more carrier-program exposure, which compresses pricing through preferred-vendor program rate negotiation. The implication for an operator is that the path to higher absolute dollars is real but does not produce proportional margin gains, and the operator who thinks scale will solve a margin problem is usually wrong.
Working capital intensity is brutal. Restoration is a cash-out, cash-in-much-later business. The work is performed in days or weeks; the cash is collected in months. The operator advances labor cost, equipment depreciation, materials, and subcontractor payments out of pocket and waits for the carrier to settle the claim. AR aging in the 60-120 day range is normal in commercial work and not unusual in residential work either. A shop growing 30 percent year over year is funding that growth with working capital — and a shop that grows faster than its working capital cycle can support runs out of cash even while showing strong P&L performance. This is the most common silent killer of growing restoration companies, and it is the subject of the first article in the cluster that follows.
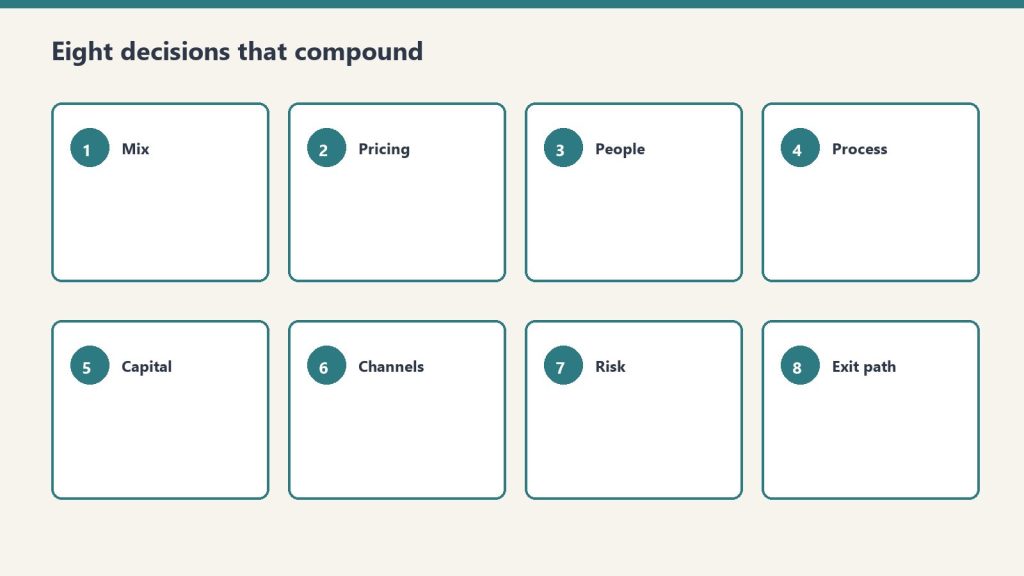
The eight decisions that separate compounders from plateaued operators
Eight decisions that separate compounders from plateaued operators.
The cluster that follows takes each of these decisions in depth. Here is the at-altitude framing of each so the operator can see the system before drilling into the parts.
AR aging and the Xactimate-to-cash cycle. The well-run shop measures Days Sales Outstanding by carrier, by service line, and by job size. It identifies the carrier programs whose AR cycle is acceptable and the ones that are not. It chooses to take or decline work based on cash-cycle math, not just margin math. It builds a working-capital reserve sized to the actual AR aging profile rather than the optimistic version. It treats AR as a strategic asset rather than a back-office annoyance.
Gross margin by service line. The well-run shop knows its gross margin to within a few points on each service line and uses that knowledge to manage mix deliberately. It chooses which service lines to lead with, which to accept opportunistically, and which to refuse — and it makes those choices based on the gross margin profile and the overhead-absorption requirements of each line, not on which work happens to come through the phone today.
Equipment economics. The well-run shop runs an equipment economic model that distinguishes between owning, leasing, and renting. It tracks equipment utilization, depreciation, and reinvestment cadence. It avoids both under-investment (forcing crews to wait for equipment that should already be on hand) and over-investment (carrying equipment that sits idle and burns capital). It treats the equipment fleet as a financial asset whose ROI is measurable rather than as a vague necessary cost.
Crew structure and labor cost. The well-run shop has a deliberate org structure that includes lead-tech tracks, supervisor tracks, and project-management tracks with explicit progression criteria, compensation bands, and productivity targets. It measures revenue per technician hour by service line. It manages labor as the largest controllable cost and treats hiring, training, and retention as strategic activities rather than reactive ones.
KPI dashboards. The well-run shop runs on a dashboard that includes job-level revenue, gross margin, AR aging, equipment utilization, labor productivity, customer acquisition cost by source, retention by source, and the small set of operational metrics that drive financial outcomes. The dashboard is simple, current, and reviewed weekly. It is the difference between an operator who is reacting to last quarter’s numbers and an operator who is steering against this week’s.
Preferred-vendor program economics. The well-run shop knows the true economics of each carrier preferred-vendor program — the rate concessions, the volume commitments, the documentation overhead, the AR cycle, and the program’s strategic risk. It distinguishes programs that produce profitable revenue from programs that produce activity at margin levels that do not justify the operational overhead. It uses preferred-vendor work as one channel among several rather than as the foundation of the business, because the operator who is dependent on a single carrier’s program is one underwriting decision away from a revenue cliff.
Multi-location growth. The well-run shop knows that the second location is structurally different from the first, the fifth is structurally different from the second, and the model that worked at $5 million breaks at $15 million and again at $50 million. It scales deliberately by building management depth ahead of revenue growth, by standardizing operations and financial reporting before geographic expansion, and by recognizing that multi-location restoration is a different business — a portfolio of operating businesses rather than a single business with multiple offices.
M&A and the consolidator landscape. The well-run shop understands the consolidator landscape — the strategic acquirers including BluSky (Partners Group and Kohlberg), ATI Restoration (TSG Consumer Partners), BMS CAT (AEA Investors), BELFOR, First Onsite, ServiceMaster Restore, Paul Davis, PuroClean, DKI, and the broader set of more than fifty private-equity platforms that have entered restoration since 2018 — and the deal mechanics that drive valuations. It positions early so that when an exit makes sense, the company is sellable at a premium. Or it positions to acquire small competitors itself. Or it makes the deliberate choice to remain independent, with a clear understanding of what that choice means for the owner’s long-term wealth.
These eight decisions are not equally important to every operator at every stage. An operator at $2 million revenue should focus on AR cycle, service mix, and labor cost — KPI dashboards and M&A are premature. An operator at $30 million revenue should focus on multi-location structure, preferred-vendor program economics, and exit positioning — basic AR discipline should already be in place. The cluster takes each decision in turn and explains the moves that matter most at each stage.
What this pillar is not
This pillar is not a financial-modeling primer. There are good resources for that — restoration-industry CFOs like Kiwi Cashflow publish accessible content for operators, and broader trade publications like Restoration & Remediation Magazine and Cleanfax run regular benchmarking surveys. The cluster references these where useful and does not duplicate them.
This pillar is not a substitute for working with a CPA who understands the restoration industry. The tax structure of a restoration company — the choice of S-corp vs. C-corp, the equipment depreciation strategy, the inventory accounting for materials, the treatment of subcontractor versus W-2 labor — is jurisdiction-specific and operator-specific. An operator running a finance and operations discipline without a real CPA relationship is missing the most important piece of the system. Find one early.
This pillar is not financial advice for any individual company. The numbers cited in the cluster are industry references, not specific recommendations. Every operator’s economics differ based on geography, mix, scale, carrier exposure, and dozens of other variables. Use the cluster as a framework to think with, not as a template to copy from.
How to read the cluster
Read the cluster with the van in mind — field reality first.
The cluster of eight articles that follows can be read in sequence — and there is some logic to reading it that way, since AR cycle and service-line economics are the foundation that the later articles build on. But it can also be read selectively. An operator who already has clean AR discipline can skip article one. An operator at $3 million revenue can skip the multi-location and M&A articles for now. An operator who is exit-curious can skip directly to the M&A piece and work backwards from there.
The articles share a structural pattern. Each opens with the operator-level question the article answers. Each names the specific moves the well-run shop makes on the question. Each acknowledges where the answer is genuinely operator-specific and where the answer is industry-generalizable. Each ends with what to read next inside this cluster and what to read elsewhere on Tygart Media.
The cluster is meant to function as the operator’s reference library on the financial and operational side of running a restoration company — the way the Marketing Stack cluster functions as the reference library on the demand side, and the way the Specialty Restoration cluster functions as the reference library on commercial wedge strategy. Together those three clusters cover the major operating axes of the restoration business: how you get work, how you do high-margin commercial work, and how you run the company you have built.
Where the consolidator industry is going
A note on the broader industry context that frames the entire cluster, and especially the M&A article at the end. The restoration industry is in the middle of a consolidation cycle. As referenced by Cleanfax in operator coverage, approximately three brands operate above the $2 billion revenue threshold today, and industry leaders predict that by 2030 the count of $2 billion-plus brands will roughly double. Private equity has been active in the space for several years; industry M&A coverage from sources like The Deal Sheet and Hyde Park Capital identifies more than fifty PE platforms acquiring restoration operators since 2018, with deals at platform-level transacting in the 4x-7x EBITDA range and smaller-company deals transacting in the 3-4x range. The strategic acquirers — BluSky, ATI, BELFOR, BMS CAT, First Onsite, ServiceMaster Restore, Paul Davis, PuroClean, DKI — are buyers across multiple deal sizes. Carrier preferred-vendor programs reward national footprints, which structurally favors the consolidators. Insurance program economics increasingly require the documentation, technology, and reporting capabilities that smaller shops struggle to maintain.
For owner-operators, this trajectory matters in two ways. First, it raises the value of independent shops that have built defensible operations — clean financial reporting, defensible service-mix discipline, durable customer relationships that are not dependent on a single carrier program, professional management depth — because these are the targets the consolidators want to buy. Second, it raises the difficulty of staying independent in a commodity-restoration market position, because the consolidators have scale advantages on carrier-program economics, technology, and back-office cost. The defensible independent posture is to specialize, professionalize, and build differentiated capability — the specialty wedge from the prior cluster, plus the operational discipline this cluster discusses.
The owner-operator who reads this cluster should be doing so with a clear strategic intent. Either build to scale, build to exit, or build to remain durably independent in a defensible niche. All three are legitimate. None of them happen by accident, and all of them require the financial and operational discipline this cluster describes.
What does this cluster cover that the marketing stack and partner industries clusters do not?
The marketing stack covers demand generation — how a restoration company gets work in the door. The partner industries cluster covers referral relationships — how a restoration company gets work from adjacent service providers. The specialty restoration cluster covers the commercial-account wedge. This cluster covers what happens after work comes in: how the company is financed, how its operations are structured, how its profitability is managed, and how the owner positions the business for long-term value creation. All four clusters are needed to run a complete restoration business.
What revenue range is this cluster aimed at?
Primarily $2 million to $30 million in annual revenue — the owner-operator independent segment. The articles acknowledge what changes above $30 million and at $50-million-plus scale, particularly in the multi-location and M&A pieces, but the core advice is calibrated to operators who own the business they are running.
Why are the gross margin numbers cited so different from what I see in my own books?
Because every operator’s mix, geography, labor structure, and equipment posture is different. The numbers cited — water 70-80 percent, mold 40-50 percent, fire 25-30 percent, reconstruction around 10 percent — are industry directional ranges from public benchmarks and CFO commentary, not specific predictions for any individual company. Use them as a sanity check on your own numbers. If your water mitigation gross margin is 50 percent, that is a real signal worth investigating — likely a labor-cost issue, an Xactimate pricing issue, or an overhead-allocation issue. If your reconstruction margin is 25 percent, that is also a real signal worth investigating — likely a scoping or labor-attribution issue. The benchmarks are the start of a conversation, not the end of one.
Should I be running this cluster’s discipline before pursuing the specialty wedge from the prior cluster?
Yes, in most cases. The specialty wedge is a growth strategy for commercial accounts. The financial and operational discipline in this cluster is the foundation that lets a restoration company actually capture and sustain that growth. An operator who pursues commercial specialty work with sloppy AR, undisciplined service mix, and informal operations will win some accounts and then implode under the weight of work they cannot service profitably. The order is: get the operating system clean, then expand into commercial specialty. There are exceptions — operators who already have clean operations and are specifically growth-constrained should pursue the specialty wedge in parallel — but for most operators, the cluster sequencing is operations first, growth second.
Do consolidators pay enough that an exit makes financial sense for an owner-operator?
It depends on the company, the buyer, the structure, and the timing. Industry deal multiples in restoration vary widely — public references from Viking Mergers, Peak Business Valuation, and First Page Sage show small-shop SDE multiples typically in the 2.3x-3.5x range, smaller EBITDA deals in the 3x-4x range, and PE platform-level deals in the 4x-7x range, with the highest multiples reserved for differentiated, well-managed operators with national-scale appeal. The M&A article in this cluster covers what drives the spread and what an owner can do over a two-to-three-year horizon to position for the higher end. For most owner-operators, the answer is that exit is a real wealth-creation event when the company has been built deliberately for it, and a disappointment when the owner has run the business well operationally but never thought about exit value until they were ready to sell.
What if my company is already at $50 million-plus revenue — is this cluster useful?
The pillar and several articles still apply at any scale. The AR cycle, service-line economics, and KPI dashboard articles are scale-agnostic. The labor and crew article scales with adaptation. The equipment article scales with adaptation. The multi-location and M&A articles are written specifically for the upper end. The cluster is calibrated to the owner-operator segment but does not pretend that the lessons stop there.
Why is this published on Tygart Media rather than packaged as a paid product?
Because Tygart Media’s content thesis is that the most valuable operator-level intelligence in the restoration industry is given away to readers who become long-term operating partners with Tygart. The companies that read this cluster, find it useful, and hire Tygart for managed marketing operations are the ones who become five-year clients. The economics work. The cluster is free for the same reason the prior three clusters are free.
What should I read after this pillar?
Start with the AR aging and Xactimate-to-cash cycle article — it is the single highest-leverage operational improvement most restoration companies can make. From there, the gross margin by service line article naturally follows. After those two, sequencing is operator-dependent. An operator at $5 million should pick crew structure or KPI dashboards next. An operator at $25 million should pick multi-location growth or preferred-vendor program economics next. The cluster works in any order after the first two articles.
Is this cluster going to be updated as industry conditions change?
Yes. The restoration industry is in active consolidation, carrier-program economics are shifting, and the technology stack available to operators is changing rapidly. Tygart Media revisits the cluster on roughly an annual basis to update industry references, refresh the consolidator landscape, and incorporate new operator intelligence. Readers who subscribe via the email list at the bottom of any Tygart Media page will be notified when major updates occur.
What is the single most important takeaway from this pillar?
That a restoration company is a real business, not a service shop, and the operators who treat it as a real business — with deliberate financial discipline, deliberate operational structure, deliberate growth strategy, and deliberate exit positioning — compound their wealth at multiples of the operators who treat it as a service shop. The work is not glamorous. The discipline is not optional. The cluster that follows describes the work in detail.
If you manage facilities for a corporate occupier and you have been trying to figure out how to get Scope 3 emissions data from your restoration contractors, the Restoration Carbon Protocol (RCP) exists to answer that question. This article explains what the RCP is, how it works, and what IFMA members specifically need to know about using it as a procurement and compliance tool.
What the Restoration Carbon Protocol Is
What the Restoration Carbon Protocol is.
The RCP is an industry self-standard published by Tygart Media that defines how restoration contractors should calculate, document, and report the greenhouse gas emissions associated with each project they complete. It is built on the GHG Protocol’s Corporate Value Chain (Scope 3) Standard — the same framework used by most corporate ESG reporting programs and required by SB 253 and CSRD.
The RCP fills a specific void: no restoration industry body — not IICRC, not RIA, not any trade association — had previously published a Scope 3 reporting methodology for restoration work. Commercial property managers and corporate FM teams asking their restoration vendors for emissions data were getting blank stares. The RCP gives contractors the methodology and gives FM procurement teams the standard to reference.
The Five Core Restoration Job Types and Their Scope 3 Mapping
The RCP maps each of the five primary restoration job types to the relevant GHG Protocol Scope 3 categories:
Water damage restoration: Category 1 (services purchased), Category 5 (waste from extracted water and contaminated materials)
Fire and smoke restoration: Category 1 (services), Category 5 (soot, char, and demolition debris waste streams)
In all five cases, the primary Scope 3 category for the FM client is Category 1 — Purchased Goods and Services. The emissions are generated by the contractor performing work on your behalf at your facility.
The 12 Data Points: What to Ask Your Contractor to Track
Twelve data points to ask your contractor to track.
The RCP defines 12 data points that a restoration contractor should capture on each job to enable a complete Scope 3 calculation. As an FM procurement professional, these are the data fields you should be requiring in your vendor agreements:
Total diesel consumed by drying and dehumidification equipment (gallons)
Total propane or natural gas consumed by heat drying equipment (cubic feet or gallons)
Total vehicle miles traveled to and from the site by all crew vehicles
Number of crew vehicle trips and vehicle types (van, pickup, box truck)
Total equipment operating hours (by equipment category)
Weight of water extracted and removed from the site (gallons or pounds)
Weight and type of contaminated materials removed (drywall, insulation, flooring, etc.)
Disposal method for each waste stream (landfill, recycling, hazardous waste facility)
Refrigerants used, recovered, or vented (for HVAC-adjacent work)
Materials installed by type and weight (for reconstruction phases)
Cleaning agents and chemical products used by product category
Total project duration in days
Not every data point is relevant to every job type. The RCP provides job-type-specific templates that pre-populate the relevant fields for water, fire, mold, hazmat, and biohazard jobs respectively.
How FM Teams Can Use the RCP Framework
There are three practical ways IFMA members can incorporate the RCP into their FM operations:
1. Vendor Qualification
Add RCP awareness to your restoration vendor qualification checklist. Ask prospective vendors whether they have adopted the RCP framework. Vendors who can demonstrate RCP familiarity are already capturing the data you need; vendors who cannot are a data gap risk for every job they complete.
2. Contract Language
Include a Scope 3 data provision clause in restoration vendor agreements referencing the RCP as the accepted methodology standard. This gives vendors a concrete deliverable (the RCP Job Carbon Report) rather than an open-ended “emissions data” request they have no idea how to fulfill.
3. Scope 3 Inventory Integration
Route the per-job RCP carbon reports from your restoration vendors into your Scope 3 Category 1 data collection system. Most ESG reporting platforms (Watershed, Persefoni, Salesforce Net Zero Cloud, etc.) accept Category 1 supplier data in standardized formats. The RCP report is designed to map directly to these platforms’ input requirements.
The RCP Is Free to Use
The Restoration Carbon Protocol is published as an open industry standard. There is no licensing fee, no certification requirement, and no vendor lock-in. FM teams can share the RCP framework directly with their restoration vendors at no cost. Contractors can adopt the RCP’s data capture templates and calculation methodology without purchasing anything.
The goal is adoption — the more restoration contractors who begin tracking RCP-compliant data, the more complete FM Scope 3 inventories become across the industry.
Frequently Asked Questions
Is the RCP recognized by IICRC or RIA?
The RCP is an independent industry self-standard published by Tygart Media. It is not currently endorsed by IICRC or RIA, as neither body has published a competing ESG standard. The RCP fills the void those bodies have not addressed. FM teams and restoration contractors can adopt it independently without waiting for official industry body endorsement.
How does a restoration contractor become RCP-certified?
The RCP v1.0 includes a self-certification checklist. Contractors complete the checklist to demonstrate they have implemented the required data capture processes and calculation methodology. Third-party verification is available for organizations that require audited certification. Details are published at Restoration Carbon Protocol.
California’s Climate Corporate Data Accountability Act — SB 253 — is the most consequential piece of corporate climate disclosure legislation in the United States. For facility managers at large corporate occupiers, its Scope 3 provision creates a specific and urgent vendor management problem that most FM teams have not yet fully reckoned with.
What SB 253 Actually Requires
SB 253 requires companies with annual revenues exceeding $1 billion that do business in California to publicly disclose their greenhouse gas emissions. The disclosure schedule is phased:
Scope 1 and Scope 2: First reports due in 2026 (covering fiscal year 2025 data)
Scope 3: First reports due in 2027 (covering fiscal year 2026 data)
The California Air Resources Board (CARB) is the administering body. Reports must be independently verified by a third-party auditor. The law applies to any company doing business in California — not just California-headquartered companies — which means the net is significantly wider than the state’s own corporate population.
This is not a voluntary framework. SB 253 carries penalties for non-compliance. The Scope 3 provision is the one that creates a direct operational problem for FM teams, because Scope 3 data lives outside your organization — in your contractors’ job management systems.
The Contractor Data Chain
The contractor data chain under SB 253.
Under the GHG Protocol’s Scope 3 framework — which SB 253 uses as its methodological basis — your restoration contractors are a Category 1 (Purchased Goods and Services) supplier. Every time you hire a restoration company to respond to a water intrusion event, a fire damage claim, or a mold remediation project, that contractor’s emissions for that job are technically part of your Scope 3 inventory.
The calculation is not optional. The GHG Protocol requires organizations to make a reasonable effort to quantify all material Scope 3 categories. For a large corporate occupier with a substantial real estate portfolio, emergency restoration is a recurring and quantifiable Category 1 exposure. Your ESG auditor will ask about it. Your SB 253 filing will need to account for it.
Why Most Restoration Contractors Cannot Provide This Data Today
Most restoration contractors cannot provide this data today.
The restoration industry has no Scope 3 standard. IICRC — the primary certification body for restoration professionals — has no ESG reporting guidance. RIA has no Scope 3 framework. Most restoration contractors manage their operations through job management software that tracks labor hours, materials, and job costs — not emissions.
This is not negligence; it is a gap that simply has not been filled until now. The Restoration Carbon Protocol (RCP) is the first industry self-standard that defines how restoration contractors should calculate and report their Scope 3 emissions data. It gives contractors the methodology, the data capture template, and the calculation framework — and it gives FM procurement teams the standard they can reference in vendor contracts.
What to Put in Your Vendor Agreements Now
Put requirements in vendor agreements now.
The most practical SB 253 preparation step for FM procurement teams is to update restoration vendor agreements to include a Scope 3 data provision clause. Here is the language framework:
“Vendor agrees to provide a per-project greenhouse gas emissions summary for each project completed at Client facilities, using a documented calculation methodology consistent with GHG Protocol Scope 3 Category 1 guidelines. The summary shall include: total fuel consumption by equipment type, vehicle miles traveled, waste materials removed by type and weight, and total equipment operating hours. Submissions shall be provided within 30 days of project completion.”
This clause does not require contractors to be ESG experts. It requires them to track and report the underlying data points from which a Scope 3 calculation can be made. Contractors who have adopted the RCP framework already capture this data as part of their standard job documentation.
The Retroactive Data Problem
SB 253 requires disclosure for fiscal year 2026 data, meaning the clock is already running. If your organization does business in California and exceeds the revenue threshold, your restoration vendors should be tracking Scope 3 data for jobs completed throughout 2026. Waiting until late 2026 to request this data will result in gaps that your ESG auditor will flag.
For restoration jobs already completed in 2025 and early 2026, proxy-based estimation is acceptable under GHG Protocol methodology when primary data is unavailable. The RCP provides proxy calculation tables for each restoration job type, allowing FM teams to estimate historical emissions from basic job records (square footage treated, job duration, equipment type). This is not ideal, but it is methodologically defensible and far better than a data gap.
The SB 253 Compliance Checklist for FM Teams
Confirm whether your organization meets the SB 253 threshold (>$1B revenue, does business in California)
Identify all restoration and specialty trade contractors in your vendor pool as Category 1 Scope 3 sources
Update vendor agreements with a Scope 3 data provision clause (language above)
Share the RCP framework with active vendors so they understand what data to capture
Establish a process for collecting and storing per-job emissions summaries in your FM system
Engage your ESG consultant to integrate contractor data into your Scope 3 Category 1 calculation methodology
Plan for third-party verification of your Scope 3 data — auditors will scrutinize Category 1 more than any other category
Does SB 253 apply if my company is not headquartered in California?
Yes. SB 253 applies to any company that “does business in California” and meets the revenue threshold. This is broadly interpreted to include companies with California employees, customers, or operations — even if they are incorporated and headquartered elsewhere.
What is the penalty for non-compliance with SB 253 Scope 3 provisions?
CARB has authority to assess administrative penalties for non-compliance. The specific penalty structure is being finalized through rulemaking. Consult your legal counsel for the current enforcement guidance applicable to your organization.
Can I use a spend-based methodology for restoration contractor Scope 3 data?
Spend-based estimation (using economic input-output data) is permitted under GHG Protocol methodology as a fallback when primary or activity-based data is unavailable. However, third-party auditors generally flag spend-based estimates as lower quality than activity-based calculations. For a recurring Category 1 source like restoration contractors, building toward activity-based data is the appropriate goal.
If you manage facilities for a large corporate occupier, you have almost certainly heard the phrase “Scope 3 emissions” from your sustainability team, your CFO, or your ESG consultant. What you may not have heard is a clear explanation of what that means for your day-to-day vendor management — and why the contractors who respond to your water damage and mold remediation calls are sitting in the middle of your most difficult compliance gap.
The Three Scopes: A Plain-Language Primer
Three scopes primer — contractors sit in Scope 3.
The GHG Protocol’s Corporate Standard divides greenhouse gas emissions into three categories based on where they originate relative to your organization’s operations:
Scope 1 — Direct emissions from sources your organization owns or controls. The combustion in your building’s boilers, the fuel in your company-owned fleet vehicles, the refrigerants in your HVAC systems.
Scope 2 — Indirect emissions from purchased electricity, heat, or steam. The power your facilities consume from the grid.
Scope 3 — All other indirect emissions across your value chain. Everything that happens upstream (your supply chain) and downstream (how your products or services are used) that generates emissions on your behalf.
Scope 1 and Scope 2 are manageable. You own the sources or the meters. You have the data. Scope 3 is where it gets hard — because Scope 3 data lives in other organizations’ systems, not yours.
The 15 Categories of Scope 3
The GHG Protocol breaks Scope 3 into 15 categories across upstream and downstream activities. For a corporate FM managing occupied facilities, the most relevant upstream categories are:
Category 1 — Purchased Goods and Services: The emissions associated with producing and delivering everything your organization buys from third parties. For FMs, this includes every contractor, vendor, and service provider who performs work at your facilities — including your restoration contractors.
Category 2 — Capital Goods: Emissions from the production of capital equipment and major building systems your organization purchases.
Category 4 — Upstream Transportation and Distribution: Relevant when contractors transport materials and equipment to your site.
Category 5 — Waste Generated in Operations: Emissions from waste your organization generates — relevant when restoration work produces debris, contaminated materials, or demolition waste disposed of on your behalf.
Why Contractors Are Your Hardest Data Category
Why contractors are your hardest data category.
Among all the inputs to a corporate FM’s Scope 3 inventory, contractor-generated emissions are consistently the most difficult to quantify. Here is why:
Contractors do not routinely track their own emissions. Most restoration, janitorial, maintenance, and specialty trade contractors have no internal system for calculating the greenhouse gas footprint of individual jobs. They track labor hours, materials costs, and square footage — not carbon.
Restoration work is episodic. Unlike your regular janitorial or HVAC maintenance contractor, your restoration vendors are called in during emergencies. There is no standing purchase order to attach emissions data to. Each job is a separate event, often managed by a different project manager.
No industry standard exists for restoration Scope 3 data. IICRC — the restoration industry’s primary certification body — has no ESG reporting standard. RIA has no Scope 3 guidance. There is no form, no template, no industry norm for what a restoration contractor should provide.
The emissions profile of restoration work is complex. A single water damage job involves diesel-powered drying equipment running 24/7 for days, hazardous material disposal, multiple material categories, and vehicle trips from multiple crew members. Calculating the emissions accurately requires a methodology most contractors have never seen.
The 2027 Problem
California SB 253 — the Climate Corporate Data Accountability Act — requires companies with over $1 billion in annual revenue doing business in California to disclose their Scope 3 emissions starting with the 2027 reporting year. The EU’s CSRD is already in effect and expanding. CDP and GRESB already request Scope 3 data from the organizations they track.
For FMs at large corporate occupiers, this creates a specific operational problem: your sustainability team needs contractor emissions data for the 2027 filing, your contractors do not have a system for providing it, and there is no industry standard to point them to. The gap between the regulatory requirement and the contractor’s current capability is the problem this publication addresses.
What Good Contractor Scope 3 Data Looks Like
What good contractor Scope 3 data looks like.
The Restoration Carbon Protocol (RCP) defines 12 data points that every restoration job ticket should capture to enable Scope 3 calculation. At a minimum, FM procurement teams should be asking their restoration vendors for:
Total fuel consumed by diesel-powered drying and dehumidification equipment (gallons)
Total vehicle miles traveled by contractor crews to and from the site
Weight and type of waste materials removed and method of disposal
Refrigerants used or recovered (for HVAC-adjacent restoration work)
Materials installed by type and weight (for reconstruction phases)
Total job duration and equipment operating hours
With these inputs, a standardized calculation using EPA emission factors can produce a per-job carbon estimate that satisfies Scope 3 Category 1 methodology. The RCP provides exactly that calculation framework — free for any contractor or FM team to use.
What to Do Now
If the 2027 Scope 3 deadline is on your radar, the most practical steps you can take today are:
Audit your vendor pool for contractors who perform Category 1 services. Restoration, abatement, specialty trades, and maintenance contractors are your highest-priority Scope 3 data gaps.
Include a Scope 3 data provision clause in new vendor agreements. Require contractors to provide a per-job emissions summary using a standardized methodology.
Share the RCP framework with your restoration vendors. It gives them the methodology, the data capture form, and the calculation tools — everything they need to start providing compliant data on the next job.
Start tracking now, even if imperfectly. A reasonable estimate based on available data is better than a data gap. Your ESG auditor would rather see a documented methodology with known limitations than a blank line item.
Frequently Asked Questions
Does every facility manager need to report Scope 3?
Mandatory Scope 3 reporting under SB 253 applies to companies with over $1 billion in annual revenue doing business in California. CSRD applies to large EU entities. Many FMs at smaller organizations will face voluntary disclosure pressure through CDP participation, GRESB assessments, or investor requirements. Regardless of regulatory mandate, proactively building Scope 3 data capability now reduces compliance cost later.
Are restoration contractors required to provide Scope 3 data?
Not yet — but their FM clients increasingly will be required to report it. The most practical approach is to contractually require Scope 3 data from restoration vendors as part of vendor onboarding, rather than trying to collect it retroactively after a job is complete.
Part of the IFMA Scope 3 series on tygartmedia.com.
When sustainability consultants talk about ESG in commercial real estate, they often treat IFMA and BOMA as interchangeable acronyms for “building people.” They are not. The distinction between these two associations is not a branding detail — it is a fundamental difference in who you work for, what buildings you manage, and which Scope 3 obligations land on your desk. Getting this wrong means applying the wrong compliance framework to the wrong problem.
The Core Difference: Occupier vs. Owner
Occupier vs owner — where each association lives.
IFMA — the International Facility Management Association — primarily serves facility managers who work for corporate occupiers. These are the FMs at a hospital system, a university, a Fortune 500 headquarters, or a government agency. They manage buildings that their organization uses to do its business. They do not own those buildings as an investment. They are the operational stewards of space their organization occupies.
BOMA — the Building Owners and Managers Association — primarily serves property owners and commercial property management firms. BOMA members typically work for organizations whose business model is real estate: they own or manage buildings as assets, lease space to tenants, and generate revenue from that occupancy. The building is the product, not the platform.
This single distinction — occupier vs. owner — changes everything about how Scope 3 ESG obligations flow.
Contractor supply chain data gaps (Category 1); purchased services
Tenant energy use; embodied carbon in renovation; asset-level GRESB
Restoration relevance
Every emergency restoration job generates Scope 3 data the FM must capture
Tenant improvement work; asset restoration after casualty
Reporting framework
GHG Protocol Corporate Standard; California SB 253; EU CSRD
GRESB Real Estate Assessment; ENERGY STAR; local building performance standards
Why This Matters for Scope 3 Specifically
Under the GHG Protocol’s Scope 3 framework, a corporate occupier’s emissions inventory must include the activities of every contractor who performs services at their facilities. Water damage restoration, fire and smoke remediation, mold abatement, asbestos removal — every one of these jobs generates greenhouse gas emissions that belong somewhere in the FM’s Scope 3 report. Specifically, restoration contractor activity typically falls under Category 1 (Purchased Goods and Services) or Category 14 (Franchises), depending on the contractual structure.
The BOMA member’s Scope 3 picture is different. A property manager’s primary Scope 3 exposure is Category 13 (Downstream Leased Assets) — the energy and emissions generated by the tenants who occupy their buildings. Restoration work on a BOMA member’s asset matters for GRESB and insurance, but it is not the core Scope 3 data gap they are trying to solve.
The IFMA member, by contrast, is the one whose sustainability team is currently trying to figure out how to get emissions data from their restoration vendor. They are the ones receiving questionnaires from CDP and GRESB asking about contractor emissions. They are the ones whose corporate ESG report will be incomplete without restoration job data. And right now, they have no standard way to get it.
The 2027 Deadline Is the IFMA Problem, Not the BOMA Problem
California’s SB 253 — the Climate Corporate Data Accountability Act — requires companies with over $1 billion in annual revenue doing business in California to disclose their Scope 3 emissions beginning in 2027. The EU’s Corporate Sustainability Reporting Directive (CSRD) is already in effect for large European companies, with phased expansion through 2026. Both frameworks require supply chain emissions data — which means contractor data.
For the corporate FM managing a large occupier’s portfolio, this deadline is operational. Their sustainability team is assembling the Scope 3 inventory now. They need contractor emissions data now. Every restoration company they have worked with in the past three years is a potential data gap in their 2027 filing.
BOMA members face a related but structurally different pressure: their tenants are the Scope 3 reporters. The property manager’s role is to provide energy use data to tenants, not necessarily to collect contractor emissions data for their own disclosure. This is a meaningful distinction. The compliance urgency for Scope 3 contractor data sits much more squarely with the IFMA member.
The Missing Bridge: Restoration Contractors and Scope 3 Data
The missing bridge: restoration contractors and Scope 3 data.
Here is the specific gap this publication exists to close: restoration contractors — the companies that respond to water damage, fire, mold, and environmental emergencies at commercial facilities — have no standardized way to provide Scope 3 emissions data to their FM clients. The International Institute of Cleaning and Restoration Certification (IICRC) has no ESG standard. The Restoration Industry Association (RIA) has no Scope 3 guidance. No industry body has built the framework that tells a restoration contractor what data to capture on each job ticket so their FM client can use it in a Scope 3 report.
This is the problem the Restoration Carbon Protocol (RCP) was built to solve. The RCP is a Tygart Media-published industry self-standard that maps restoration job types to the GHG Protocol’s 15 Scope 3 categories, defines the 12 data points every job ticket should capture, and provides the calculation methodology restoration contractors need to produce credible emissions data. It is the operational bridge between the FM’s Scope 3 disclosure obligation and the restoration contractor’s job management system.
What IFMA Members Should Be Asking Their Restoration Vendors Today
What IFMA members should ask restoration vendors today.
If you are a facility manager with Scope 3 reporting obligations, here are the five questions you should be putting to every restoration contractor in your vendor pool:
Can you provide a per-job emissions summary for each project you complete at our facilities? If the answer is no, that is a gap in your Scope 3 Category 1 data.
Do you track materials disposed of by type and weight? Waste stream data is a required input for Scope 3 calculation under GHG Protocol methodology.
Do you track vehicle and equipment fuel consumption for each project? Mobile combustion is a Category 1 input that most restoration contractors currently ignore.
Are you familiar with the Restoration Carbon Protocol? RCP-aware contractors are already capturing the data FMs need.
Would you be willing to complete a standardized carbon data form for each project? The RCP Job Carbon Report is a one-page form any contractor can complete without a sustainability consultant.
Why Tygart Media Covers This Beat
Tygart Media’s position in the restoration industry — through the Restoration Carbon Protocol, the Restoration Golf League network, and years of content production for restoration operators — gives us a direct view into the contractor side of this data gap. This IFMA Scope 3 category exists to build the FM side of the same bridge: to give facility managers the framework, vocabulary, and vendor guidance they need to close their Scope 3 contractor data gap before the 2027 deadline arrives.
This is not a BOMA story. It is not a property management story. It is a facility management story — about the corporate occupier’s FM team trying to satisfy a board-level ESG commitment with incomplete data from contractors who have never been asked for it before. We are building the source of truth for that problem.
What is the difference between IFMA and BOMA for ESG purposes?
IFMA serves facility managers who manage buildings for corporate occupiers — organizations that use the space for their own operations. BOMA serves property owners and managers who lease space to tenants as a business. For Scope 3 ESG, IFMA members must capture contractor emissions data as part of their corporate supply chain disclosure, while BOMA members primarily focus on tenant energy use and asset-level performance benchmarking.
Why do restoration contractors matter for IFMA Scope 3 reporting?
Restoration contractors perform services at IFMA members’ facilities. Under the GHG Protocol, the emissions from those services are part of the corporate occupier’s Scope 3 inventory — typically Category 1 (Purchased Goods and Services). Without standardized emissions data from restoration vendors, the FM’s Scope 3 report has a recurring gap every time an emergency occurs at a managed facility.
What is the Restoration Carbon Protocol?
The Restoration Carbon Protocol (RCP) is an industry self-standard published by Tygart Media that maps restoration job types to GHG Protocol Scope 3 categories and defines the data restoration contractors should capture to enable their FM clients’ Scope 3 reporting. It is the first framework of its kind in the restoration industry.
When does Scope 3 reporting become mandatory for large companies?
California SB 253 requires Scope 3 disclosure for companies with over $1 billion in annual revenue doing business in California beginning in 2027. The EU’s CSRD is already in force for large European entities, with phased expansion through 2026. Many voluntary frameworks (CDP, GRESB) already request Scope 3 data.
This article is part of Tygart Media’s IFMA Scope 3 category — the facility manager’s source of truth for Scope 3 ESG reporting and contractor data standards.
The phrase “optimize for AI search” is almost always wrong. There is no single AI search behavior. Claude, ChatGPT, and Perplexity each have distinct citation patterns — different content structures they reward, different page types they concentrate on, different signals they weight. Writing one undifferentiated article and hoping it gets cited across all three is the same mistake as writing one undifferentiated web page and hoping it ranks for every keyword. This cluster article covers the per-model citation playbook, built from GA4 data and the multi-model roundtable methodology in the Tygart Media Knowledge Lab.
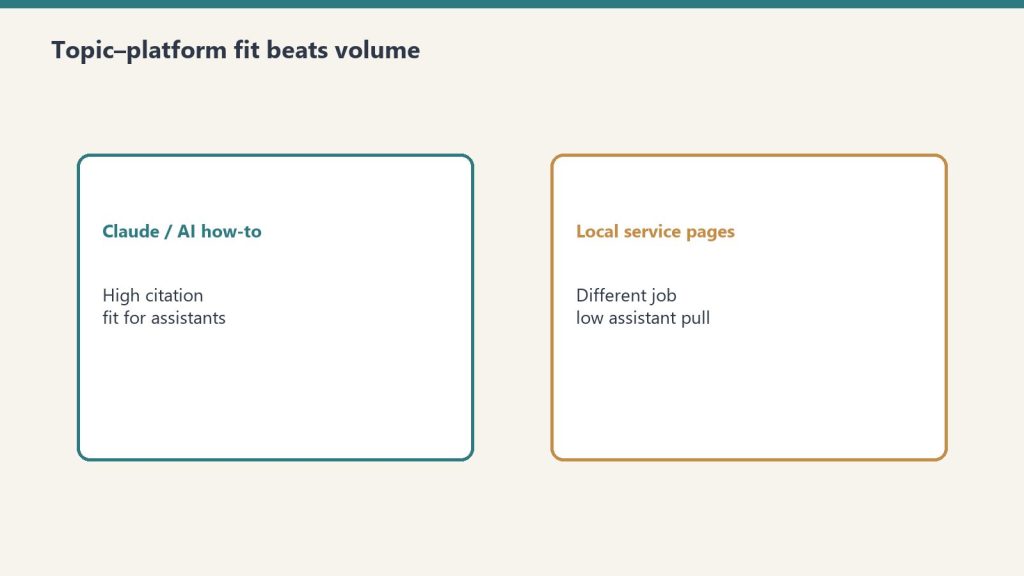
Claude (Anthropic): Concentrates heavily. GA4 data from sites in the Knowledge Lab shows Claude sending approximately 54.5% of its AI referral traffic to just 2 pages per site. It rewards content that is entity-dense, structurally authoritative, and written with speakable precision — defined terms, explicit relationships between concepts, factual density over narrative padding. Claude users tend to be technical and high-intent; the model reflects that by citing content that answers with precision rather than coverage. Approximately 90% of content on a typical site is invisible to Claude — it surfaces a small authoritative set and ignores the rest.
ChatGPT (OpenAI): Spreads references broadly. Where Claude concentrates on 2 pages, ChatGPT may reference 8-12 across the same site. It rewards breadth, recency, and natural-language accessibility. Content structured like a knowledgeable friend explaining something clearly — without jargon walls — performs well. ChatGPT users skew toward general-purpose questions; the model cites content that covers the question conversationally without assuming deep domain expertise.
Perplexity: Research-flavored. It rewards sourced claims, comparative tables, explicit statistics, and content that reads like a researched brief rather than an opinion piece or narrative. Perplexity users are actively in research mode; the model surfaces content that looks like it did the research so the user does not have to. Citation-rich, data-dense, table-formatted content punches above its traffic weight in Perplexity referrals.
The Per-Model Content Shape
Element
Claude
ChatGPT
Perplexity
Density target
High — entity-rich, precise
Medium — accessible, broad
High — sourced, comparative
Best structure
Defined terms, explicit relationships, OASF
Conversational headers, FAQ blocks
Tables, stat callouts, comparison matrices
Ideal length
1,500-2,500 words with tight structure
800-1,500 words, readable flow
1,000-2,000 words with data anchors
Citation trigger
Authoritative entity coverage
Query-matching accessible answer
Sourced comparative data
The Multi-Model Roundtable Methodology
Multi-model roundtable methodology.
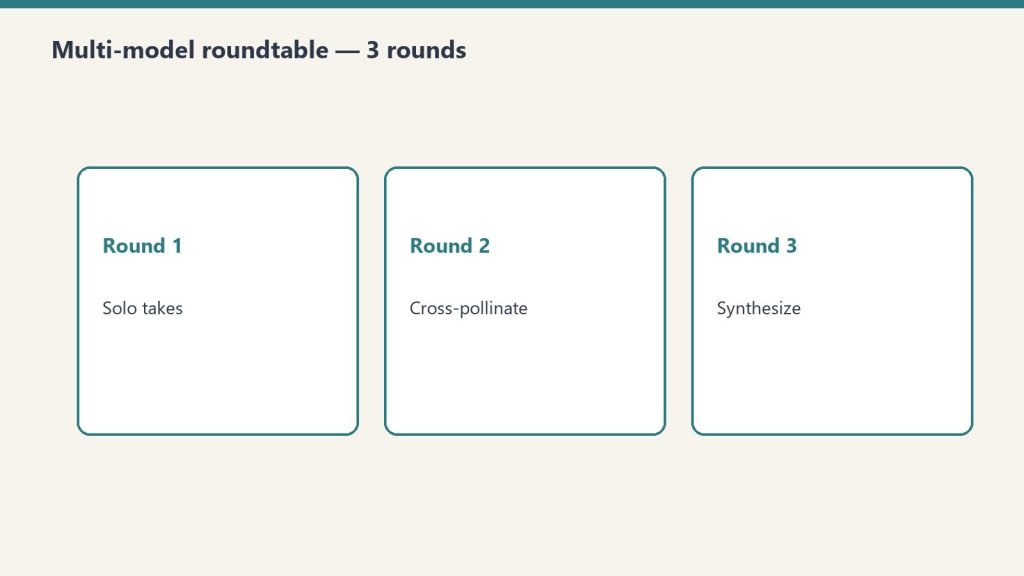
The Tygart Media Knowledge Lab documents a specific workflow for content research that leverages multiple models’ citation profiles rather than fighting them. The pattern: route the initial research brief to a free or cheap model (Gemini Flash via OpenRouter, or Llama 3 free tier) for broad source gathering. Pass the source list to Claude for entity extraction and authoritative synthesis. Use the Claude-synthesized brief as the foundation for the final article draft. The output is content that is naturally entity-dense from Claude’s synthesis pass while covering enough ground to catch ChatGPT’s broader citation net.
The token economics matter here: the expensive synthesis pass (Claude Sonnet 4.6 or Haiku) operates on a pre-filtered source set, not raw web content. Input tokens are lower because a cheaper model did the broad sweep. Claude’s output is higher-density because it is synthesizing structured inputs rather than processing noise. This is the OpenRouter multi-model pipeline in content production form.
Writing for Claude Citation Specifically
Writing for Claude citation specifically.
If your primary goal is Claude citation — high-intent technical traffic, B2B contexts, developer audiences — the content discipline is: define every entity explicitly at first mention, state relationships between concepts directly (“X enables Y because Z”), use speakable sentence structures (subject-verb-object, no buried clauses), include a structured FAQ or definition block, and remove padding. Claude’s citation concentration on 2 pages per site means your best-performing page for Claude referrals will get the bulk of the traffic — invest in making that page entity-complete rather than spreading thin coverage across many pages.
Writing for Perplexity Citation
Perplexity citation optimization is the most actionable of the three because the signal is explicit: include comparative tables with real numbers, cite sources inline (even if just attributing claims to specific organizations or studies), use headers that read like research questions, and lead sections with data points rather than narrative. The content in this series — pricing tables, API code examples, usage statistics — is structured for Perplexity citation by design. Every table is a potential Perplexity extraction point.
The Budget Connection
Per-model content shaping is a budget strategy, not just a citation strategy. Writing one highly targeted, entity-dense 2,000-word article for Claude citation is cheaper to produce — fewer tokens, tighter output discipline — and more effective than producing three generic 1,500-word articles hoping one gets cited. Concentration over coverage: the same principle Claude uses to cite content, applied to content production itself. The output compression discipline from Cluster 6 makes this article type cheaper to generate. Dense, targeted content is both cheaper to produce with Claude and more likely to be cited by Claude. The budget and the citation strategy converge.
Most Claude cost analyses focus on input tokens — the knowledge you send in. The underappreciated lever is output compression. Claude is trained to be thorough. Left unconstrained, it produces full meals: preambles, recaps, hedges, transition sentences, closing summaries. All of those tokens cost money. All of them are often unnecessary. Output discipline — getting Claude to deliver concentrated slices instead of full meals — is often the highest-leverage cost reduction available without changing models or switching to async.
Why output deserves its own discipline: on every current Claude model, output tokens cost 5x their input counterparts. Verified output rates:
Model
Output (per MTok)
Input (per MTok)
Claude Fable 5.1
$50.00
$10.00
Claude Opus 5.5
$20.00
$4.00
Claude Sonnet 5.5
$10.00
$2.00
Claude Haiku 4.5
$5.00
$1.00
Every unnecessary output token costs five times what an input token costs. That ratio is what makes output compression the highest-leverage lever on this page.
Ask Claude to “summarize this document” without constraints and you will get: an opening sentence restating the task, a multi-paragraph summary, a bullet-point recap of the summary, and a closing note about what was not covered. The actual information density — insight per token — is low. You paid for 800 tokens of output and needed 150. Multiply across thousands of API calls and you have built a significant cost leak from default model behavior, not from bad prompts.
Put dollars on it. A pipeline making 5,000 calls a day at 800 output tokens per call, compressible to 150, wastes 650 tokens per call — 3.25 million tokens a day. At Sonnet 5.5 output rates ($10/MTok), that is $32.50 a day, roughly $975 a month of verbosity. On Opus 5.5 ($20/MTok output), it doubles to about $1,950 a month. Same answers, same models — the only difference is output discipline.
The Output Compression Toolkit
The output compression toolkit.
1. Explicit word and token caps in the prompt. “Respond in 150 words or fewer” is the single most effective instruction for reducing output tokens. Claude respects tight limits. “Be concise” does not work reliably. “150 words maximum” does. For JSON outputs: “Respond with only valid JSON, no markdown fences, no explanation.” Every word of instruction about format is recovered 10x in output reduction across repeated calls.
2. Structured output schemas. When you need structured data, define the exact JSON schema. Claude stops generating prose and fills fields. You get exactly what you specified and nothing more. The token reduction versus free-form responses is typically 40-70% for equivalent information content.
# Free-form -- verbose, unpredictable length
prompt_verbose = "Summarize the key points of this article and their implications."

# Structured -- tight, predictable, cheaper
prompt_structured = """Extract from this article:
{"headline": "string", "key_points": ["string", "string", "string"], "sentiment": "positive|neutral|negative"}
Respond with valid JSON only. No explanation."""
3. Role-based compression priming. System prompt framing shapes output length. “You are a precise technical writer who values brevity. Never restate the task. Deliver the answer directly.” produces consistently shorter outputs than a neutral system prompt. This is prompt engineering for token economics, not just quality.
4. Chained micro-tasks over monolithic requests. Instead of asking Claude to research, analyze, synthesize, and format in one prompt, chain smaller requests. Each call is scoped to one task with tight output constraints. Total tokens across the chain are often lower than a single unconstrained request, and intermediate outputs are cacheable — pairing naturally with the prompt caching strategy.
The Notion Second Brain Application
The operational implementation at Tygart Media runs this pattern at pipeline level. The Notion second brain eliminates the need for Claude to generate background context — it already exists in structured form. Extractions from Notion arrive as pre-formatted knowledge blocks. Claude’s task is synthesis over existing structured data, not open-ended research and explanation. Output prompts are scoped: “Given this structured data, write a 400-word section for [topic]. No preamble, no conclusion, begin directly with the first point.” The output is a concentrated slice — dense, usable, billable at a fraction of what free-form generation costs for equivalent value.
Measuring Compression Effectiveness
Measuring compression effectiveness.
Track output_tokens in your API responses. Log them per prompt template. Identify your highest-output templates and run compression interventions — tighter word caps, structured formats, role priming. The target is information density: insight delivered per output token, not raw token count. A 500-token output with 3 actionable insights beats a 200-token output with 1. Compression discipline is about removing the scaffolding (preambles, hedges, recaps) while preserving the load-bearing structure (insight, data, instruction).
max_tokens as a Hard Ceiling
Set max_tokens conservatively in your API calls. This is your financial guardrail, not just a model parameter. For classification tasks: 50 tokens. For short summaries: 200 tokens. For structured JSON extraction: 500 tokens. For article drafts: 1,500-2,000 tokens. Leaving max_tokens at a high default on every call is leaving a cost ceiling unjustifiably high — current Claude models support up to 128,000 output tokens, so the ceiling you are not setting is enormous. Claude will rarely hit the ceiling on constrained tasks, but it prevents runaway generation on edge-case inputs that can quietly inflate your bill.
Output compression FAQ
Does output compression hurt answer quality? Not when done right — compression removes scaffolding (preambles, hedges, recaps), not substance. The techniques above constrain format and length, never information content. If an answer needs depth, scope the depth explicitly (“give three reasons, one sentence each”) rather than leaving length open.
How does output compression interact with prompt caching? They stack on opposite sides of the bill: caching discounts repeated input, compression shrinks output. Chained micro-tasks (technique 4 above) do both — intermediate outputs become cacheable inputs for the next call.
Does the Batch API change the compression math? The Message Batches API takes 50% off output tokens too, so the dollar savings per token are halved — but the percentage savings are identical, and shorter outputs still mean faster batch turnaround.
What is the single highest-leverage change? Explicit word caps in the prompt (“150 words maximum”). One sentence, no tooling, and Claude respects it.
Price your own pipeline from the Anthropic Console — API keys, billing, and a token-to-dollar cost estimator for your actual usage.
Every dollar you spend on Claude at full synchronous price is a dollar you’re overpaying for non-urgent work. Anthropic’s Message Batches API delivers a flat 50% discount on both input and output tokens — the same models, the same quality, half the price — with one constraint: results arrive asynchronously, typically within 24 hours.
Standard Sonnet 4.6 pricing: $3.00 input / $15.00 output per million tokens. Batch Sonnet 4.6: $1.50 input / $7.50 output. Run 1,000 article drafts synchronously and you’re spending full rate on every one. Run the same batch overnight and you cut the bill in half — no model quality change, no output degradation, just a different delivery mechanism.
Model
Sync Input
Sync Output
Batch Input
Batch Output
Haiku 4.5
$1.00/M
$5.00/M
$0.50/M
$2.50/M
Sonnet 4.6
$3.00/M
$15.00/M
$1.50/M
$7.50/M
Opus 4.7
$5.00/M
$25.00/M
$2.50/M
$12.50/M
What Qualifies as Non-Urgent Work
What qualifies as non-urgent work.
The honest question is not “does this need to be fast?” — it’s “does this need to be synchronous?” Most content pipelines, data enrichment tasks, classification jobs, and bulk translation runs have no real-time dependency. The user is not waiting at a keyboard. The output feeds a queue. The 24-hour window is irrelevant. Candidates include: nightly article drafts, SEO metadata generation for large post archives, batch product description rewrites, email personalization at scale, sentiment tagging across historical data, bulk summarization of documents or transcripts.
What does not qualify: customer-facing chat, real-time code completion, any workflow where a human is actively waiting for a response.
The API Pattern
import anthropic

client = anthropic.Anthropic()

# Build your batch — each request is a full message payload
requests_list = [
    {
        "custom_id": f"article-{i}",
        "params": {
            "model": "claude-sonnet-4-6",
            "max_tokens": 2000,
            "messages": [
                {"role": "user", "content": f"Write a 500-word expert summary of: {topic}"}
            ]
        }
    }
    for i, topic in enumerate(topics)
]

# Submit the batch
batch = client.messages.batches.create(requests=requests_list)
print(f"Batch ID: {batch.id} | Status: {batch.processing_status}")

# Poll until complete
import time
while True:
    status = client.messages.batches.retrieve(batch.id)
    if status.processing_status == "ended":
        break
    time.sleep(60)

# Retrieve results
for result in client.messages.batches.results(batch.id):
    custom_id = result.custom_id
    if result.result.type == "succeeded":
        text = result.result.message.content[0].text
        print(f"{custom_id}: {text[:100]}...")
Combining Batch API With Prompt Caching
Combining Batch API with prompt caching.
These two discounts stack. If your batch requests share a large system prompt — a style guide, a knowledge base, a persona definition — mark that block with cache_control: {"type": "ephemeral"}. Anthropic caches it across all requests in the batch that hit the same prompt prefix. You pay input rate on the first hit and cache read rate (roughly 10% of input rate) on every subsequent hit. A 10,000-token system prompt shared across 500 batch requests: you pay full rate once, cache rate 499 times, and you are already on batch pricing for all output tokens. The compounding effect is significant.
Structuring Your Pipeline Around Batch Windows
The practical architecture: identify every Claude call in your current workflow that has no real-time dependency. Move those calls behind a queue. Set a nightly cron that drains the queue into a batch submission at 11 PM. Results are ready by morning. Your synchronous Claude budget drops to customer-facing interactions only — often 20-30% of total volume for content and data operations teams.
Rate limits are separate for batch vs. synchronous traffic, so batch jobs do not compete with your real-time usage. That is a free operational benefit on top of the price cut.
Error Handling at Scale
Batch results include a result.type field: succeeded, errored, or canceled. Always iterate the full result set and collect errored custom_ids for resubmission. At scale — thousands of requests — you will see occasional errors. Build the retry loop into your pipeline from day one rather than discovering it when 3% of a 10,000-request batch silently fails.
The Honest Tradeoff
Batch API is a discipline, not a feature. It requires you to think about your Claude usage in terms of urgency tiers, not just prompt quality. Teams that adopt it consistently cut their Claude bills by 30-50% on total spend — not because every call moves to batch, but because the non-urgent majority does. Combined with model routing (Haiku for triage, Sonnet for batch drafts, Opus only for synchronous high-stakes reasoning), it is the highest-leverage cost lever available in the Anthropic stack today.