Tag: Snohomish County Market Report

  • Snohomish County Housing Market April 2026: Inventory Up 58%, Median Drops to $750K — A Complete Everett Buyer and Seller Guide

    Snohomish County Housing Market April 2026: Inventory Up 58%, Median Drops to $750K — A Complete Everett Buyer and Seller Guide

    Quick answer: The Northwest Multiple Listing Service’s official April 2026 Market Snapshot shows Snohomish County with the largest year-over-year inventory growth of any county in the 23-county NWMLS region — a 58% jump in active listings (1,325 in April 2025 to 2,094 in April 2026). The county’s median sales price ticked down for the first time in this cycle to $750,000 (-0.7% YoY), closed sales fell 15%, but pending sales rose 2% across the NWMLS region. Average days on market: 35. Months of supply: about 2 — still technically a seller’s market, but the slowest sellers’ market in years. Mortgage rates around 6.45% are doing most of the work.

    If you’ve been following Snohomish County’s housing market month-to-month, the official NWMLS April 2026 numbers — published May 7 — confirm a story that’s been building since late winter: the county is unwinding from the most extreme inventory shortage in modern memory, but the unwind is happening through inventory growth and price softening, not through a transaction surge. The most useful way to read April: more homes available, more buyers writing offers, fewer of those offers turning into closings.

    This is the comprehensive Everett-anchored guide to what NWMLS reported, what it means for buyers and sellers in the city right now, and how the county compares to the rest of the region.

    The Headline: 58% Inventory Surge — Largest in the NWMLS Region

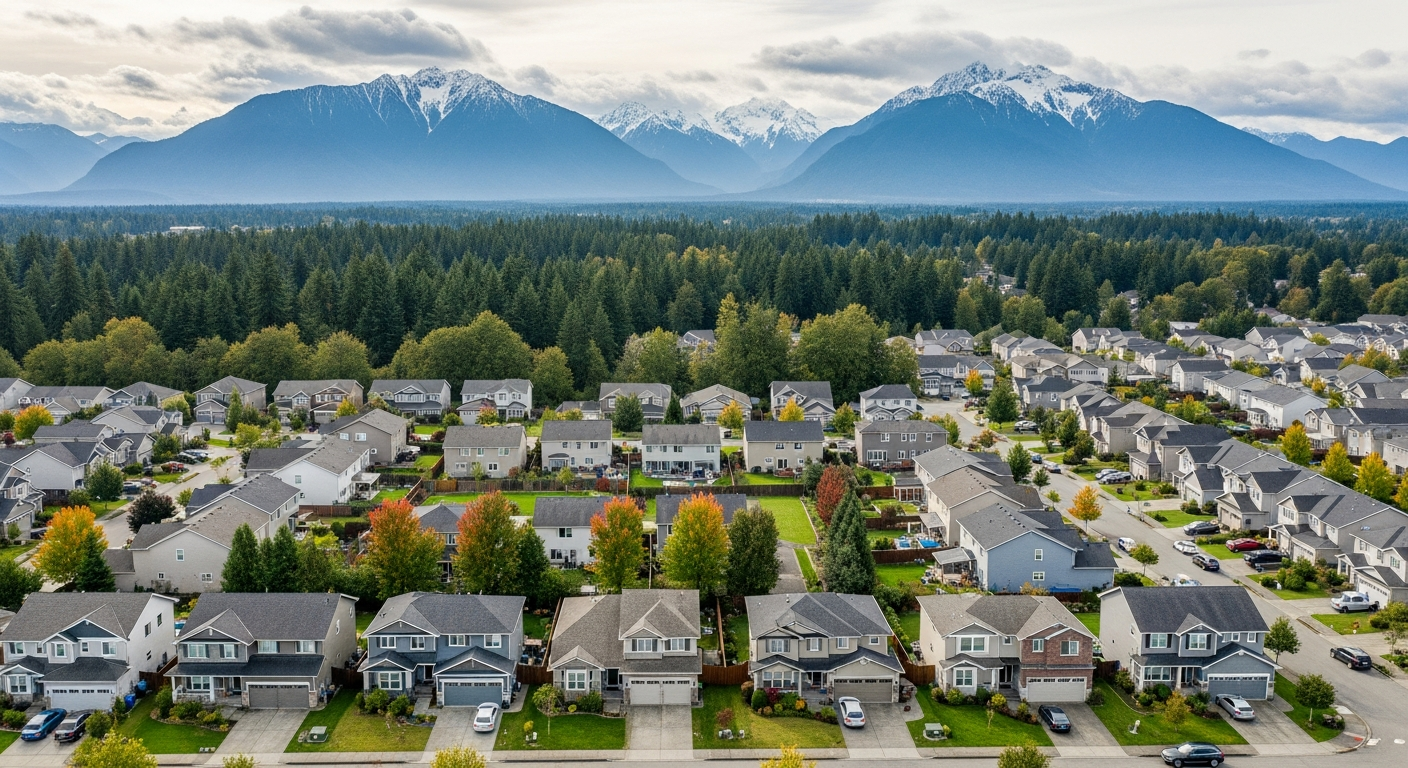
    Active residential listings in Snohomish County rose from 1,325 in April 2025 to 2,094 in April 2026 — a 58% year-over-year increase that led every county in the NWMLS coverage area. The next-closest counties were Walla Walla (+54%), Okanogan (+52.4%), Skagit (+44.5%), and Thurston (+43.3%). King County, by comparison, saw a smaller percentage jump because its inventory was less depleted to begin with.

    This isn’t a one-month spike. The March 2026 NWMLS report showed Snohomish County inventory up 51.8% year-over-year. The Madrona Group’s April Sales Activity Intensity index registered 54.9%. April’s official number — 58% — confirms the trend is accelerating, not normalizing.

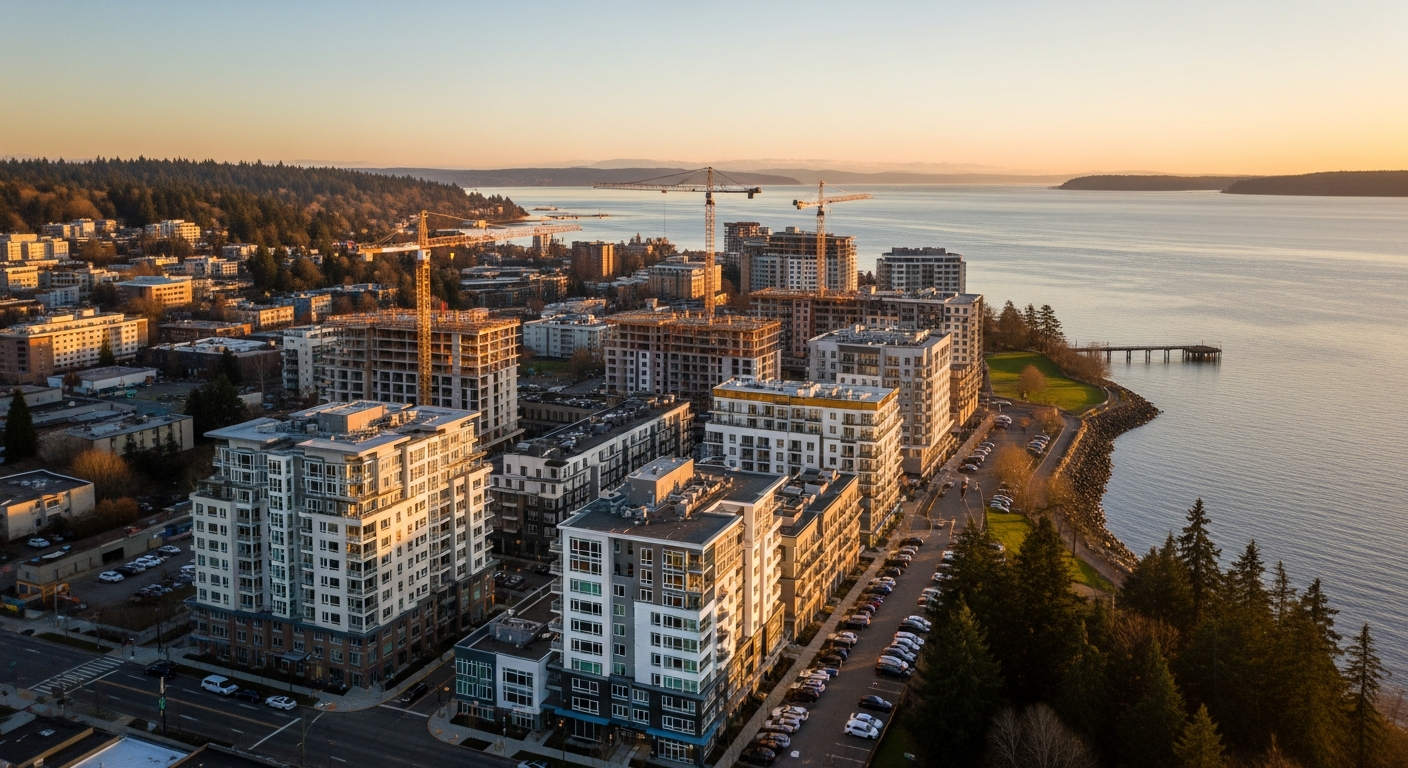
    For Everett specifically, the inventory growth is concentrated in the parts of the city where homes have been slowest to come back to the market: established single-family neighborhoods that owners have held through the rate-cycle freeze, and certain townhome and condo segments that depended on the lowest-rate refi window of 2020-2021.

    The Price Picture: First Annual Decline of the Cycle

    The Snohomish County median sales price came in at $750,000 in April 2026, down slightly from $755,500 in April 2025 — a -0.7% year-over-year change. Modest in size but meaningful in shape: this is the first time in the current cycle that the county’s median has moved down on an annual basis rather than up.

    Snohomish County still ranks third-highest among NWMLS counties for median price, above the NWMLS-wide median, and above where many forecasters expected the county to settle given the mortgage-rate environment. Prices haven’t collapsed. They’ve quietly, gradually softened.

    The on-the-ground translation in Everett: sellers who priced aggressively six months ago are finding that buyers are no longer obligated to stretch. That’s not a market crash — it’s the structural correction of a market that had become unsustainably tight on the listing side.

    Closed Sales Down 15%, Pending Sales Up 2%

    Here’s the tension that defines the spring 2026 Snohomish County market: closed sales dropped 15% year-over-year — 104 fewer completed transactions than April 2025. That sounds alarming until you read the other side of the ledger: pending sales (homes under contract but not yet closed) rose 2% year-over-year across the NWMLS region.

    The takeaway: buyers are writing offers. They’re going under contract. What they’re doing less of is reaching the closing table. The most consistent explanation is the mortgage-rate environment.

    The 6.45% Rate and the Lock-In Effect

    Mortgage rates sitting at 6.45% are not prohibitive — millions of households have closed mortgages at higher historical rates — but they’re high enough that some buyers, particularly those relying on proceeds from a previous home sale to qualify, are pausing at the final step. The arithmetic of trading a sub-3% mortgage from 2020-2021 for a 6.45% mortgage on a new property is doing real damage to the resale pool.

    This is the well-documented “lock-in effect”: homeowners who refinanced at 3% in 2021 are choosing to stay put rather than take on the new monthly payment. That suppresses the resale supply pipeline at the same time as some new sellers (relocations, downsizing, life changes that override the rate calculation) are listing — which is why the inventory count rises while the buyer-seller flow remains constrained.

    35 Days on Market and 2 Months of Supply

    Average days on market in Snohomish County came in at 35 days in April 2026, up from prior cycles when well-priced homes sold in single-digit days. That’s slow by recent memory but still fast by historical norms.

    Months of supply — the time it would take to sell every active listing at the current pace — sits at roughly 2 months in the county. The textbook definition of a balanced market is 4-6 months. Below 4 is generally a seller’s market; above 6 is generally a buyer’s market. At 2 months, Snohomish County is technically still a seller’s market — the slowest seller’s market in years, but a seller’s market nonetheless.

    For Everett-specific micro-markets — downtown condos, north Everett historic neighborhoods, south Everett single-family on the Mukilteo/Boeing-commute corridor — the months-of-supply figure varies. The 2-month county-wide number is the average; some segments are tighter, some are looser.

    How Snohomish County Compares to the Region

    The NWMLS region covers 23 counties across Washington state. Across that footprint, the same general dynamic holds — inventory up, closings down, pendings flat to up — but Snohomish leads on the inventory surge specifically. King County, which absorbs much of the region’s discretionary buying power, saw a smaller percentage inventory jump because it was working from a higher base.

    For an Everett buyer comparing options, the county-by-county data points to one structural fact: Snohomish has more new inventory available right now, relative to the prior year, than almost anywhere else in the NWMLS footprint. For a seller, it points to the inverse: the buyer pool has more competing options than at any point since the pre-2020 market.

    What April 2026 Means for Buyers in Everett Right Now

    Three actionable reads:

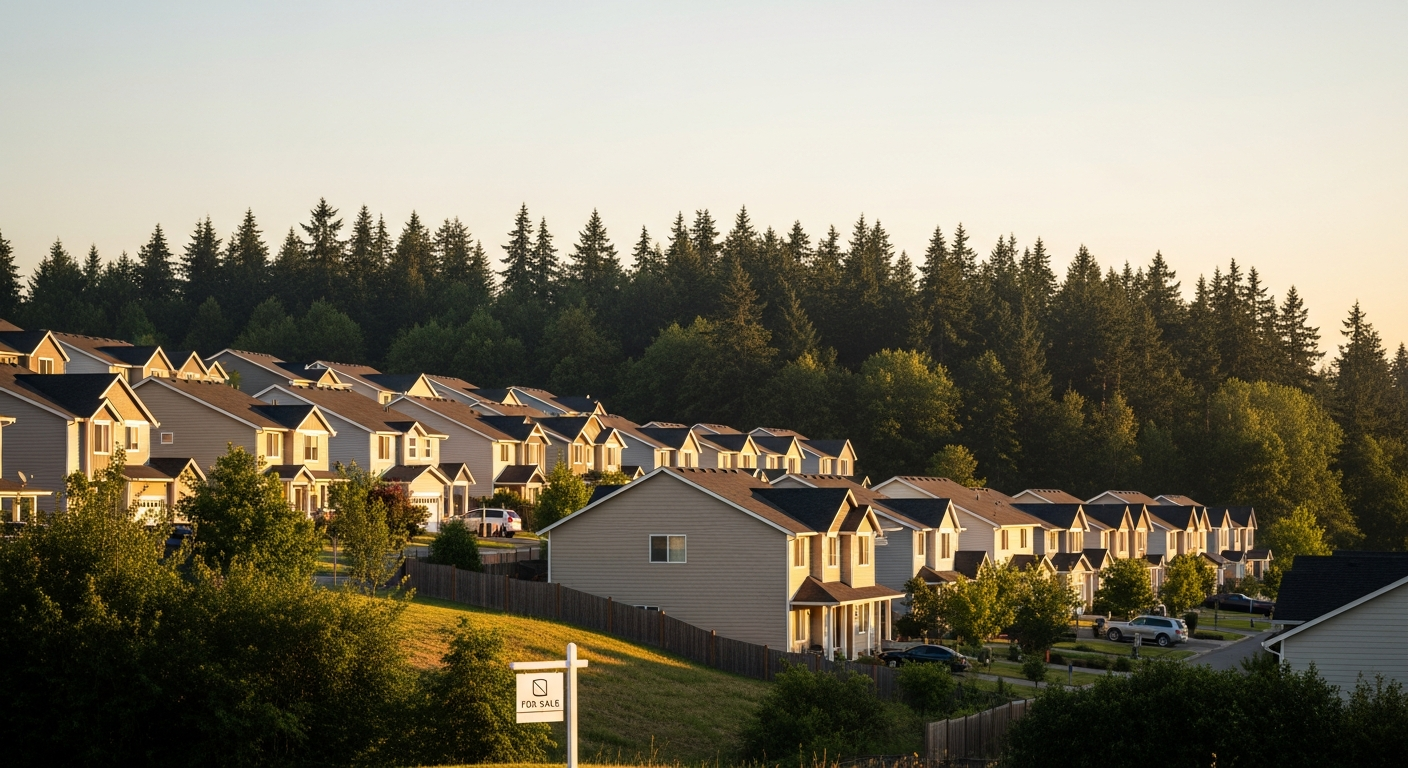
    Selection has improved meaningfully. 2,094 active listings is not 2018-era inventory but it’s more selection than buyers have had in years. The compromises that defined the 2021-2023 buyer experience (multiple offers within hours, escalation clauses, waived inspections) are negotiable in many price brackets again.

    Negotiating leverage has shifted slightly toward the buyer. A 35-day average DOM and a 2-month supply means well-priced homes still sell, but overpriced homes sit. Buyers can ask for inspections, ask for repairs, and ask sellers to absorb closing costs — none of which were viable in 2021-2022.

    The rate-payment math is what it is. 6.45% is not going meaningfully lower in the near term per most forecasters’ published outlooks. Buyers waiting for a 5% mortgage may wait a long time. Buyers who can carry a 6.45% payment now are buying into the most negotiable Snohomish County market in years.

    What April 2026 Means for Sellers in Everett Right Now

    The first thing to absorb: the comp set you’re pricing against has changed. A home that would have drawn three offers in 48 hours in spring 2022 may now sit for 30+ days if priced to its 2022 ceiling. Pricing to the current market matters more than it has in the entire post-pandemic cycle.

    The second: presentation matters again. Inspections, light staging, professional photography, and a price that opens with room to negotiate are back in the playbook. Buyers are choosing among 2,094 active listings, not five.

    The third: pendings are up 2% across the region. Buyers are out there. The path to sale is just longer than it was — fewer impulse offers, more inspection-contingent deals.

    Where This Connects to the Broader Everett Story

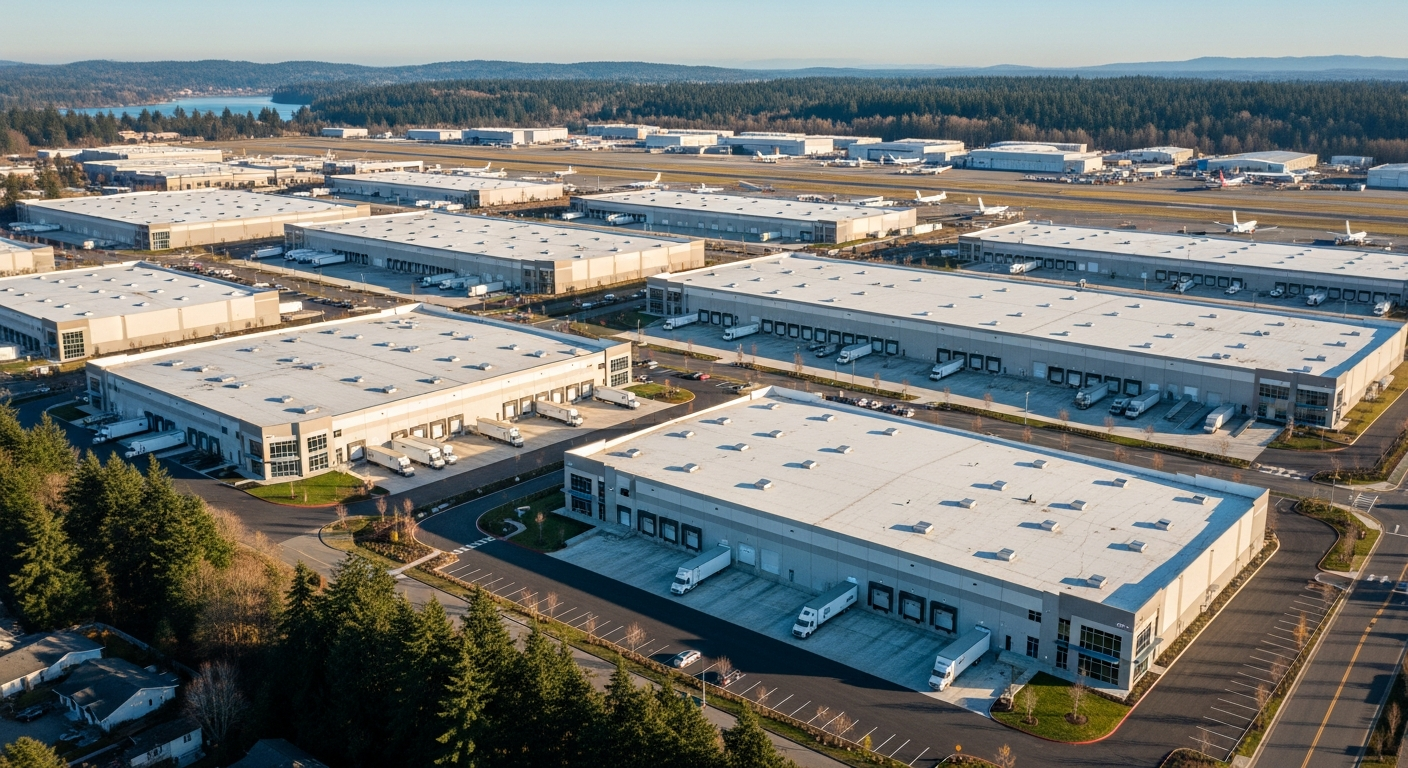
    The April 2026 NWMLS data sits inside a larger Everett housing context: the Boeing 737 North Line ramp this summer (covered in our Boeing North Line workers’ housing guide), the FF(X) frigate program timeline at NAVSTA Everett (covered in our Navy PCS housing guide), and the Snohomish County apartment market that hit $640M in 2025 sales. All of those ripple into the for-sale market eventually.

    For the broader analytical context on Everett’s three-submarket housing story (citywide, downtown, NW Everett, 98208), see our Everett’s Three Housing Markets deep-dive.

    Frequently Asked Questions

    Is the Everett housing market crashing?

    No. A 0.7% annual median price decline and a 2-month supply count is a gradual softening, not a crash. The Snohomish County market is still technically a seller’s market by months-of-supply standard. What’s happening is a controlled unwind from extreme tightness, not a collapse.

    Why did closed sales drop 15% if pending sales rose?

    Closed sales reflect deals that finalized in April 2026. Pending sales reflect deals that went under contract in April 2026 (and may close in May or June). The 15% closed-sales drop reflects deals that fell through in March or April at the final step — most consistently because of mortgage-rate-driven affordability re-checks at the underwriting stage.

    What’s the median price in Everett specifically?

    The $750,000 figure is the Snohomish County median. Everett-specific medians vary by neighborhood, with downtown condos and Casino Road corridor segments often below the county median and Northwest Everett, View Ridge, and waterfront-adjacent neighborhoods often above it.

    When will mortgage rates come down?

    Most major forecasters expect gradual easing into 2027 rather than a sharp drop. Buyers waiting for a 5% mortgage are likely waiting through at least one more housing cycle.

    Should I buy now or wait?

    That’s a personal-finance question rather than a market-timing question. The market right now offers more selection and more negotiating leverage than it has in years; the rate environment is what it is. If you can carry the payment at 6.45% and you’d be choosing among more options than recent buyers had, the timing case is reasonable. If you’d be stretching at the rate, waiting may make sense.

    Why is Snohomish County’s inventory up more than King County’s?

    Snohomish County’s inventory was more depleted in 2024-2025, so the percentage jump back is mathematically larger. King County never bottomed out as severely, so its recovery looks smaller in percentage terms even though the underlying dynamic is similar.

    Where can I see the original NWMLS report?

    The Northwest Multiple Listing Service publishes the monthly Market Snapshot through its official channels. The April 2026 data was released May 7. Local real estate brokers also typically post NWMLS-derived charts within days of release.

  • Relocating to Everett in 2026: What April’s Housing Market Means for People Moving to Snohomish County Right Now

    Relocating to Everett in 2026: What April’s Housing Market Means for People Moving to Snohomish County Right Now

    Quick answer for people relocating to Everett: The April 2026 NWMLS data confirms Everett is the most negotiable Snohomish County market in years. 2,094 active listings (+58% YoY), median price $750,000 (-0.7%), average days on market 35, and about 2 months of supply. Buyer leverage on inspections, repairs, and closing-cost help is back. Mortgage rates around 6.45% are the binding constraint — not inventory or list prices. If you’re moving here in 2026, the structural picture is more selection, slower pace, and more room to negotiate than the Everett buyer experience of the last four years.

    If you’ve been watching the Snohomish County housing market from another city or state and trying to decide whether 2026 is the year to commit, the official April 2026 NWMLS Market Snapshot is the most useful single data point you’ll get. Released May 7, the report shows Snohomish County leading the entire 23-county NWMLS region in inventory growth — meaning Everett, the county’s largest city, is one of the most newly-negotiable real estate markets in Washington state right now.

    This is the relocation-focused read on what those numbers mean in practice for someone making a move to Everett this spring or summer.

    You Have More Selection Than Recent Movers Did

    The defining feature of the Everett buyer experience from 2021 through 2024 was scarcity. Active listing counts in Snohomish County hit lows that forced buyers into multiple-offer situations within 24 hours of listing, escalation clauses against unseen competing bids, and waived inspections to win the home. That market is over for now.

    April 2026’s 2,094 active listings in Snohomish County (up from 1,325 in April 2025) is the most selection buyers have had in years. Everett’s share of that inventory specifically — single-family in the established neighborhoods, downtown condos at the top of the cycle’s correction, and townhomes in the I-5 corridor — is materially higher than what new arrivals encountered in any of the last four spring markets.

    For a relocator, this means: you can almost certainly tour the type of home you actually want, in the neighborhood you actually want, within the price band you actually have. That was not true in 2022.

    The $750,000 Median Is the Number to Anchor To

    Snohomish County’s April 2026 median sales price was $750,000. The county is the third-most-expensive in the NWMLS region — above the NWMLS-wide median, above where many forecasters expected — but it’s also the first time in this cycle the median has moved down on an annual basis.

    What this means for someone moving from another market:

    • If you’re coming from King County (Seattle, Bellevue, the Eastside), Everett still represents a meaningful price discount per square foot, with materially shorter commutes than several King County exurbs.
    • If you’re coming from another Washington county (Pierce, Thurston, Whatcom), Everett is more expensive than your origin market, and the $750K median anchor is the most useful comparison point.
    • If you’re coming from out of state (California is the most common origin for Snohomish County movers), Everett offers most of the lifestyle benefits of the Puget Sound metro at a meaningful discount to King County’s medians, with direct access to Boeing/aerospace, Naval Station Everett, and the Sound Transit Link extension that’s coming north over the next decade.

    Days on Market and Months of Supply

    Average days on market in Snohomish County: 35 days. Months of supply: about 2 months.

    For a relocator, the practical effect of those two numbers together is that you can usually:

    • Tour a home, sleep on it, and write the offer on day 2-4 without watching it sell to someone else in 12 hours
    • Include an inspection contingency without putting yourself out of contention
    • Ask for repairs or closing-cost help in negotiation without having the offer immediately rejected
    • Time your offer to your relocation timeline rather than the market’s tempo

    None of this was a given in the 2021-2023 Snohomish County buyer experience. It is a given again now.

    The Rate Environment Is the Binding Constraint, Not Inventory

    Mortgage rates around 6.45% are the dominant variable in any 2026 buyer’s payment calculation. Inventory is no longer the binding constraint; the rate is. For a relocator, this is actually good news on the negotiation side — it means competition for the home you want is muted.

    Run the numbers honestly. A $750,000 home with 20% down and a 6.45% 30-year mortgage produces a principal-and-interest payment around $3,775/month before property tax, insurance, and HOA. Snohomish County property tax adds roughly $600-$750/month on a $750K assessment depending on the specific levies in your address; insurance and HOA vary. The all-in payment lands somewhere around $4,500-$5,000/month for a median-priced home.

    If those numbers are workable on your relocation income, the timing case is good. If they’re stretching, waiting for a meaningful rate decline (most forecasters project gradual easing into 2027 rather than a sharp drop) may make more sense than buying at the edge of affordability.

    Where Relocators Tend to Land in Everett

    Different origin profiles tend to land in different Everett neighborhoods:

    • Northwest Everett (Rucker Hill, Bayside, North Broadway) — the historic neighborhood of choice for relocators who want walkability, downtown access, and Victorian/Craftsman character. Above the county median price.
    • Valley View / Sylvan Crest / Larimer Ridge — south-end family neighborhoods with newer construction, top-rated schools in some attendance zones, and easier I-5 commute access.
    • Casino Road corridor and South Everett — more affordable per square foot, denser community amenities through Connect Casino Road and similar networks, and shorter commute to Paine Field for Boeing/Aerospace workers.
    • Downtown Everett condos — the smallest segment but the most price-corrected. Walkable to Hewitt Avenue restaurants, the Historic Everett Theatre, and the Everett Station transit hub.

    For a deeper neighborhood-by-neighborhood read, see our Three Housing Markets guide and our Casino Road neighborhood deep-dive.

    The Sound Transit Link Calculation

    One factor most relocators underweight: Sound Transit’s Link light rail extension to Everett is in active planning, with an unresolved set of routing scenarios that could put a station near downtown Everett, near Paine Field, or both. That’s covered in detail in our Sound Transit’s Everett Link Extension guide. For a relocator with a 10+ year horizon, neighborhoods near anticipated future stations are worth modeling into the buy decision.

    Schools, Commute, and Comparison to Seattle

    Everett Public Schools (one of the larger districts in the state) has a mix of attendance zones; serious relocators with school-age kids should pull specific school ratings rather than rely on district-wide aggregates. The Mukilteo School District (covering parts of south Everett) often draws relocators with school-prioritized criteria.

    Commute math: from central Everett to downtown Seattle is approximately 30 miles. Driving in peak hours can run 60-90 minutes; Sounder North commuter rail (currently running, with future-of-service questions) covers a portion of the route faster. Bus options through Community Transit and Sound Transit also cover part of the corridor.

    For relocators specifically comparing Everett vs. Seattle on the affordability axis: Everett’s $750K median sits well below Seattle’s median sales price, the home you can buy in Everett is typically larger and newer than the home you can buy in Seattle at the same price, and Snohomish County property tax rates are generally lower than King County’s.

    Frequently Asked Questions

    Is now a good time to buy in Everett if I’m relocating?

    The April 2026 NWMLS data points to a market with materially more selection and negotiating leverage than the previous four years. Whether it’s a good time for you specifically depends on rate-affordability math and your relocation timeline. The market itself is more buyer-friendly than it has been in years.

    Should I rent first or buy immediately when I arrive?

    A growing case for renting first in 2026: Snohomish County’s apartment market is well-supplied (covered in our $640M apartment sales analysis), and rentals are giving relocators a chance to tour neighborhoods on the ground before committing. The opportunity cost of waiting is low because the for-sale market is the most negotiable it’s been in years — meaning the inventory will likely still be available three to six months from now.

    How does Snohomish County compare to King County for relocators?

    Lower median price ($750K vs. King County’s higher figure), more inventory growth (+58% YoY vs. King’s smaller jump), and more space-for-the-price. The trade-off is longer commute to Seattle’s job centers, though the calculus changes for buyers working at Boeing, Paine Field aerospace employers, NAVSTA Everett, or in Snohomish County government and healthcare.

    What’s the cheapest Everett neighborhood to land in?

    South Everett (Casino Road corridor) and parts of the I-5 corridor offer the most affordable per-square-foot entry. The trade-off is generally older housing stock and longer commute to downtown Everett. Northwest Everett, Valley View, and waterfront-adjacent neighborhoods carry the highest per-square-foot premium.

    Is the housing market going to keep softening?

    The current trend (inventory rising, prices flat to slightly down) is sustained by the rate-lock-in effect. As long as mortgage rates stay around 6.45% and the gap between current rates and 2020-2021 refinance rates remains wide, the structural pattern is likely to continue. Sharp rate drops would change the dynamic; gradual rate easing would not.

    Where can I tour neighborhoods virtually before flying in?

    Most Everett listings on the NWMLS-fed sites (Redfin, Zillow, broker sites) include video walk-throughs and 3D tours. For neighborhood-level context, our Three Housing Markets guide and our individual neighborhood profiles cover the day-to-day character of each area.

  • Snohomish County Leads the Region in Inventory Growth: What NWMLS’s Official April 2026 Numbers Mean for Everett Buyers and Sellers

    Snohomish County Leads the Region in Inventory Growth: What NWMLS’s Official April 2026 Numbers Mean for Everett Buyers and Sellers

    Q: Is inventory really up 58% in Snohomish County?
    A: Yes — that’s the official NWMLS figure for April 2026. Active listings rose from 1,325 to 2,094 year-over-year, the largest percentage increase of any county in the 23-county NWMLS region. More homes are available than at any point in recent memory, but high mortgage rates are keeping a lid on closed sales.

    By every measure that matters to people trying to buy or sell a home in Everett right now, April 2026 delivered a split verdict. More homes hit the market than at any point in recent memory — Snohomish County added inventory at a rate of 58% year-over-year, the fastest growth in the entire NWMLS region, which spans 23 counties across Washington state. But fewer homes actually changed hands, and the median price ticked down for the first time in years, suggesting that the inventory flood hasn’t yet turned into a buying spree.

    The official numbers came from the Northwest Multiple Listing Service, which published its April 2026 Market Snapshot on May 7. Here’s what they show for Snohomish County — and what they mean for anyone watching Everett’s real estate market.

    The headline number: 58% more homes available

    Active listings in Snohomish County jumped from 1,325 in April 2025 to 2,094 in April 2026 — a 58% year-over-year increase that led every county in the NWMLS coverage area. Walla Walla (+54%), Okanogan (+52.4%), Skagit (+44.5%), and Thurston (+43.3%) were the next closest, but none matched Snohomish County’s pace.

    For context, we’ve been tracking Snohomish County inventory steadily this year: in March, the NWMLS showed a 51.8% inventory surge; the Madrona Group’s April Sales Activity Intensity report came in at 54.9% per our earlier housing market update. April’s official NWMLS count shows the trend isn’t just continuing — it’s accelerating. Buyers have more to choose from than they have in years.

    The price picture: flat to slightly down

    The median sales price in Snohomish County came in at $750,000 in April 2026, down slightly from $755,500 in April 2025. That’s a modest -0.7% decline year-over-year, but it’s notable because it’s the first time in recent cycles that prices have moved down on an annual basis rather than up.

    At $750,000, Snohomish County ranks third-highest among NWMLS counties — above the NWMLS-wide median, and above where many buyers expected the county to be given the economic uncertainty of the past year. Prices haven’t collapsed. They’ve quietly, gradually softened.

    What does that mean on the ground in Everett? Sellers who listed with aggressive pricing expectations six months ago are finding that buyers are no longer obligated to stretch. It doesn’t mean deals — it means more honest conversations about what homes are actually worth.

    Fewer buyers are closing, but more are going under contract

    Here’s the tension that defines this spring market: closed sales in Snohomish County dropped 15% year-over-year — 104 fewer completed transactions than April 2025. That sounds alarming until you see the other side of the ledger.

    Pending sales (homes under contract but not yet closed) were up 2% year-over-year across the NWMLS region. Buyers are active. They’re writing offers. They’re going under contract. What they’re doing less of is getting all the way to closing.

    The most likely explanation is the mortgage rate environment. Rates sitting at 6.45% are not prohibitive, but they’re high enough that some buyers — particularly those relying on proceeds from a previous sale to qualify — are pausing at the final step. The “lock-in effect” is real: homeowners who refinanced at 3% in 2021 are still choosing to stay put rather than take on a 6.45% mortgage on a new purchase, which suppresses the resale pool even as the overall inventory count rises.

    35 days on market and 2 months of supply — still not a buyer’s market, technically

    Average days on market in Snohomish County came in at 35 days in April 2026. That’s longer than the sub-20-day paces we saw during peak 2021-2022 frenzy, but still far from the 60-90 day markets that characterized the 2008-2012 correction.

    Supply stands at 2.0 months for residential resale — a number that still technically favors sellers (a balanced market is generally considered 4-6 months). But 2.0 months is a world away from the 0.5-0.7 month readings that produced the multiple-offer chaos of 2021-2022. Buyers have real negotiating power for the first time in years. They just have to qualify.

    What this means for the Everett market specifically

    Everett’s market has been one of the most interesting in the county to watch this year. We’ve covered the three-price-band split — Downtown and NW Everett moving in different directions from southeast zip codes — and the rental market’s softening, with apartment rents down 2% year-over-year to an average of $1,849 per month.

    The NWMLS April data adds a layer: even as more homes come available, Everett buyers are navigating a market where the homes that sell quickly are the ones priced correctly from day one. With inventory at 2.0 months, sellers have less margin for optimistic overpricing than they did even six months ago.

    For buyers, the calculus is real: more options, lower median, but 6.45% rates eating into purchasing power. A $750,000 home at 6.45% with 20% down carries a monthly principal-and-interest payment of approximately $3,770 — a number that limits who can comfortably qualify without significant equity or income.

    For the Everett development market, the housing data matters because it sets the backdrop for the 300-plus waterfront apartments coming in the Millwright District Phase 2, the Econo Lodge conversion of 124 studio apartments at 9602 19th St SE, and other multifamily projects in the pipeline. Softer for-sale absorption means more households staying in the rental pool — which is actually a tailwind for Waterfront Place’s apartment occupancy (currently at 95%) and for the new units coming to market in 2026-2027.

    The Sounder North ending in 2033 and the Sound Transit May 28 board decision will add another data point to the transit-oriented development picture around Everett Station, with implications for what gets built and where.

    The takeaway for May 2026

    More homes. Slightly lower prices. Fewer completions, but steady demand going under contract. That’s the April 2026 picture in Snohomish County. It’s the most balanced spring market we’ve seen in years — not a buyer’s market, not a seller’s market, but something closer to a market where both sides have to come prepared and priced to the moment.

    The next NWMLS monthly release will cover May 2026 data, typically available in the first week of June. By then we’ll have the Sound Transit May 28 board decision on Everett Link, which will add one more long-term data point to the development pipeline around Everett Station and the waterfront.

    Frequently Asked Questions

    What is the current median home price in Snohomish County?

    The official NWMLS April 2026 median sales price in Snohomish County is $750,000, down slightly from $755,500 in April 2025.

    How much did housing inventory grow in Snohomish County?

    Active listings grew 58% year-over-year, from 1,325 to 2,094 — the largest inventory increase of any county in the 23-county NWMLS region for April 2026.

    How long are homes sitting on the market in Snohomish County?

    The average days on market in April 2026 was 35 days — longer than the sub-20-day pace of 2021-2022, but far from distressed-market territory.

    What is the current mortgage rate environment?

    As of April 2026, the NWMLS reports an average mortgage rate of 6.45% in the area, which is limiting the pool of buyers who can comfortably complete a purchase — even as more inventory becomes available.

    How many months of housing supply does Snohomish County have?

    Residential resale stands at 2.0 months of supply — technically still a seller’s market, but significantly improved for buyers compared to the 0.5-0.7 month readings of 2021-2022.

    Are home prices falling in Snohomish County?

    The official NWMLS April 2026 data shows Snohomish County median prices down 0.7% year-over-year ($750K vs. $755.5K in April 2025) — the first year-over-year decline in recent cycles. Prices are softening, not collapsing.

    Is it a buyer’s market in Snohomish County?

    Not technically — 2.0 months of supply still favors sellers in most definitions — but buyers have significantly more negotiating leverage than they’ve had in years. More choices, lower median, and sellers who are increasingly priced-to-sell rather than priced-to-wish.

  • For Everett Business Owners and Retail Tenants: What Snohomish County’s Tightest-in-Puget-Sound Market Means for Your 2026 Lease and Location Decisions

    For Everett Business Owners and Retail Tenants: What Snohomish County’s Tightest-in-Puget-Sound Market Means for Your 2026 Lease and Location Decisions

    You Are Operating in the Tightest Retail Market in Puget Sound

    If you own or operate a business in Everett — or if you’re looking to open one — you’re in the tightest retail market in the Puget Sound region. Snohomish County’s retail vacancy rate was 3.4% at year-end 2025, according to Kidder Mathews data. Seattle was at 4.0% and rising. Portland was at 4.8%. Your competition for the same quality commercial spaces is across the entire Puget Sound market, and Snohomish County is where they all want to be right now.

    Understanding that context changes how you think about leasing decisions. Here’s what the 2026 data means for your specific situation depending on where you are in the business lifecycle.

    If You Have an Existing Lease Coming Up for Renewal

    In a 3.4% vacancy market, your landlord knows they can fill your space if you leave. But they also know that finding a replacement tenant takes time, carries leasing commissions, and risks a gap period. You have more leverage at renewal than the vacancy number alone suggests — especially if you’re a quality tenant with a track record of on-time payments.

    The Q1 2026 softening data is your friend at the negotiating table. Vacancy is “creeping higher” and tenants are “growing more selective.” That trend gives you a factual basis for asking for concessions — tenant improvement allowances, free rent periods, or rate stabilization — that would have been harder to win 12 months ago. Renewals signed in mid-2026, while the market is softening but still tight, likely represent a better deal than renewals signed at the peak.

    If You’re Actively Looking for Space to Open or Expand

    At 3.4% vacancy, “available retail space in Everett” is not a long list. Move quickly when something becomes available that fits your requirements. The 60-year Bank of America corner on Colby and Everett Avenue is one high-visibility example of a space that came to market in early 2026 — that kind of prime downtown location in a sub-4% vacancy market gets attention.

    Emerging corridors to watch for lease opportunity:

    Waterfront Place at the Port of Everett

    The marina district’s restaurant and retail corridor is still being built out. Tenants who secured early positions in Waterfront Place locked in favorable terms in a less competitive moment. Pre-leasing for Millwright Phase 2 is now underway — that’s the next Port of Everett waterfront development and represents an opportunity to get in early on a corridor with strong long-term fundamentals. The full retail market guide covers the countywide context.

    Snohomish River Waterfront (Shelter Holdings)

    The riverfront development has ground-floor commercial vacancies in completed residential buildings. It’s an early-stage neighborhood — the grocery anchor is delayed to 2030 and the park doesn’t fully open until spring 2028. But for businesses that can build a residential customer base before the full retail program arrives, rents are likely more negotiable than in established Everett corridors. The riverfront business owners guide covers that specific opportunity and its risks in detail.

    Broadway and Hewitt Corridors Downtown

    Downtown Everett’s primary retail corridors continue to see turnover — both new openings and departures. Spaces in this zone benefit from the foot traffic of downtown workers, transit users at Everett Station, and the event audience from the performing arts venues. Competition for the best Broadway and Hewitt locations remains real.

    What the Q1 2026 Data Tells You About Timing

    Kidder Mathews’ Q1 2026 data (Registry Pacific Northwest, April 8, 2026) shows vacancy creeping higher and tenants growing more selective. This is a marginal softening from the extreme tightness of 2023–2025 — not a market shift. But timing matters for lease negotiations. A market that has been at 3.4% for three years and is beginning to soften is one where landlord patience for vacant space is starting to increase. That shifts negotiating dynamics slightly.

    If you’ve been waiting for a market moment that’s slightly more tenant-favorable before locking in a new location or renewal, mid-2026 may be that moment. The structural supply constraint in Snohomish County — almost no new retail being built — means the vacancy floor won’t drop dramatically. But the marginal improvement in negotiating position is real and may not persist.

    Frequently Asked Questions for Business Owners

    How tight is the Snohomish County retail market for new tenants?

    Very tight — 3.4% vacancy at year-end 2025 means roughly 96.6% of retail space is occupied. Available spaces move quickly and landlords have pricing power. Q1 2026 shows early softening, but the market remains landlord-favorable. Finding quality available space requires acting quickly and working with a local commercial broker.

    Should I renew my current Everett retail lease or look for new space?

    This depends heavily on your specific location and landlord relationship. The general market context (3.4% vacancy, beginning to soften slightly in Q1 2026) means renewal is typically the lower-friction path. If you’re renewing, negotiate now while vacancy is softening — you have slightly more leverage than you would have had 12 months ago. If you’re looking to relocate to a better location, be prepared to move quickly when your target space becomes available.

    Are there any retail opportunities in Everett where lease terms might be more flexible?

    The Snohomish River waterfront (Shelter Holdings) has early-stage ground-floor commercial availability where landlords may be more negotiable — the neighborhood hasn’t yet reached full density. Pre-leasing at Millwright Phase 2 represents an early-entry opportunity at the Port waterfront. These locations require patience on foot traffic; in exchange, lease terms may be more favorable than in established Everett corridors.

    What is the asking rent range for Everett retail space in 2026?

    Specific asking rents vary significantly by location, size, and condition. For current market rate guidance, consult a Snohomish County commercial real estate broker. Kidder Mathews, Colliers, and CBRE all track this market actively.

  • Snohomish County Has the Tightest Retail Market in Puget Sound: A Complete 2026 Guide to the 3.4% Vacancy Rate, Q1 Signals, and What It Means for Everett

    Snohomish County Has the Tightest Retail Market in Puget Sound: A Complete 2026 Guide to the 3.4% Vacancy Rate, Q1 Signals, and What It Means for Everett

    The Number That Defines Snohomish County Retail in 2026

    3.4 percent. That’s Snohomish County’s retail vacancy rate at the end of Q4 2025, per Kidder Mathews’ regional retail market data. To understand what that number means, you need the comparisons. The broader Seattle metro ended 2025 at 4.0% and was trending upward. Portland hit 4.8% retail vacancy in Q1 2026. King County’s retail vacancy was rising through the back half of 2025. By every regional measure, Snohomish County is the tightest retail market in Puget Sound.

    That’s been true for most of the past three years. And it’s driven by a simple physical reality: almost no new retail square footage has been built in Snohomish County. The last major new shopping center project was years ago. When no new space enters the market, vacancy stays low regardless of whether new tenants are eager to enter.

    What Q1 2026 Is Showing: The First Signs of Softening

    Kidder Mathews’ Q1 2026 retail market data, published by The Registry Pacific Northwest on April 8, 2026, introduced two new phrases into the Snohomish County retail conversation: vacancy is “creeping higher,” and tenants are “growing more selective.”

    These are measured words. This is not a distressed market. But they signal that the absolute floor-tight conditions of 2023–2025 are beginning to soften at the margins. More tenant options are emerging. Lease negotiation dynamics are shifting slightly toward the tenant side. Existing landlords still have strong occupancy and pricing power, but the trend line is worth watching.

    The Q1 2026 data comes against a backdrop of visible vacancy events in downtown Everett. The Bank of America branch on the corner of Colby Avenue and Everett Avenue — occupied for 60 years — went vacant in early 2026, leaving one of downtown’s most prominent corners empty. That one departure doesn’t make a market. But it’s the kind of anchor-tenant exit that shapes perceptions of downtown retail health.

    What This Means for Waterfront Place at the Port of Everett

    Waterfront Place — the Port of Everett’s emerging restaurant and retail district on the marina — opened several tenants in 2025 and 2026, including Jetty Bar & Grille and Marina Azul. The tight countywide market provides context for the pace of tenant recruitment: quality food and beverage operators in Snohomish County have options and are being selective. Waterfront Place competes with downtown Everett, Lynnwood’s retail corridors, and emerging Millwright District space for the same pool of prospective tenants.

    The advantage Waterfront Place has is differentiation — there is no other marina-adjacent dining district in Snohomish County. That uniqueness gives it a claim on tenants who want that specific positioning. The challenge is that the universe of tenants who specifically want a marina location is smaller than the universe of tenants who would consider any well-trafficked Everett location. The Waterfront Place complete guide covers the full tenant roster and what’s coming.

    What This Means for Millwright District Phase 2

    Millwright Phase 2 is the Port of Everett’s next major mixed-use development at the waterfront — adding residential density and ground-floor retail to the marina district. It’s in pre-leasing. The countywide tight market is a genuine asset for its retail program: when you’re trying to recruit tenants, being located in the tightest retail market in Puget Sound is a better starting position than being in the loosest.

    The Q1 2026 softening trend is worth watching for Millwright’s pre-leasing timeline. If vacancy continues to “creep higher” through 2026, the window of maximum landlord leverage will narrow somewhat. Getting pre-leasing commitments signed during the current tight conditions is better than waiting until the softening becomes more pronounced.

    What This Means for Downtown Everett’s Broadway and Hewitt Corridors

    Downtown Everett’s retail health is more complex than the countywide number suggests. The Hewitt Avenue and Broadway corridors have seen both openings and closures in 2025–2026. The Bank of America departure left a high-visibility corner dark. New entrants like Butter Notes Cafe on Broadway — specialty coffee with jazz programming and a podcast studio — represent the kind of independent retail that fills in where national chains won’t go.

    The tight countywide vacancy means that if you have a viable downtown retail concept, finding space is still the challenge — not finding demand. The riverfront retail analysis covers the Snohomish River waterfront retail picture, which is part of the same countywide story.

    The Broader Context: Why Snohomish County Stays Tight

    Three structural factors keep Snohomish County’s retail market tighter than its neighbors: population growth (the county has grown consistently, adding household demand), limited new supply (almost no major new retail development for years), and an employment base anchored by Boeing, the Navy, and Paine Field that generates stable household incomes. Those factors don’t disappear with one quarter of softening. They’re the durable engine underneath the 3.4% number.

    The Q1 2026 data is a signal to watch, not a signal to act on in panic. Snohomish County retail is not in trouble. It’s at the end of an unusually tight cycle, normalizing toward regional equilibrium. That’s a healthy market movement.

    Frequently Asked Questions

    What is Snohomish County’s retail vacancy rate in 2026?

    3.4% at year-end Q4 2025, per Kidder Mathews data cited by the Everett Herald. Q1 2026 Kidder Mathews data (Registry Pacific Northwest, April 8, 2026) shows vacancy “creeping higher” but remains below the Seattle metro’s 4.0% and Portland’s 4.8%.

    Why is Snohomish County’s retail vacancy so low?

    Primarily because almost no new retail space has been built in years. When supply doesn’t increase, vacancy stays low regardless of demand conditions. Consistent population growth and a stable Boeing/Navy/Paine Field employment base provide steady retail demand on top of the supply constraint.

    How does Snohomish County compare to Seattle and Portland for retail vacancy?

    Snohomish County (3.4% Q4 2025) is tighter than the broader Seattle metro (4.0% Q4 2025, climbing) and significantly tighter than Portland (4.8% Q1 2026). It is the tightest retail submarket in the Puget Sound region.

    What does the retail market data mean for Waterfront Place and Millwright Phase 2?

    The tight market provides leverage for landlords recruiting tenants into new developments. However, the “more selective” tenant dynamic from Q1 2026 means quality tenants have options and aren’t rushed. Major new developments benefit from the overall tightness but need to differentiate on location and amenity to compete effectively for the best tenants.

    Is Snohomish County retail market heading toward higher vacancy?

    Q1 2026 data shows a “creeping higher” trend — a marginal softening after years of extreme tightness. This is a normalization, not a downturn. The structural supply constraint (very little new retail built) and population growth continue to support low vacancy. Watch for continued Q2 and Q3 2026 data for more directional clarity.

    What is the source for Snohomish County retail vacancy data?

    Kidder Mathews quarterly retail market reports. Q4 2025 data was cited by the Everett Herald in February 2026. Q1 2026 data was published by The Registry Pacific Northwest on April 8, 2026.

  • Snohomish County Apartment Sales Hit $640 Million in 2025 — Here Is What the Investment Recovery Means for Everett

    Snohomish County Apartment Sales Hit $640 Million in 2025 — Here Is What the Investment Recovery Means for Everett

    How is the Snohomish County apartment investment market performing in 2026?
    Snohomish County apartment sales reached $640 million across 32 deals in 2025 — more than doubling from 2023 transaction volumes — as flat rents and stable vacancy created entry conditions that yield-focused investors found compelling. Average pricing settled around $294,557 per unit, and with 17,089 units still under construction regionally, capital is moving before the next supply cycle closes.

    Snohomish County’s Apartment Investment Market Hit $640 Million in 2025 — And the Capital Is Still Moving

    Most of the housing market coverage you’ve read about Snohomish County this year has been about buyers, sellers, and mortgage rates. That’s not the whole picture.

    While the for-sale residential market has been digesting a 51% inventory surge and buyers have been navigating 6.4% rates, a parallel story has been unfolding in the investment market — the institutional and private capital that buys, holds, and sells apartment buildings. And that story has a very different tone.

    Snohomish County apartment sales hit $640 million in 2025, according to a Kidder Mathews analysis reported by The Registry Pacific Northwest. That’s across 32 deals. The volume more than doubled from 2023 levels — the trough of what had been a significant pullback in multifamily transaction activity driven by rising interest rates and reset expectations.

    The question worth asking now: what do those investors see in Snohomish County, and what does their move back into the market mean for Everett specifically?

    Why the Market Reset the Way It Did

    To understand where we are, it helps to understand where we came from.

    The 2021-2022 apartment investment boom was driven by cheap debt and outsized rent growth. Cap rates compressed dramatically. Then the Federal Reserve raised rates, borrowing costs spiked, and sellers who bought in 2021-2022 at aggressive prices couldn’t hit the numbers that 2023-2024 buyers needed to see. Transaction volume crashed nationally, and Snohomish County wasn’t immune.

    The recovery that’s now playing out isn’t a return to 2021 pricing. It’s something more durable: a market where seller expectations have adjusted, where buyers can underwrite deals to current rent levels and get a yield, and where the operating fundamentals — occupancy, rent trends — are stable enough to justify putting capital to work.

    The Kidder Mathews data point on average price per unit illustrates this. At approximately $294,557 per unit with a 4% year-over-year decline from 2024 levels, pricing is off the peaks but far from distressed. That’s a reachable entry point for buyers who couldn’t compete in 2021-2022 and have been waiting.

    What Makes Snohomish County Attractive Right Now

    Apartment investors look at fundamentals first: vacancy rates, rent trends, and the supply pipeline.

    On vacancy, Kidder Mathews’ Q4 2025 Seattle-Puget Sound regional data shows multifamily vacancy holding at 7.4% year-over-year. That’s not tight — but it’s not distressed either. For a county where the job base is anchored by Boeing, Paine Field aerospace, the Naval Station, and a growing tech cluster along I-5, that vacancy rate reflects a market with durable demand drivers.

    On rent, the story for 2025 was flat. Everett’s rental market saw rents down roughly 2% year-over-year in 2025, to an average around $1,849 according to prior market data. That’s the downside. But for investors, flat rents in a well-employed market with a constrained land supply are different from flat rents in a market with weak fundamentals. Investors who can buy at current prices and hold for a rent recovery cycle are making a different bet than investors who overpaid during the growth phase.

    On supply, the regional construction pipeline is thinning. Roughly 17,089 units remain under construction across the Seattle-Puget Sound metro — a 23% decline from the prior year. That contraction means the supply overhang that compressed rents will start to clear in 2026 and 2027. Capital that moves now is positioning ahead of that clearing.

    What This Means for Everett Specifically

    Everett is not a monolith in this investment market. The specific submarkets attracting attention are worth understanding.

    The premium waterfront product — the Sawyer and Carling at Waterfront Place — has been holding occupancy at roughly 95% even as broader rents softened, with $2,202-$2,800 monthly rents demonstrating that the waterfront premium survives a soft market. For institutional investors, that occupancy and rent spread is a data point about the durability of location-driven demand.

    Lincoln Properties is underway on Phase 2 of Millwright District — 300-plus units in a mixed-use waterfront setting that will be the first large new-to-the-market supply at the Port of Everett waterfront in this cycle. When those units come online, they’ll reset the comp set for waterfront multifamily in Everett.

    Further south, the adaptive reuse pipeline is active. The Sage Investment Group conversion of the former Econo Lodge at 9602 19th St SE into 124 studio apartments (Phase 1 leasing August 2026) represents the workforce housing angle that Kidder Mathews noted in its investment outlook: value-add and workforce housing offer compelling yield opportunities where class-A development doesn’t pencil.

    The downtown core and the corridors adjacent to the new stadium site are also drawing attention from development capital, though in earlier-stage planning. The city’s approval of the $10.6 million stadium design package in late April sets a September 2026 construction start target for the 5,000-seat Outdoor Event Center — and stadium-adjacent development is a real category of investment thesis that capital is starting to evaluate.

    The Investor’s Lens vs. the Resident’s Lens

    It’s worth being honest about the tension here.

    When apartment investment capital flows into a market like Everett, it’s not always aligned with what existing residents need. Yield-focused buyers have incentives to optimize revenue per unit. Workforce housing conversions can displace existing tenants if not managed carefully. Rising investor interest in a market can precede rent pressure once the supply overhang clears.

    The city’s tools to manage this tension — the Affordable Housing Trust Fund, inclusionary zoning in new developments, the Housing Hope ecosystem, the EHA pipeline — matter precisely because the market is now active enough to require them.

    The $640 million in 2025 transaction volume tells us that capital has made a judgment: Snohomish County is on the right side of the Puget Sound affordability gradient, close enough to Seattle employment to benefit from overspill demand, with enough job diversity to hold occupancy through economic cycles. That judgment drives development, drives transactions, and ultimately drives the housing conditions that Everett residents live inside.

    Understanding how this capital thinks is part of understanding where Everett’s housing goes next.


    Frequently Asked Questions

    How much did apartment sales reach in Snohomish County in 2025?
    Snohomish County apartment sales reached $640 million across 32 deals in 2025, according to a Kidder Mathews analysis, more than doubling transaction volume from 2023 levels.

    What is the average price per apartment unit in Snohomish County?
    Average pricing was approximately $294,557 per unit in the most recent market data, down about 4% year-over-year from 2024 — reflecting pricing adjustments from the 2021-2022 peak.

    What is the apartment vacancy rate in the Snohomish County area?
    Kidder Mathews’ Q4 2025 data showed multifamily vacancy holding at 7.4% year-over-year across the Seattle-Puget Sound region. Everett’s specific figures track roughly with the broader market.

    Why are investors buying apartments in Snohomish County now?
    Flat rents, stable vacancy, and adjusted pricing from the 2021-2022 peak have created entry conditions that yield-focused buyers find workable. The thinning construction pipeline also suggests supply overhang will clear in 2026-2027, giving investors who buy now exposure to the next rent recovery cycle.

    What new apartment projects are coming to Everett?
    Lincoln Properties is underway on 300-plus units at Millwright District (Waterfront Place). Sage Investment Group is converting the former Econo Lodge on 19th St SE into 124 studio apartments with Phase 1 leasing targeting August 2026. Stadium-adjacent development opportunities are also being evaluated as the downtown Outdoor Event Center advances toward a September 2026 construction start.

    How does Everett’s apartment investment market compare to King County?
    Snohomish County typically offers lower per-unit pricing than King County submarkets like Bellevue or Seattle proper, while maintaining access to the same labor market. That affordability gradient is part of what draws yield-focused capital — investors can enter at lower basis points while capturing similar demand dynamics.

  • Snohomish County’s April 2026 Housing Market Has a Number Most Reports Miss: Sales Activity Intensity at 54.9%

    Snohomish County’s April 2026 Housing Market Has a Number Most Reports Miss: Sales Activity Intensity at 54.9%

    What’s the headline number from the Madrona Group’s April 2026 Snohomish County housing report? Sales Activity Intensity came in at 54.9%, down only slightly from 56.0% the month before — meaning more than half of all listings still went pending within the first 30 days. Inventory tightened to 1.6 months. Mortgage rates moved up to 6.45%. Single-family resale prices held near $877,000 with homes selling at 99.8% of list price. The market did not slow down the way the inventory headlines suggested.

    You probably read yesterday’s coverage of Snohomish County’s April housing market — the NWMLS data showing inventory up 51.8% year-over-year, the median sale price at $738,000, the 2.8 months of supply. That is one accurate way to read this market. Here is another, also accurate, with very different implications.

    The Madrona Group dropped its April 2026 Snohomish County report this week, and it does not look like a market that lost its footing. It looks like a market that is moving slower at the top of the funnel — fewer homes coming on, fewer offers per listing, more buyer hesitation — but where the deals that do happen are happening fast and at strong prices.

    The number we want to focus on is Sales Activity Intensity — and we are going to explain it because it is not a number that shows up in every market report and most readers have never seen it framed this way.

    What Sales Activity Intensity actually measures

    Sales Activity Intensity is the share of all active listings that go pending within the first 30 days on the market. Not closed — pending. Pending is the moment a buyer’s offer has been accepted and the deal is moving toward closing. It is the moment when the market said yes.

    A 54.9% Sales Activity Intensity in Snohomish County for April 2026 means that more than one out of every two homes that listed last month had a buyer say yes within 30 days. That is a fast market. It is fast even after a small dip from March, when the same number was 56.0%.

    For comparison, a market that is genuinely cooling — homes sitting, sellers cutting prices, buyers waiting — typically shows Sales Activity Intensity drop into the 30s or below. When intensity drops below 30%, sellers start to see real concessions show up at the closing table. That is not what we have right now.

    What’s behind the number

    Three factors are working at once in the April 2026 Madrona Group data, and none of them point in the same direction:

    Mortgage rates moved up to 6.45%. That is up from earlier in the year and up enough to price some buyers out at the margin. Higher rates almost always slow demand. They have slowed it some — but they have not killed it.

    Inventory tightened to 1.6 months. A balanced market in real estate is usually 4 to 6 months of inventory. At 1.6 months, Snohomish County is still well into seller’s-market territory. Note this is the Madrona Group’s specific measurement — the broader NWMLS data on the same county shows 2.8 months because the two reports use slightly different inventory definitions and time windows. Both are true. The Madrona number is the tighter view.

    Single-family resale prices held near $877,000 with homes selling at 99.8% of list price on average. When buyers are paying within 0.2% of the asking price, they are not negotiating much. They are competing.

    Put the three factors together: rates went up, but the homes that are listed are still moving fast and selling at almost full asking. The buyers who are still in the market have stopped flinching.

    What this looks like on the ground in Everett

    Everett sits inside the Snohomish County data but does not behave exactly like the county average. The city’s median sale price runs lower than the county figure — Redfin had Everett’s most recent typical home value near $620,000, well under the $738,000 county median that NWMLS reported. The reasons are familiar: more starter homes, more condos, more older housing stock, more variation between neighborhoods.

    The Sales Activity Intensity dynamic still applies in Everett. A waterfront condo at Sawyer or Carling priced reasonably is going pending in days, not weeks. A starter home in Delta or Riverside priced at the neighborhood median is doing the same thing. What sits is what is overpriced. What sits is what assumes the market is still set to 2022.

    We have seen this pattern in our own coverage — the April 2026 condo market story we published last week showed Snohomish County condo averages up 4.4% year-over-year and Everett condos selling in a 22-day median at 99% of list. That is the same fast-but-narrow market the Madrona report is describing, just on a different property type.

    What this means for buyers right now

    If you are buying in Snohomish County in May 2026 and you have been waiting for the market to break, the Madrona data is the latest signal that a wholesale break is not coming. Specific properties will be soft. Specific sellers will negotiate. But the broad market is still leaning seller.

    A few practical takes from how this number sits:

    • Stop waiting for the price to come down before you make an offer. At 54.9% Sales Activity Intensity, the home you are watching probably already has another offer. The price you saw on Zillow last Tuesday may not be the price that closes.
    • Get rate-locked before you write an offer. With rates at 6.45% and trending up rather than down, the rate you can get this week is probably better than the rate you can get if you wait three weeks. A 0.25% rate move on a $620,000 Everett home is roughly $90 a month for the life of the loan.
    • The 99.8% of list price number is the real number. If you are writing offers at 95% of list and watching them lose, that is why. The market is not built for 95% offers right now.

    What this means for sellers right now

    If you are selling in Snohomish County, the Madrona data is telling you something sellers sometimes miss: price-to-list discipline matters more than ever.

    • Price it right and it goes pending in 30 days. Price it 5% high and it sits — and the market has been trained to read sitting as a problem. The 30-day window is the window where intensity captures your home as a fast mover. Past 30 days, you are competing with newer listings.
    • The 99.8% of list price number cuts both ways. You probably will not get more than asking. You also will not have to take much less than asking. So price it where you are happy to close.
    • Inventory is tight but moving up. The Madrona number says 1.6 months, the NWMLS number says 2.8 months — both are tighter than 4-6, but both are looser than 12 months ago. If you have been on the fence about listing, the supply side is finally giving you some company on the market. Earlier was easier. Now is still good.

    How this fits with everything else we know about Snohomish County in April 2026

    This week alone we have seen:

    • The NWMLS report showing 51.8% year-over-year inventory growth and 2.8 months of supply
    • The Madrona Group report showing 1.6 months supply and 54.9% Sales Activity Intensity
    • Snohomish County condo data showing 4.4% YoY appreciation and 22-day Everett median time on market
    • Mortgage rates moving up to 6.45%, the highest level since fall 2025
    • The Sage Investment Econo Lodge studio-apartment conversion announcement in South Everett — 124 new units coming online by August 2026

    None of those data points contradict each other. They are all measuring different parts of the same market. The market is more inventory than it had, fewer offers than it had, slower at the top of the funnel — and still selling fast and near asking when the property is priced right. That is a more complicated story than “the market is hot” or “the market is cooling.” It is the market being different things at the same time depending on which lens you bring.

    The Madrona Group report adds a useful lens: the velocity at which deals close, not just the count of homes listed. That velocity number is what tells you whether the market still works. In April 2026, in Snohomish County, it still works.

    Frequently Asked Questions

    What is Sales Activity Intensity in real estate?

    Sales Activity Intensity is the percentage of all active listings that go pending — meaning a buyer’s offer has been accepted — within the first 30 days on the market. It is a velocity measure of how fast the average home is moving. Above 50% indicates a fast seller’s market; below 30% indicates real cooling.

    What was Snohomish County’s Sales Activity Intensity in April 2026?

    54.9%, according to the Madrona Group’s April 2026 Snohomish County housing market report. That is down slightly from 56.0% in March. Both numbers indicate a strong seller’s market.

    What are mortgage rates in Snohomish County right now?

    The 30-year fixed rate referenced in the April 2026 Madrona report is 6.45%. Rates have ticked up from earlier in the year. Individual rate quotes vary by lender, credit score, down payment, and loan size.

    Why does the Madrona Group report say 1.6 months of inventory and the NWMLS report say 2.8 months?

    They use slightly different inventory definitions and time windows. The Madrona Group’s measure tends to capture a tighter view focused on actively moving listings. NWMLS uses a broader inventory definition that includes some listings the Madrona view excludes. Both are accurate; both reflect a Snohomish County market still well below the 4-6 month range that defines balance.

    What is the median home price in Snohomish County in April 2026?

    The April 2026 NWMLS report listed the county median sale price at $738,000. The Madrona Group report references single-family resale prices holding near $877,000, which uses a different scope (single-family resale only, with different geographic weighting). The two numbers describe overlapping but not identical slices of the market.

    Is now a good time to buy a home in Everett?

    “Good” depends on your specific situation — your down payment, your job stability, your timeline, the neighborhood you’re targeting. What the April 2026 data says broadly: prices are not falling, inventory is up but still tight, and rates are higher than they were earlier in the year. Waiting for a wholesale price break is currently not what the data supports. Talk to a local agent and a local lender about your specific math.

    Is now a good time to sell a home in Everett?

    Yes, if it is priced right. The market data says homes priced at the neighborhood median are going pending within 30 days at 99.8% of list. Homes priced 5%+ above the neighborhood median sit. Pricing discipline is the difference between a fast sale and a long sit.

  • Snohomish County Housing Inventory Jumped 51.8% in 2026: The Complete Everett Buyer and Seller Guide

    Snohomish County Housing Inventory Jumped 51.8% in 2026: The Complete Everett Buyer and Seller Guide

    Quick Answer: Snohomish County active home listings surged 51.8% year-over-year in March 2026 — one of the five largest inventory increases in the entire NWMLS territory. Despite the supply jump, the median home price held at $738,000 and homes are still selling at 99.9% of asking in an average of 35 days. Rising mortgage rates (6.38% by late March) are stalling buyer momentum without collapsing prices. For Everett buyers and sellers, the window has shifted — but it has not swung fully to buyers yet.

    The March 2026 Numbers: What Changed

    The Northwest Multiple Listing Service’s March 2026 market snapshot showed 1,900 active residential listings across Snohomish County — a 51.8% year-over-year increase and one of the sharpest single-year inventory jumps in recent county history. That works out to approximately 2.8 months of supply, up sharply from the sub-1.5-month lows that defined the pandemic-era seller’s market.

    For context: real estate economists generally describe 4–6 months of supply as a balanced market. At 2.8 months, Snohomish County is still clearly a seller’s market — but the trajectory is meaningful. Buyers who spent 2022–2024 losing bidding wars on every offer now have more listings to choose from, more time to make decisions, and occasionally — not always — some negotiating room on price.

    The median home price held at $738,000 in March 2026. Homes are still selling at 99.9% of asking price in an average of 35 days. Those metrics do not reflect a market in distress — they reflect a market that has paused rather than reversed. The buyers who have stepped back are rate-sensitive; the sellers who remain active are not discounting.

    Why Inventory Jumped — and Why Prices Haven’t

    The inventory increase is being driven by two converging forces. First, sellers who held off listing during 2023–2024 (reluctant to give up historically low mortgage rates on their existing homes) are gradually re-entering the market as life events — job changes, family transitions, retirement — force the decision. Second, new construction deliveries — particularly multifamily and attached-housing units — are adding to active supply in south Everett and the Everett fringe suburbs.

    Prices are not collapsing because demand has not collapsed. Snohomish County’s employment base — Boeing’s expanding 737 North Line, NAVSTA Everett, Providence Regional Medical Center, and a dense cluster of aerospace and logistics employers — creates persistent housing demand from workers who need to live close to their job sites. That employment anchor is Snohomish County’s buffer against the kind of inventory-driven price correction that markets without a major employment base would experience.

    What This Means for Everett Buyers

    More listings mean more options — and for the first time in several years, buyers can take a breath before making an offer. The days of waiving all contingencies on sight-unseen properties are largely over in the current rate environment. Buyers who can qualify at 6.38% and are not competing for the same handful of best-in-class properties in the most desirable neighborhoods will find the market more navigable than it was in 2022.

    The Everett-specific buyer dynamic in 2026 involves several overlapping pools: Boeing 737 North Line workers relocating from Renton, Navy families PCSing to NAVSTA Everett, and Seattle-area renters making the rent-versus-buy calculation for the first time. All three groups are making decisions based on Snohomish County’s relative affordability versus King County — a spread that has narrowed but not closed.

    The motel-to-apartment conversion pipeline in south Everett — including the Sage Investment Econo Lodge project at 9602 19th Street SE opening August 2026 — adds rental supply that may absorb some demand that would otherwise convert to buyer activity. Workers who can rent a studio near their job site for a year while they watch the market are more likely to do so when inventory is rising and rate direction is uncertain.

    What This Means for Everett Sellers

    The 51.8% inventory jump does not mean sellers are in trouble — it means sellers need to price correctly. Properties at 99.9% of asking in 35 days are properties that were priced to the market. Properties that are not are sitting longer. The days of pricing 10% above comparables and relying on the frenzy to cover it are over. Sellers who price accurately, prepare the property well, and list with strong marketing are still transacting in a historically fast timeframe.

    The June 30 Sound Transit board vote on the Everett Link Extension is a latent catalyst for the seller side. If full delivery is confirmed, demand for properties in station-area neighborhoods — particularly downtown Everett and the Mariner corridor — could accelerate. If the extension is truncated, demand in those specific neighborhoods may soften relative to south Everett, where the SW Everett Industrial Center station coverage is less in dispute.

    Frequently Asked Questions

    What is the Snohomish County housing market doing in 2026?

    Active listings surged 51.8% year-over-year in March 2026 to approximately 1,900 listings (2.8 months of supply). The median home price held at $738,000. Homes sell at 99.9% of asking in an average of 35 days. Mortgage rates are 6.38%. Still a seller’s market, but meaningfully more inventory than 2022–2024.

    Is it a good time to buy a home in Everett in 2026?

    More inventory and slower frenzy pace mean buyers have more options and more time than they did in 2022–2024. Prices remain high ($738K median) and rates at 6.38% are a significant monthly payment factor. For buyers who can qualify and plan to hold for 5+ years, Everett’s employment base provides demand support.

    Why did Snohomish County housing inventory jump 51.8%?

    Sellers who held off during 2023–2024 (to preserve low locked-in mortgage rates) are re-entering the market as life events force decisions. New construction deliveries — particularly attached housing and multifamily in south Everett — are also adding to active supply.

    What is the median home price in Snohomish County in 2026?

    $738,000 as of March 2026, according to NWMLS data. Homes are selling at 99.9% of asking price in an average of 35 days. Current mortgage rates are approximately 6.38%.

    How does Everett’s housing market compare to Seattle?

    Snohomish County’s $738,000 median is significantly below King County’s comparable. The spread between Snohomish and King County has narrowed from its historical range but remains meaningful for buyers who can work remotely or commute to south Snohomish County employment rather than central Seattle.

    Related Exploring Everett coverage: Snohomish County Housing Inventory Jumped 51.8% | Everett Housing Market Three Submarkets Guide | Sage Silver Lake Apartments Complete Guide

  • Snohomish County’s Housing Inventory Just Jumped 51.8% — What That Means for Everett Buyers and Sellers Right Now

    Snohomish County’s Housing Inventory Just Jumped 51.8% — What That Means for Everett Buyers and Sellers Right Now

    For years, the Snohomish County housing market operated in a single gear: not enough homes, too many buyers, prices up. What we’re seeing in the spring of 2026 is a gear shift — and if you’re buying or selling in Everett right now, the numbers look meaningfully different than they did twelve months ago.

    The Northwest Multiple Listing Service’s March 2026 market snapshot showed 1,900 active residential listings across Snohomish County, representing 2.8 months of supply — up sharply from the sub-1.5-month lows that defined the pandemic-era seller’s market. The county posted a 51.8% year-over-year increase in total active listings, putting it among the top five counties in NWMLS’s 27-county territory for inventory gains. And yet: median sold price held at $738,000. Homes are still closing at 99.9% of list price. More than half of all listings — 54.9% — went pending within the first 30 days.

    What’s happening is a collision between supply recovery and rate pressure, and the outcome is a market that is neither the frenzy of 2021 nor the freeze of late 2023. It’s something more complicated — and more nuanced by price band, neighborhood, and property type than any single headline can capture.

    What the Inventory Surge Actually Means

    A 51.8% jump in active listings sounds dramatic, and in some ways it is. At the depth of the supply crisis in 2021 and 2022, buyers in Snohomish County were competing for a fraction of the homes that are now on the market. The correction is real: there are more options, more time to think, and less risk of getting swept into a bidding war on a property you’ll regret.

    But context matters. Nationally, economists generally define a balanced market as 4–6 months of supply. At 2.8 months, Snohomish County is still solidly in seller’s territory by that standard. What’s changed isn’t the fundamental balance of power — it’s the intensity. Sellers are no longer in a position to list at any price and watch offers pile up. Buyers have time to inspect, to negotiate, to walk away if something doesn’t feel right.

    The data shows that distinction clearly. Average showings per listing dropped to 4.8, meaning buyers are doing fewer casual tours and more intentional ones. The average number of showings before a home went pending was 11 — a number that would have seemed impossibly high during the 3–4 showing average of peak seller’s market years, but reflects a market where buyers are being deliberate rather than desperate.

    What Rising Mortgage Rates Are Doing to the Market

    The inventory increase isn’t happening in isolation. Mortgage rates are doing their part to put a lid on activity. Rates briefly dipped below 6% in February 2026, which triggered a small rush of buyers who had been waiting on the sidelines. By late March, rates climbed back to 6.38%, and that pop of demand faded. Closed sales in March across the NWMLS territory came in at 5,417, up just 0.2% year over year — essentially flat despite the inventory recovery that, in theory, should have enabled more transactions.

    For Everett specifically, the rate environment is pushing buyers into decisions that a lower-rate market would make obvious. At 6.38%, a $577,000 Everett home (approximately the city’s early-2026 median) requires a monthly principal and interest payment of roughly $3,100 on a 20%-down conventional loan — before taxes, insurance, and HOA. At the 30% of income affordability threshold, that requires a household income of approximately $124,000 annually. The Everett area median household income in 2026 sits well below that threshold, which is why first-time buyers are stretched, why rental demand at buildings like Waterfront Place’s Sawyer and Carling remains strong despite a soft rental market, and why conversion projects like the Econo Lodge-to-apartments project in Silver Lake are filling a real need.

    By Property Type: Three Very Different Stories

    The Snohomish County housing market in early 2026 is not one market — it’s three, layered by property type, and each is behaving differently.

    Residential Resale: Competitive But Not Frenzied

    For existing single-family homes, the market is still tilted toward sellers, but the tilt is gentler. Inventory sits at approximately 2.0 months for resale properties, and homes are closing at 99.8% of list price on average. Days on market has lengthened modestly. The $738,000 median price is up 1.2% year over year — still appreciating, but at a rate that buyers can factor into a plan rather than a rate that makes them feel like they’re chasing a moving target.

    The practical implication for Everett buyers: you have time to make an offer you feel good about. You’re unlikely to win at list price on a well-priced home in a good neighborhood, but the days of writing five offers before getting accepted at 15% over asking are gone for most price ranges.

    Condos: The Strongest Performer in the County

    Condominiums are the counterintuitive winner in the current market. The average condo price in Snohomish County rose 4.4% year over year to $586,261 — outperforming single-family appreciation by more than three percentage points. Inventory expanded to 2.7 months, giving buyers meaningful choice without triggering price softness. In Everett specifically, condos were moving in a 22-day median with sellers achieving 99% of list price as of early 2026.

    This pattern reflects the affordability ceiling at work. At a $586,000 average, condos give entry-level buyers a path into Snohomish County ownership that single-family homes at $738,000 median no longer provide at 6.38% rates. For investors, the combination of relative affordability, strong occupancy rates at waterfront rental properties, and rising condo values makes the sub-$600K condo segment worth watching closely through the rest of 2026.

    New Construction: The Buyer’s Opportunity

    New construction is where the current market most favors buyers. The average new construction price in Snohomish County came in at $923,988 in early 2026 — down 2.3% year over year — while closed new construction sales dropped 34.3%. Builders are sitting on inventory they need to move, and that creates leverage for buyers who are flexible on timing and location.

    Builders are actively offering incentives: rate buy-downs, closing cost contributions, and in some cases price adjustments on standing inventory. For a buyer who doesn’t need to be in a specific neighborhood and can wait for a completed unit, the new construction segment in Snohomish County in 2026 offers some of the best negotiating conditions in years.

    What This Means for Everett Specifically

    The county-level numbers describe a broad trend, but Everett’s submarket has its own dynamics. Downtown Everett and the waterfront corridor saw stronger appreciation earlier in 2026 — roughly 11.4% year over year — compared to the -7.5% softness in the 98208 zip code (south and east Everett). Northwest Everett, driven by new infrastructure investment including the recently opened Edgewater Bridge and ongoing waterfront development, posted the strongest appreciation in the city at approximately 22.1%.

    The macro picture for Everett: the city’s development fundamentals remain strong. The Port of Everett waterfront is attracting tenants and investment. The downtown stadium received its $10.6M design authorization. The Millwright District Phase 2 is building out. Boeing’s North Line is ramping. Snohomish County’s industrial market is the most affordable in Puget Sound, drawing logistics users. These are demand generators, and demand generators support home values even when rates are working against them.

    Playbook for Buyers and Sellers in This Market

    If You’re Buying

    You have more time and more leverage than you did 18 months ago, but you’re not in a buyer’s market by any traditional definition. Get pre-approved — sellers still want certainty. For resale homes, coming in slightly below list on properties that have been sitting more than 21 days is reasonable. For new construction, ask about rate buy-downs before accepting the sticker price; builders have flexibility they didn’t have in 2023. If condos fit your lifestyle, the 4.4% appreciation and relative affordability make them worth serious consideration as a first purchase.

    If You’re Selling

    Price accurately from day one. The 54.9% of listings going pending in the first 30 days tells you that well-priced homes are still moving fast. The homes that are sitting are overpriced relative to condition and location. Sellers who price to the market will sell. Sellers who price to last year’s comparable sales will find themselves doing a price reduction they could have avoided. With 1,900 active listings, buyers have enough alternatives to walk away from wishful pricing.

    Frequently Asked Questions

    What is the median home price in Snohomish County in 2026?

    The median sold price for homes in Snohomish County was $738,000 in March 2026, up 1.2% year over year, according to NWMLS data.

    How much did Snohomish County housing inventory increase?

    Active listings in Snohomish County increased 51.8% year over year as of March 2026, one of the five largest inventory gains in the 27-county NWMLS territory.

    What are current mortgage rates for Snohomish County buyers?

    Mortgage rates returned to approximately 6.38% by late March 2026 after briefly dipping below 6% in February, which stalled some buyer activity despite improved inventory.

    How long are homes sitting on the market in Snohomish County?

    Homes in Snohomish County are selling in an average of 35 days as of early 2026, with 54.9% of listings going pending within the first 30 days.

    Is the Snohomish County housing market a buyer’s or seller’s market in 2026?

    With 2.8 months of inventory, the market is technically still a seller’s market (balanced typically requires 4–6 months), but conditions are significantly more favorable for buyers than 2021–2022, with more options, more negotiating room, and less bidding war pressure.

    What is happening with condo prices in Snohomish County?

    Condominiums are outperforming single-family homes, with the average condo price rising 4.4% year over year to $586,261. In Everett specifically, condos are selling in a 22-day median at 99% of list price.


  • Snohomish County Has the Most Affordable Warehouse Space in Puget Sound — What Q1 2026’s Industrial Market Means for Everett

    Snohomish County Has the Most Affordable Warehouse Space in Puget Sound — What Q1 2026’s Industrial Market Means for Everett

    Q: How much does warehouse space cost in Snohomish County in 2026?
    A: Snohomish County warehouse rents in 2026 are running approximately $0.70 to $1.00 per square foot monthly on a triple-net basis — the most affordable warehouse market in the Puget Sound region. The broader Seattle metro ranges from $0.70 to $1.60/SF monthly, making Snohomish County the value end of the market by a significant margin.

    The Number That Matters: $0.70 to $1.00 per Square Foot

    If you’re an Everett-area business looking for industrial or warehouse space in 2026, the market conditions haven’t been this favorable in over a decade. Snohomish County’s warehouse and industrial rents are running $0.70 to $1.00 per square foot monthly (NNN), making it the most affordable industrial submarket in the entire Puget Sound region, according to WareCRE’s 2026 Seattle Warehouse Market Report. That’s below Southend markets like Kent and Renton, below Pierce County, and well below the Seattle in-city markets at the top of the range.

    To put that in annual terms: $0.70 to $1.00/SF monthly is $8.40 to $12.00/SF annually on a triple-net lease. For a 20,000-square-foot distribution or manufacturing facility, that’s $168,000 to $240,000 per year in base rent — before operating expenses that you’re responsible for as a tenant under NNN terms, but still well below what comparable space costs in King County.

    And those asking rents are the ceiling right now, not the floor. Kidder Mathews’ Q1 2026 Seattle Industrial Market Report shows vacancy at 10.39 percent across the Seattle metro industrial market, up from 9.74 percent at year-end 2025. At that vacancy level, with net absorption running negative (-130,751 square feet absorbed in Q1 2026) and only two speculative projects totaling 478,740 square feet under construction across the entire market, landlords are dealing. Effective rents — after concessions like free rent periods and tenant improvement allowances — are running below the published asking rates across the region.

    The Market Context: Why It’s the Best Tenant Window in a Decade

    The Puget Sound industrial market is correcting from a 2021-2022 boom cycle that pushed vacancy to historic lows. Speculative development that was planned during that peak is now delivering into a softened demand environment. The result is the most tenant-friendly industrial market the region has seen in more than ten years.

    Cushman & Wakefield’s April 2026 Industrial MarketBeat report describes the national picture this way: “Peak industrial vacancy likely in rearview mirror as demand holds and supply slows.” The national vacancy rate ended Q1 2026 at 7.0 percent — flat with year-end 2025, and 10 basis points below the Q3 2025 peak. The West region runs hotter than the national average at 7.9 percent, and Seattle specifically came in at 9.7 percent for Q1 2026.

    That 9.7 percent Seattle metro figure blends markets with very different profiles — Southend logistics hubs, South Seattle last-mile space, and Eastside flex. Snohomish County’s position within that range reflects its role as the region’s industrial value market: strong fundamentals, affordable rents, and proximity to the Port and to Paine Field’s aerospace manufacturing cluster without the price premium of South King County.

    Tariffs have added a wrinkle to the demand picture. Container volume growth at the Northwest Seaport Alliance reversed from 16 percent year-over-year to 0.2 percent, according to WareCRE’s 2026 report — a direct effect of tariff uncertainty on import volumes. For Everett specifically, which handles breakbulk and project cargo rather than containerized imports, this tariff impact is less acute than it is for the container-focused markets south of Seattle. But it’s part of the broader softening that has tilted conditions toward tenants.

    What This Means for Everett Businesses Specifically

    For businesses in the Everett corridor — manufacturing, distribution, aerospace supply chain, construction materials — Q1 2026 is the moment to renegotiate or explore. A few specific scenarios:

    If you’re renewing a lease: Don’t auto-renew. Take this market to your landlord and negotiate. Vacancy is up, absorption is negative, and landlords are offering concessions that weren’t available 18 months ago. Free rent periods, tenant improvement allowances, and rate reductions are all on the table in a 10-percent-vacancy market.

    If you’re looking for your first industrial space: Snohomish County’s $0.70 to $1.00/SF range gives you significant square footage for your budget. The Port of Everett’s bonded warehouse space, Norton Terminal cargo yard, and on-dock rail connection make this a particularly attractive location for businesses with freight-intensive operations.

    If you’re an aerospace or defense supplier: The Port of Everett Seaport — which just landed an $11.25 million federal grant to rebuild Pier 3 — is actively expanding its cargo-handling capacity. Industrial space near the Port and near Paine Field puts you in the middle of that ecosystem at the market’s most affordable price point.

    The Port’s Industrial Footprint: What’s Already There

    The Port of Everett is not just a transshipment point — it’s an industrial anchor. The Seaport campus includes Norton Terminal (40 acres, paved, lit, and secured), bonded warehouse space, a 15-acre secondary cargo yard, 40-foot MLLW deep-water access, and on-dock rail. That infrastructure supports freight-intensive tenants at a scale that most Puget Sound industrial parks can’t replicate.

    The Port’s broader economic footprint — $21 billion in U.S. exports annually, 40,000-plus jobs supported, $433 million in state and local tax revenues — makes Snohomish County’s industrial corridor one of the most economically active in the Pacific Northwest, despite not getting the same press as South King County’s distribution hubs.

    The Snohomish County office market also showed improvement in Q1 2026, with vacancy ticking down to 10.7 percent and posting a third consecutive quarter of positive net absorption. The industrial and office markets are telling a consistent story: Snohomish County is a market with more space available than King County, at lower prices, and with occupiers slowly returning.

    What Comes Next

    With only two industrial construction projects totaling 478,740 square feet active across the Seattle metro, new supply isn’t going to flood the Snohomish County market in the next 12 to 18 months. Cushman & Wakefield’s assessment — that peak vacancy may be behind us — suggests the window of maximum tenant leverage may be closing at the national level, even if local conditions lag that trend by a quarter or two.

    For Everett: the Pier 3 rebuild will take multiple years from planning through construction, but when it’s done, the Port will have a pier capable of handling more diverse and heavier freight. That means more industrial activity flowing through the waterfront corridor, more demand for warehouse and staging space near the Seaport, and a strengthened case for industrial site selection decisions that prioritize proximity to the Port.

    Right now, $0.70 to $1.00/SF is the entry price. That’s the Snohomish County advantage — and in this market, it’s also the moment to use it.

    Frequently Asked Questions

    What is the average warehouse rent in Snohomish County in 2026?

    Snohomish County warehouse rents are approximately $0.70 to $1.00 per square foot monthly (NNN) in 2026, making it the most affordable industrial submarket in the Puget Sound region. The broader Seattle metro ranges from $0.70 to $1.60/SF monthly.

    Is the Seattle industrial real estate market a buyer’s or tenant’s market right now?

    As of Q1 2026, it is the most tenant-friendly industrial market in over a decade. Vacancy is at 10.39 percent across the Seattle metro, net absorption was negative in Q1 2026, and landlords are offering concessions including free rent and TI allowances.

    How does tariff uncertainty affect the Snohomish County industrial market?

    Tariffs reversed container volume growth at the Northwest Seaport Alliance from 16 percent year-over-year to 0.2 percent, softening demand in logistics-heavy submarkets. Snohomish County and the Port of Everett, which focus on breakbulk and project cargo rather than containerized imports, are somewhat insulated from this trend.

    Where is industrial space available near the Port of Everett?

    The Port of Everett Seaport campus includes Norton Terminal (40 acres), bonded warehouse space, a 15-acre secondary cargo yard, and on-dock rail. Additional industrial space in the Everett corridor is available through commercial brokers; the Port’s business development team can also connect businesses with Port-adjacent space options.

    Is now a good time to lease industrial space in Everett?

    Q1 2026 represents favorable conditions for tenants: vacancy is elevated, new supply is limited, and landlords are offering concessions. Cushman & Wakefield’s April 2026 report suggests peak industrial vacancy may be in the rearview nationally, which means the current window of maximum tenant leverage may be narrowing.