Tag: Real Estate

  • Hood Canal Property Owners: What Belfair’s 2026 Market Means for Your Waterfront Investment

    Hood Canal Property Owners: What Belfair’s 2026 Market Means for Your Waterfront Investment

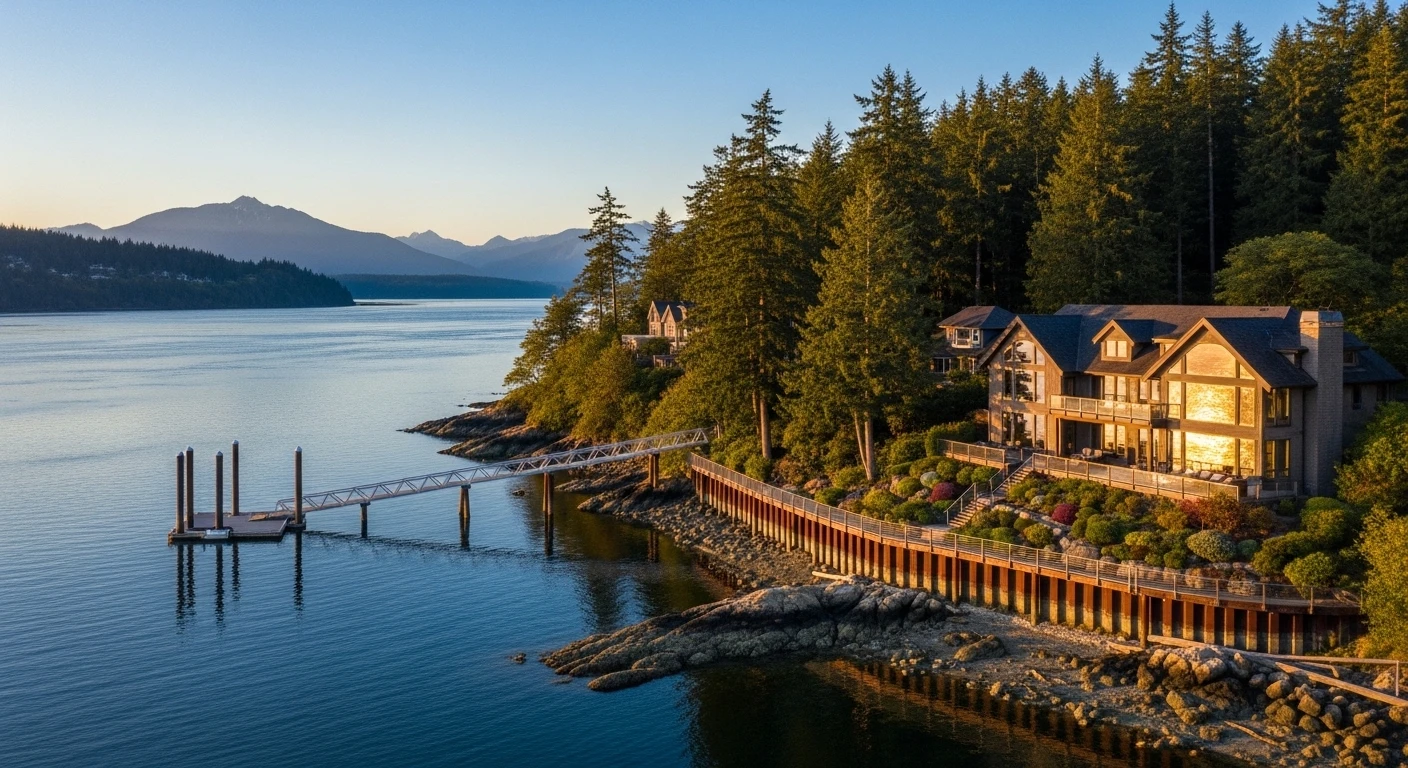
    If you already own waterfront property on Hood Canal near Belfair — or you’re seriously looking at a waterfront purchase — the 2026 market has specific implications that don’t apply to inland buyers. Tidelands, septic regulations, shoreline management, and the waterfront premium all create a separate buying and ownership calculus.

    The Waterfront Premium in 2026

    Direct Hood Canal waterfront in the Belfair area ranges from $700,000 for modest cottages to $1.5 million+ for newer homes on 2+ acres with mountain views. The most premium properties — deep water moorage, deeded tidelands, newer bulkheads — can exceed $2 million.

    Compared to Belfair’s overall median of $405,000, you’re paying a 75-275% premium for water access. The question isn’t whether the premium exists — it’s whether the hidden costs erode the investment value.

    Tidelands: The Ownership Layer Most Buyers Miss

    In Washington State, tidelands ownership is separate from upland property ownership. When you buy a “waterfront” home near Belfair, you may or may not own the tidelands — the area between ordinary high water and extreme low tide. This distinction matters enormously:

    • Shellfish harvesting: If you own deeded tidelands, you have private shellfish rights on your beach. Hood Canal is one of the most productive shellfish areas in Washington. Without tidelands ownership, your beach access may be limited to recreation only.
    • Dock permits: Building or maintaining a dock requires tidelands ownership or a DNR aquatic lands lease. The permitting process through Mason County and the Army Corps of Engineers takes 6-18 months.
    • Property value: Deeded tidelands add $50,000-$150,000+ to a property’s value compared to waterfront without tidelands.

    Septic Systems: The Regulatory Tightening

    Hood Canal’s marine environment is classified as sensitive. Septic systems within 200 feet of the shoreline face stricter monitoring requirements from Mason County Environmental Health. If your system fails inspection, replacement costs range from $20,000-$50,000+ for shoreline-compliant advanced treatment systems — significantly more than standard inland septic replacement.

    The county has been increasing enforcement of septic inspection requirements during property transfers. Budget accordingly if you’re selling or buying in 2026.

    Shoreline Management Act: What You Can and Can’t Do

    Hood Canal waterfront properties in Mason County fall under Washington’s Shoreline Management Act. Setback requirements, vegetation buffers, and construction restrictions apply within 200 feet of the ordinary high-water mark. Want to build a deck, expand your home, or remove trees for a better view? Each requires a shoreline permit through Mason County, and the buffer requirements may surprise you.

    Insurance and Ongoing Costs

    Waterfront ownership near Belfair typically adds $3,000-$8,000 annually beyond mortgage costs: flood insurance ($1,500-$5,000), bulkhead maintenance, septic monitoring, and higher property insurance rates for structures near water. Factor these into your investment return calculation.

    Related Coverage

    Read our full 2026 Belfair real estate analysis for inland pricing and neighborhood breakdowns, and the 2026 Hood Canal shellfish season guide for current harvesting rules.

    Frequently Asked Questions

    How much does Hood Canal waterfront cost near Belfair in 2026?

    Direct Hood Canal waterfront near Belfair ranges from approximately $700,000 for modest cottages to $1.5 million+ for newer homes with mountain views and deep water access. Properties with deeded tidelands command a premium of $50,000-$150,000+ over comparable waterfront without tidelands.

    What are tidelands and should I care when buying Hood Canal waterfront?

    Tidelands are the area between ordinary high water and extreme low tide. In Washington, tidelands ownership is separate from upland property. Owning deeded tidelands gives you private shellfish harvesting rights, dock building eligibility, and increased property value. Always verify tidelands status during due diligence on any Hood Canal waterfront purchase.

    How much does flood insurance cost for Hood Canal waterfront in Belfair?

    Flood insurance for Hood Canal waterfront properties near Belfair typically costs $1,500-$5,000+ annually depending on your property’s elevation, structure type, and FEMA flood zone classification. This is in addition to standard homeowner’s insurance.

    Can I build a dock on Hood Canal waterfront property near Belfair?

    Dock construction requires tidelands ownership or a DNR aquatic lands lease, plus permits from Mason County and the Army Corps of Engineers. The permitting process takes 6-18 months and must comply with Washington’s Shoreline Management Act. Not all properties qualify.


  • Belfair Real Estate in 2026: What the Numbers Actually Say About Buying in North Mason

    Belfair Real Estate in 2026: What the Numbers Actually Say About Buying in North Mason

    Belfair’s real estate market in 2026 sits at a crossroads. Median home values have climbed to approximately $405,000 — higher than Mason County’s $352,000 median — while average listing prices for the 37 active properties hover around $502,000. For anyone looking to buy in North Mason, the gap between what you’ll see online and what you’ll actually pay reveals a market with more nuance than the headline numbers suggest.

    The Price Reality: What $400K-$500K Gets You in Belfair

    A typical single-family home in the $400,000-$475,000 range sits on 0.5 to 1.5 acres, features 3 bedrooms, and was built between 1990 and 2010. You’re getting space that doesn’t exist at this price point in Kitsap County. But you’re also getting a well and septic system, propane or oil heat, and a 30-40 minute commute to Bremerton.

    The $300,000-$400,000 tier exists but it’s thin. These are typically older homes (1970s-1980s) on smaller lots, sometimes needing significant updates. They sell fast because they’re the entry point for first-time buyers and military families stretching BAH.

    The $500,000-$700,000 tier gets you newer construction, larger acreage (2-5 acres), or partial water views. This is where Hood Canal proximity starts appearing in listings without direct waterfront access.

    Hood Canal Waterfront: The Premium Tier

    Direct Hood Canal waterfront in the Belfair area commands $700,000 to $1.5 million+, with exceptional properties exceeding $2 million. These aren’t just homes — they’re lifestyle purchases. Views of the Olympic Mountains across the canal, private beach access, kayak launches from your yard.

    The hidden costs are real: waterfront septic systems near sensitive marine environments face stricter regulation. Flood insurance, shoreline setback requirements, and maintenance on bulkheads or natural shoreline add $3,000-$8,000 annually beyond your mortgage. Tidelands ownership — whether you own the beach below the high-water mark — varies by property and significantly affects what you can do with your waterfront.

    Neighborhood Breakdown: Where People Actually Live

    Central Belfair / SR-3 Corridor: The most convenient location for shopping, dining, and SR-3 access. Homes here tend to be on smaller lots (0.25-0.75 acres) and closer together. This is where you’ll find the most affordable options and the easiest daily errands. Walking distance to Safeway, the post office, and the Belfair Town Center development.

    North Shore / Hood Canal Side: Properties along NE North Shore Road and tributaries offer canal views or proximity. Quieter, more rural feel. Larger lots. You’ll trade convenience for scenery — the nearest grocery store is a 10-15 minute drive.

    Belfair-Allyn Road Corridor: Running southwest toward Allyn, this stretch offers larger parcels and newer subdivisions. Good for families wanting acreage and newer schools access. The commute to Bremerton adds 5-10 minutes versus central Belfair.

    Tahuya / Dewatto Direction: South and west of Belfair, these unincorporated areas offer the most land for the least money. Five-acre parcels under $400,000 exist here. But you’re 20+ minutes from Belfair’s services on winding rural roads with no cell service in places.

    Market Dynamics: Slow Inventory, Steady Demand

    Belfair’s market isn’t frenzied like suburban Seattle, but it’s not soft either. Most properly priced homes sell within 30-45 days. With only ~37 active listings at any given time, inventory turns slowly. You won’t have 50 options to tour — more like 8-12 that match your criteria.

    Demand drivers remain consistent: PSNS and Bangor civilian/military employees seeking affordable alternatives to Kitsap County, remote workers escaping Seattle metro prices, and retirees attracted to Hood Canal’s beauty and Mason County’s lower property taxes.

    The Infrastructure Factor

    Every real estate decision in Belfair connects to SR-3. The Belfair Bypass delay means the commercial corridor remains the only route north. If you’re buying based on the bypass improving traffic by 2028, recalibrate — current projections push it to 2033 at the earliest.

    Well and septic are standard outside central Belfair. Budget $5,000-$15,000 for a septic inspection and potential repair/replacement at closing. Wells should be tested for flow rate, bacteria, and nitrates — Mason County Health Department has specific requirements.

    Related Belfair Bugle Coverage

    See our original Belfair real estate overview, the complete guide to living in Belfair, and Tahuya & Dewatto rural living guide for neighborhood-specific details.

    Frequently Asked Questions

    What is the median home price in Belfair Washington in 2026?

    The median home value in Belfair is approximately $405,000 as of 2026, compared to Mason County’s overall median of $352,000. Average active listing prices run higher at around $502,000, reflecting the mix of waterfront and premium properties on the market.

    How does Belfair real estate compare to Silverdale or Bremerton?

    Belfair homes are significantly more affordable per square foot than Silverdale or Bremerton. A 3-bedroom home on an acre in Belfair at $425,000 would cost $550,000-$650,000+ in Silverdale. The tradeoff is a longer commute and well/septic instead of municipal water and sewer.

    Do I need flood insurance for a Hood Canal waterfront property in Belfair?

    Most Hood Canal waterfront properties in the Belfair area fall within FEMA flood zones requiring flood insurance. Premiums vary significantly — $1,500 to $5,000+ annually depending on elevation, structure type, and proximity to the waterline. Get a flood determination before making an offer.

    What are tidelands and do they matter when buying waterfront in Belfair?

    Tidelands are the area between the ordinary high-water mark and extreme low tide. In Washington State, tidelands ownership is separate from upland ownership. Some Belfair waterfront properties include deeded tidelands; others don’t. This affects shellfish harvesting rights, dock permits, and beach access. Always verify tidelands ownership during due diligence.

    Is Belfair a good investment for rental property?

    Belfair has steady rental demand from PSNS/Bangor workers and families who want North Mason’s affordability without buying immediately. Rental vacancy rates are low. However, well/septic maintenance responsibilities fall on the landlord, and Mason County’s rural infrastructure means higher maintenance costs than urban rentals.

    What should I budget for well and septic when buying in Belfair?

    Budget $5,000-$15,000 for septic inspection and potential repairs at closing. Well testing (flow rate, bacteria, nitrates) costs $300-$600. If a septic system needs full replacement, costs range from $15,000-$40,000+ depending on soil conditions and system type. Mason County Health Department inspections are required for most property transfers.


  • Mason County Real Estate: Prices, Trends and Neighborhoods

    Mason County Real Estate: Prices, Trends and Neighborhoods

    Mason County Real Estate: Prices, Trends and Neighborhoods

    The Mason County real estate market reflects the region’s appeal as an affordable alternative to western Washington’s crowded, expensive metro areas. Whether you’re searching for a cozy family home, a waterfront property, or a rural retreat, understanding the local market is essential to making an informed decision.

    Market Overview 2026

    As of 2026, Mason County’s real estate market has stabilized after several years of growth. Median home prices have increased gradually but remain substantially lower than comparable properties in King, Kitsap, or Pierce counties.

    Current Median Home Price: $425,000-$475,000 depending on area

    Market Trend: Steady appreciation with modest growth. Inventory remains limited, particularly in desirable waterfront and Shelton-area properties.

    Buyer Demand: Strong interest from remote workers, retirees, and those seeking larger properties for less money than available near Seattle.

    Shelton and Downtown Area

    Shelton’s downtown and surrounding residential areas command a premium due to access to schools, services, and employment. This is where you’ll find the most walkable neighborhoods and established infrastructure.

    Price Range: $350,000 to $600,000 for typical homes; $500,000+ for larger properties or those with special features

    Character: Established neighborhoods with mature trees, good schools, and community amenities. Downtown Shelton offers historic charm with modern convenience.

    Best For: Families prioritizing schools, those working in Shelton, or those wanting town amenities with small-town character.

    What to Expect: Properties sell within 30-60 days typically. Competition is moderate to strong for move-in-ready homes. Many houses were built 1970s-1990s, so inspection and maintenance history matter.

    Belfair and Eastern Mason County

    Belfair has emerged as Mason County’s fastest-growing community, attracting families seeking balance between small-town living and reasonable proximity to services. Green Cove provides access to water recreation.

    Price Range: $375,000 to $550,000 for typical residential properties

    Character: Mix of established neighborhoods and newer developments. More spacious lots than Shelton. Good schools and family-oriented community.

    Best For: Growing families, those wanting new or newer construction, and those seeking community connection without urban density.

    What to Expect: Inventory is moderate and relatively consistent. Properties appeal to families relocating from larger cities. Schools and parks are community focus.

    Hood Canal Waterfront Communities

    Hood Canal properties represent the premium end of Mason County real estate. Waterfront access, scenic beauty, and recreation drive values significantly higher than comparable inland properties.

    Hoodsport

    Price Range: $450,000-$800,000+ for waterfront; $350,000-$500,000 for non-waterfront

    Character: Vacation home aesthetic with active boating community. Tourist destination feel with restaurants and shops. Mix of year-round residents and seasonal visitors.

    Best For: Those prioritizing water access and recreation, vacation home investors, retirees enjoying boating lifestyle.

    Union

    Price Range: $425,000-$750,000 for waterfront; $325,000-$450,000 for non-waterfront

    Character: Quieter, more residential than Hoodsport. Strong maritime heritage. Scenic beauty with working waterfront character.

    Best For: Those seeking quiet waterfront living with less tourist activity than Hoodsport.

    Allyn and Other Hood Canal Communities

    Price Range: $375,000-$650,000 depending on waterfront access

    Character: Rural, quiet, private. Strongest appeal to those seeking to escape crowds and development.

    Best For: Those prioritizing privacy and natural setting over amenities and services.

    Rural and Acreage Properties

    Mason County’s rural areas offer exceptional value for those wanting land, privacy, and forest settings.

    Price Range: $200,000-$400,000 for 1-5 acre properties; $3,000-$6,000 per acre for raw land

    What’s Available: Forested acreage, some with creek or river frontage. Rural homes on large lots. Investment properties and hobby farms.

    Best For: Those wanting space, privacy, and self-sufficiency. Hobby farmers, artists, and those working remotely.

    Considerations: Rural properties may lack municipal water/sewer (well/septic required). Road maintenance and property access vary. Closer attention to easements and rights-of-way essential.

    Buying Tips for Mason County

    Work with Local Realtors

    Local agents understand community nuances, neighborhoods, schools, and market dynamics better than those outside the area. Ask for recommendations from local residents or online communities.

    Inspect Carefully

    Many Mason County homes have decades of history. Thorough inspections are essential. Pay attention to roof condition, foundation, septic systems (if applicable), water quality, and heating systems.

    Understand Zoning and Regulations

    Mason County has varying zoning, environmental regulations, and building codes by area. Understand what’s permitted on your property before purchasing.

    Consider Long-Term Appreciation

    While Mason County properties appreciate, growth is steady rather than explosive. Buy for lifestyle fit, not speculation.

    Factor in Commute Costs

    If you work outside Mason County, calculate commute distance and fuel costs when evaluating property value.

    Check Flood and Environmental Status

    Mason County has flood-prone areas, especially near rivers and Hood Canal. Review flood maps and environmental hazard reports.

    Rental Market

    Rental availability is extremely limited in Mason County. Most rentals are single-family homes rather than apartments.

    Typical Rental Prices: $1,200-$1,800 for 2-bedroom homes; $1,600-$2,200 for 3-bedroom

    Availability: Scarce. Expect 6+ month searches to find suitable rentals. Most are found through local networks rather than online listings.

    Investment Perspective

    Mason County real estate offers reasonable appreciation and strong rental demand for those owning properties. Waterfront and Shelton properties appreciate faster than rural areas. However, the market is not a speculative growth market—it’s better suited to buy-and-hold investors and owner-occupants.


    Frequently Asked Questions

    What’s the average home price in Mason County?

    As of 2026, the median home price ranges from $425,000 to $475,000, varying by area. Waterfront properties are significantly higher ($600,000+), while rural properties can be lower ($300,000-$400,000).

    Are Mason County homes appreciating in value?

    Yes, Mason County real estate appreciates steadily. Appreciation is moderate (3-5% annually) rather than explosive. Waterfront and Shelton properties appreciate faster than rural areas.

    Is it a buyer’s or seller’s market in Mason County?

    It’s generally a balanced market with slight advantage to sellers. Inventory is limited, particularly for desirable properties, but buyer demand is steady and consistent.

    What are closing costs in Washington?

    Typical closing costs in Washington range 2-5% of purchase price, including title insurance, escrow, appraisal, inspection, and lender fees. Your realtor and lender should provide detailed estimates.

    Should I buy waterfront property in Mason County?

    Waterfront offers superior appreciation, lifestyle appeal, and recreation access. However, prices are 30-50% higher than comparable inland properties. Consider whether the premium matches your priorities and budget.

  • Belfair Real Estate: Neighborhoods, Prices and What to Expect

    Belfair Real Estate: Neighborhoods, Prices and What to Expect

    The Real Estate Landscape: Price Reality and Neighborhood Breakdown

    Belfair’s housing market reflects its identity: more affordable than central Bremerton, but no longer the bargain it was five years ago. If you’re hunting a home here, understanding the price tiers, neighborhood splits, and the hidden costs of rural property is essential.

    Median Prices and Recent Trends

    The median home price in Belfair hovers around $425,000-$475,000 for a typical single-family residence on 0.5-1.5 acres. This represents a 15-20% increase since 2020, slower growth than King County suburbs but still noticeable. Waterfront properties (Hood Canal frontage or direct access) command $700,000-$1.2 million+, with some premium properties exceeding $1.5 million.

    Inventory turns slowly. Most homes sell within 30-45 days, but you won’t have 50 options to tour. The market isn’t frenzied like suburban Seattle, but it’s tight enough that good homes attract multiple offers. Properties priced realistically sell quickly; overpriced homes linger.

    Waterfront vs. Inland: The Price-to-Reality Ratio

    Hood Canal Waterfront

    Direct Hood Canal access is the luxury tier. You’re paying for views, water access (kayaking, boating, some beach), and that intangible “I live on the water” feeling. Properties range from modest cottages on 0.5 acres ($600K-$800K) to palatial homes on 2-3 acres ($1.2M-$2M+).

    The tradeoff: waterfront means septic systems near sensitive marine environments, navigating shellfish bed regulations, dealing with tidal swings that expose mudflats, and higher property tax assessments. Winter storms bring erosion concerns on some properties. Waterfront living is romantic until you’re managing septic inspections and environmental compliance.

    Near-Waterfront and View Properties

    Properties within sight of Hood Canal but not directly on it split the difference: $500K-$750K for a 1-2 acre home with views. You get the aesthetic without the environmental regulations and higher taxes. This is where value lives for many buyers—close enough to water to feel it, far enough away to avoid the complexity.

    Inland Residential

    Standard suburban properties inland, away from the water, cluster in the $400K-$500K range for 0.5-1.5 acres. These neighborhoods (near the state park, along Shelton Road, deeper in North Mason) offer the most consistent housing stock. Schools are walkable. Yards are large. Septic and well systems are standard but more straightforward than waterfront.

    Acreage Properties: A Different Market

    Want 5-10 acres? Prices drop per acre but total costs jump. A 5-acre property might run $550K-$700K depending on location and building condition. Ten acres pushes $750K-$950K. These attract families wanting genuine rural living, hobby farmers, and people craving true privacy.

    The hidden math: larger properties mean longer driveways, more septic/well maintenance, higher heating bills, and property tax assessments that can surprise you. A 10-acre parcel might assess at $25,000/year property value, shifting your effective purchase price over 15 years.

    New Construction vs. Existing Homes

    Existing Homes

    Most Belfair homes were built 1960-1990. You’ll find solid construction, established landscapes, and character. Many are well-maintained; some need work. Inspection is critical—older septic systems, original wiring, aging roofs are common issues. But you’re not paying the 10-15% premium that new construction commands.

    New Construction

    New subdivisions near Belfair State Park offer modern builds: 2010-2020 construction, open floor plans, current systems. Prices run $475K-$600K for comparable size to older homes. You pay for newness, warranty, and zero surprises. These appeal to families wanting turn-key living and buyers uncomfortable with older-home risks.

    Septic Systems and Well Water: The Unglamorous Reality

    Outside town limits (which is most of Belfair), you’re on septic and well water, not city infrastructure. This isn’t inherently bad, but it’s expensive and requires understanding.

    Septic Systems

    A new septic system costs $8,000-$15,000. Inspections (required for sale or if system fails) run $1,500-$3,000. Pumping costs $300-$500 every 3-5 years. Some systems are 40+ years old and fail without warning—a $12,000 liability. Inspections reveal condition; buy accordingly.

    Septic systems fail during wet winters when drain fields oversaturate. If your property slopes into a neighbor’s septic area, groundwater contamination becomes a shared problem. Know the system’s location, age, and capacity before offering.

    Well Water

    Wells in Belfair are generally reliable but require testing. Water quality varies—some wells are excellent, others have minor mineral issues. Testing costs $300-$500. If there’s a problem (bacterial contamination, excessive iron), treatment systems add $2,000-$8,000. This is why inspections are non-negotiable in Belfair real estate.

    Property Taxes and School District Impact

    Washington property taxes are 0.84-0.95% of assessed value in Mason County. A $450,000 home runs roughly $3,780-$4,275/year. This is reasonable by national standards but adds up in a rural budget.

    School district impact is significant. Homes in the North Mason School District (serving Belfair) are sought because schools are solid. Properties just outside the district boundary might be $20K-$30K cheaper, but school district assignment is harder. Ask your realtor specifically: “Is this address in North Mason School District?” before making offers.

    Neighborhood Tiers: Who Thrives Where

    Old Belfair (Historic Core)

    Tree-lined streets, walking distance to Hood Canal, established community. Homes run $400K-$550K typically. Best for: families wanting walkable neighborhoods, people who value community presence, anyone wanting to be “in” town rather than rural.

    North Shore (Waterfront Premium)

    Upscale, quieter, pricier. $650K-$1.2M+. Best for: empty-nesters, high-earner commuters, retirees who value exclusivity and water access. Not ideal for families with school-age kids (further from schools) or people needing frequent town access.

    Near Belfair State Park

    Newer subdivisions, family-oriented, walkable to schools. $425K-$550K typically. Best for: families with young kids, people wanting suburban convenience, anyone uncomfortable with older homes. More cookie-cutter, less character.

    Rural North Mason Proper

    5+ acres, genuine country living, SR-106 corridor. $500K-$800K depending on acreage and condition. Best for: hobby farmers, people wanting real privacy, anyone uncomfortable with neighbors. Longer commutes to town (20-30 minutes).

    Buying Process Realities Unique to Belfair

    Septic/Well Contingency

    Standard inspections should include septic and well testing. Don’t waive these. A failed septic system can kill a deal or tank your financing. Most lenders require passing inspections before closing.

    Slow Closing Process

    Rural transactions take longer—more inspections, more title searches, more contingencies. Budget 45-60 days from offer to closing, not the 30 days common in urban markets. Sellers expect this rhythm.

    Limited Inventory Seasonality

    Homes sell slowest December-February (winter, fewer buyers), faster March-September. If you’re selling, list in spring. If you’re buying, better selection exists in summer but more competition too.

    What’s the median home price in Belfair?

    Median home prices in Belfair range from $425,000-$475,000 for typical residential properties on 0.5-1.5 acres. Waterfront properties command $700,000-$1.2 million+. Prices have increased 15-20% since 2020.

    What’s the cost difference between waterfront and inland homes?

    Waterfront Hood Canal homes run $700K-$1.2M+, while inland properties are $400K-$500K. Near-waterfront view properties split the difference at $500K-$750K. Waterfront comes with higher environmental regulations and property taxes.

    Do I need a septic inspection in Belfair?

    Yes. Most Belfair properties are on septic systems, not city sewer. Septic inspection is essential before purchase. A new system costs $8,000-$15,000. Inspections reveal system age, condition, and whether replacement is imminent.

    What are property taxes like in Belfair?

    Mason County property taxes are approximately 0.84-0.95% of assessed value. A $450,000 home runs roughly $3,780-$4,275/year. This is reasonable by national standards but should factor into your monthly housing budget.

    Are homes in North Mason School District more expensive?

    Yes. Properties in the North Mason School District typically carry a $20K-$30K premium because schools are solid and district assignment is competitive. Ask your realtor specifically about school district boundaries before making offers.

  • North Mason Homeowner’s Guide to the April 28 Levy: Cost, Programs, and Why It’s on the Ballot Again

    North Mason Homeowner’s Guide to the April 28 Levy: Cost, Programs, and Why It’s on the Ballot Again

    North Mason Homeowner’s Guide to the April 28 Levy: What It Costs, What It Funds, and Why It’s on the Ballot Again

    If you own property in the North Mason School District — anywhere from Belfair to Allyn, Tahuya to Union — you have a direct financial stake in the April 28 levy vote. Here’s a plain-language breakdown of what you’re being asked to approve, what it will cost you, and why this is the third time you’ve seen it on the ballot.

    What You’re Actually Voting On

    This is an EP&O (Educational Programs and Operations) replacement levy — not a new tax, but a renewal of a levy that North Mason voters previously approved and that expired at the end of 2025. Under Washington state law, the district cannot simply continue collecting it. Voters have to reauthorize it each cycle.

    The proposed levy authorizes up to $5.5 million per year for four years. The actual amount collected per year — and what it costs each property owner — is calculated against total assessed property values in the district.

    What Does This Cost a North Mason Property Owner?

    EP&O levy rates are expressed in dollars per $1,000 of assessed value. If your home is assessed at $450,000 (near the median for North Mason area), and the levy rate works out to roughly $0.50–$0.55 per $1,000, your annual levy cost would be approximately $225–$250 per year — or about $20/month.

    Your exact cost depends on your parcel’s current assessed value. Check your Mason County property tax statement or look up your parcel at masoncountywa.gov for the accurate number. The Mason County Assessor’s office can also help you calculate the levy’s impact on your specific property.

    Where the Money Goes

    State funding covers basic classroom instruction in Washington schools. The levy fills the gap for everything else the community expects from a functioning school system: music programs at North Mason Middle School and NMHS, athletics for middle and high school students, school security officers, after-school activities, and partial funding toward the community gymnasium roof replacement — a capital need that has been deferred for years.

    None of these programs have a state funding source. Without the levy, they are cut or significantly reduced.

    Why It’s on the Ballot for the Third Time

    Voters rejected the levy in February 2025 (roughly 46% yes, needing 50%+) and again in November 2025. Both times, it fell short by a margin that suggests the outcome turns on voter turnout more than deep opposition. Spring special elections typically draw fewer voters than fall elections — which means registered North Mason property owners who don’t return their ballots have an outsized effect on the result.

    Since the November failure, the district has been absorbing the financial impact. Enrollment came in lower than projected, adding a separate $1 million-plus shortfall. Superintendent Dr. Kristine Michael submitted an emergency cash request in March 2026 and has been, in her words, “squeezing every dollar.” Staff reductions have already been made.

    What a Third Failure Would Mean for the District — and Your Property

    Beyond the direct program cuts, a third consecutive levy failure has broader implications for North Mason. School quality is a significant driver of residential property values. Districts that cut music, sports, and safety staffing over multiple years typically see enrollment decline further — which reduces state funding further, creating a compounding cycle. For property owners in Belfair, Allyn, and the surrounding area, the school district’s financial health is directly tied to the area’s long-term appeal and property values.

    Key Dates for Property Owners

    • April 20: Voter registration deadline (register at VoteWA.gov)
    • April 28: Ballot due — mail or drop box
    • Drop boxes: Check masoncountywa.gov/departments/auditor for Belfair-area locations

    Frequently Asked Questions for North Mason Property Owners

    How do I find out what the levy will cost me specifically?

    Look up your parcel assessed value at masoncountywa.gov, then apply the levy rate per $1,000. The Mason County Assessor (360-427-9670 ext 491) can walk you through the calculation for your property.

    Is this the same levy that was on the ballot in 2025?

    Yes — the same fundamental proposal. It replaces the EP&O levy that voters approved in 2022 and that expired at the end of 2025. The levy amount (up to $5.5M/year) and duration (4 years) have remained consistent across all three attempts.

    If I voted no before, has anything changed?

    The core levy is the same. What has changed is the consequences: staff have been cut, a budget shortfall has been confirmed, and the emergency cash request signals the district is past contingency planning and into crisis management. Voters who were on the fence in November are now seeing the real-world outcome of a “no” vote.

    Can the district raise the levy rate above the authorized amount?

    No. The levy rate is capped by both the voter-approved maximum and state law limits on EP&O levies. The district cannot collect more than voters authorized.

    Where can I read the full levy resolution?

    Visit northmasonschools.org/page/levy-info or attend a North Mason School District board meeting. Agenda materials are posted in advance at northmasonschools.org/page/board-meetings.


    Related from Belfair Bugle: Full levy guide: Everything Belfair needs to know about the April 28 vote | Original schools & youth coverage: April 8, 2026

  • What Everett’s $120M Stadium Means for Downtown Business Owners and Developers

    What Everett’s $120M Stadium Means for Downtown Business Owners and Developers

    Q: Should I factor the Everett stadium into my business or real estate decisions?
    A: Cautiously yes — but the project is not yet approved and has a $38 million funding gap. The stadium would be a significant downtown anchor if built, likely increasing foot traffic on Hewitt Avenue and adjacent blocks. However, the 2028 earliest opening means any business positioning around the venue is a 2-3 year horizon play.

    What Everett’s $120M Stadium Means for Downtown Business Owners and Developers

    If you own a business or investment property in downtown Everett — or you are considering one — the Outdoor Event Center is the biggest real estate and economic development variable on the board. Here is an honest look at what the stadium actually means for the business environment and what the $38 million funding gap means for your planning timeline.

    The Anchor Effect: What a Downtown Stadium Does

    Sports venue research consistently shows that a well-integrated downtown stadium generates pre-game and post-game foot traffic that benefits restaurants, bars, and retail within approximately a half-mile radius. The Everett Outdoor Event Center’s downtown location — on a block accessible from Hewitt Avenue — puts the stadium’s foot traffic catchment zone directly over the Broadway District, the Hewitt Avenue commercial corridor, and within walking distance of Everett Station.

    The AquaSox play approximately 66 home games per season in High-A season — May through September. Add USL men’s and women’s soccer seasons, concerts, and year-round events, and the venue could be active 100+ nights per year. That is a meaningful driver for hospitality businesses that currently depend on the more sporadic event schedule at Angel of the Winds Arena and the Everett Theatre.

    Real Estate: Which Blocks Benefit Most

    The blocks immediately adjacent to the stadium site — along Hewitt between Rockefeller and Hoyt, and south along the numbered avenues — are the primary beneficiaries of a proximity premium if the stadium is built. Commercial properties suitable for sports bars, brewpubs, quick-service restaurants, and parking are the highest-demand adjacent uses in comparable markets.

    Commercial real estate along Hewitt has seen modest but real activity in the 2024-2026 period as the stadium project has moved through planning stages. Speculative positioning — buying or leasing before the deal is confirmed — carries meaningful risk given the $38 million funding gap. However, operators with existing downtown Everett presence should be thinking about how their locations map to the stadium footprint.

    The Private Investment Ask: Opportunity or Obligation?

    Mayor Franklin’s funding strategy explicitly targets private investors — regional corporations and businesses — as the first source to close the $38 million gap. Naming rights to the stadium, sponsorship tiers, and corporate partnership packages are the expected vehicles. For the right business, a naming or presenting sponsor position at a downtown Everett sports and entertainment venue could be a compelling brand investment in a market of 114,000 city residents and a metro catchment far larger.

    The Everett Chamber of Commerce is actively engaged in the stadium’s advocacy and fundraising conversation. Business owners who want to be at the table for sponsorship discussions should be in contact with the Chamber now, ahead of any formal ask structure being finalized.

    The Risk Calculus

    The stadium is not approved. The $38 million must be raised. Three preconditions — funding closure, lease execution, and property acquisition — must all be met before the city council votes. Any one of those three items can stall or kill the project. The design is 60 percent complete; construction is planned to start in 2027 with an opening targeted for 2028.

    Business investment decisions that depend on stadium traffic by, say, 2027 or early 2028 are high-risk. Business decisions that position you for the 2028+ environment — with the stadium as a probable but not certain tailwind — are more defensible. The sound strategy for most downtown operators is to build a business that works with or without the stadium, while keeping the stadium in your 3-year growth planning.

    Frequently Asked Questions for Business Owners and Developers

    Q: Who do I contact if I want to be a stadium sponsor or investor?
    A: The City of Everett’s Economic Development office and the Everett Area Chamber of Commerce are the primary points of contact for private investment conversations about the Outdoor Event Center.

    Q: What happens to the 28 parcels being acquired for the stadium site?
    A: The City of Everett will negotiate acquisition of the 28 privately owned parcels making up the stadium block. Property owners on that block are in active discussions with the city. Existing buildings fronting Hewitt Avenue are excluded from the acquisition.

    Q: Will there be parking requirements near the stadium?
    A: Parking for the new stadium is planned to use existing downtown parking structures and surface lots rather than stadium-specific new parking. This is standard for urban infill venues and has implications for nearby parking operators and garages.

    Q: What is the timeline for the stadium project?
    A: The revised timeline: funding/lease/acquisition complete (2026), construction start (2027), opening for AquaSox and USL (2028).

    Q: Is Hewitt Avenue infrastructure being upgraded as part of the stadium project?
    A: Street and utility infrastructure improvements associated with the stadium site are part of the city’s project scope, though specific scope details are still in design. The Imagine Everett comprehensive plan includes broader downtown infrastructure investment that overlaps with the stadium area.

    Related: Everett’s $120M Stadium Gap: What Has to Happen Before Ground Breaks | Everett’s Downtown Stadium Price Tag Climbs to $120M | Exploring Everett

  • Everett Utility Tax 2026: What Local Business Owners and Landlords Need to Know

    Everett Utility Tax 2026: What Local Business Owners and Landlords Need to Know

    Q: How does Everett’s proposed utility tax increase affect local businesses?
    A: Everett’s proposal to double its utility tax from 6% to 12% would affect businesses both as direct water customers and, in the case of landlords, as pass-through collectors of higher embedded costs. The ordinance goes before the City Council for three readings beginning in April 2026, with a proposed July 1 effective date. No business vote or exemption process exists — if the council approves it, the rate applies to all customers.

    Everett Utility Tax 2026: What Local Business Owners and Landlords Need to Know

    Everett’s proposed utility tax increase is getting coverage as a household issue — $10.74 more per month for the average water customer. For businesses, the calculation is more complex, the dollar impact is larger, and the timeline requires action now to plan ahead.

    Direct Costs: Business Water Is Priced on Volume, Not Average Households

    The $10.74 per month figure is the city’s estimate for the average residential customer. Commercial water accounts are metered differently and billed at higher volumes — a restaurant, laundry, car wash, or office building with significant water consumption will see larger absolute increases than a single-family household.

    The rate structure change is proportional: the underlying 12% tax replaces the 6% PILT at all tiers. Businesses with high water use — food service, commercial laundry, building services, manufacturing — should pull their last three billing statements and model what a 6-point rate increase on the water/sewer line means in actual dollars per month. For a restaurant paying $800/month in water and sewer, the increase is approximately $80/month, not $10.74.

    Commercial Landlords: Embedded Costs and Tenant Leases

    Commercial landlords in Everett face a specific planning issue depending on their lease structures. Net leases that pass utility costs through to tenants directly will see the cost absorbed by tenants automatically. Gross leases where the landlord pays utilities and bundles the cost into rent require the landlord to absorb the increase or — depending on lease terms — pass it through.

    If you own commercial property in Everett with gross lease arrangements, review those lease agreements now. Many commercial leases include provisions for pass-through of government-imposed tax increases; the utility tax, as a formal municipal tax (not simply a rate increase), may fall within that language. Consult your lease agreements and, if needed, a commercial real estate attorney before July 1.

    Residential landlords whose tenants pay utilities directly will not see direct impact — their tenants absorb the rate change. Landlords whose buildings include water in the rent may face higher operating costs at lease renewal, which is the standard time to adjust rental rates accordingly.

    How the Wholesale Cascade Works for County Businesses

    Many businesses operating in Snohomish County outside Everett’s city limits — Lynnwood, Mukilteo, Edmonds, Marysville, and others — are served by utilities that purchase wholesale water from Everett. City Finance Director Mike Bailey explained the mechanism to the Everett Herald: “Our tax will be embedded in wholesale water costs, and then other cities can do what they will with their utility taxes.”

    This means a business in Lynnwood or Mountlake Terrace served by a utility that purchases from Everett will see the increased tax embedded in the wholesale price their utility pays — and that utility may pass the cost through to customers. The extent and timing of that pass-through depends on each individual utility’s rate-setting process and schedule.

    Businesses in these communities should contact their local water utility to understand when and how the increased wholesale cost will be reflected in their rates.

    The Budget Context: What Comes After the Utility Tax

    The utility tax would close approximately $7.5 million of Everett’s projected $14 million budget deficit for 2027. The remaining gap — roughly $6.5 million — has not yet been addressed by a specific public proposal. Options under city consideration include regionalizing library or fire services and a property tax levy lid lift (which would require voter approval).

    For business owners engaged in Everett’s economic development ecosystem — particularly those involved in commercial real estate, workforce housing, or downtown development — the utility tax decision is part of a larger picture of how Everett finances its growth. The Millwright District Phase 2, the $120 million stadium proposal, and Sound Transit’s Everett Link Extension are all long-term economic bets; the city’s capacity to invest in those bets depends on resolving its structural revenue problem. The utility tax is one piece of that solution.

    What Business Owners Can Do Before the Vote

    The Everett City Council is taking three readings on the ordinance beginning in April 2026. The Everett Chamber of Commerce and the Snohomish County Economic Alliance are both tracking the proposal. Business owners who want to engage can:

    • Attend Everett City Council meetings and participate in public comment during the three-reading period
    • Contact the City of Everett’s Business Resource Center about any assistance programs or exemption processes (note: no business exemption has been announced)
    • Engage through the Everett Chamber to coordinate a collective business community voice on the proposal
    • Review commercial lease agreements for utility tax pass-through provisions before July 1

    Frequently Asked Questions for Business Owners and Landlords

    Q: Is there a business exemption from the utility tax increase?
    A: No business exemption process has been announced. The rate change, if approved, applies to all water and sewer customers — residential and commercial.

    Q: How do I calculate my specific impact?
    A: Pull your last three utility bills and identify the water and sewer charges. Apply a 6% increase to those charges (doubling the embedded rate from 6% to 12%) to estimate your monthly increase. Large commercial users will see proportionally larger absolute increases than the $10.74 residential average.

    Q: When does the ordinance take effect and what’s the approval process?
    A: Three council readings begin in April 2026. The proposed effective date is July 1, 2026. No public vote is required — council approval through the ordinance process is sufficient.

    Q: What if my business is located outside Everett but served by a utility that buys from Everett?
    A: Your utility will absorb the increased wholesale cost and may pass it through to customers in future rate adjustments. Contact your local water utility for their timeline and plans.

    Q: What assistance is available for businesses struggling with utility costs?
    A: No specific commercial utility assistance program has been announced. The city’s stated assistance program expansion is targeted at low-income residential customers. Contact the City of Everett Business Resource Center for current programs.

    Related: Everett’s Proposed Utility Tax: The Full Story | Millwright District Phase 2: What 300+ New Waterfront Homes Mean for Everett | Everett’s $120M Stadium Has a $38M Funding Gap: Here’s the Full Breakdown

  • Millwright District Phase 2: A Complete Guide to Everett’s New Waterfront Neighborhood

    Millwright District Phase 2: A Complete Guide to Everett’s New Waterfront Neighborhood

    Q: What is the Millwright District in Everett?
    A: The Millwright District is the 10-acre second and largest phase of the Port of Everett’s Waterfront Place development. Built by private development partner Lincoln Property Company (LPC West) under a long-term ground lease with the Port, Phase 2 will deliver 300+ residential units, 60,000+ square feet of retail and restaurant space, and 200,000+ square feet of commercial and office space on Everett’s working waterfront. Construction began in late 2025 with units targeted to deliver starting in 2026.

    Millwright District Phase 2: A Complete Guide to Everett’s New Waterfront Neighborhood

    Everett’s waterfront has been one of the Pacific Northwest’s most ambitious urban transformation projects for the better part of a decade. Phase 1 of the Port of Everett’s Waterfront Place is now delivering — Restaurant Row is open, Tapped Public House debuted in March 2026, and the Net Shed Fish Market has been drawing crowds since December 2025. But the bigger transformation hasn’t started yet.

    The Millwright District — Phase 2 of Waterfront Place — is a full 10-acre neighborhood being built from scratch on Everett’s working waterfront. Here is what it is, who’s building it, what will be there, and why it matters for the city.

    Scale: What 10 Acres on a Waterfront Actually Means

    The Millwright District sits within the Port of Everett’s 65-acre Waterfront Place project, which is the Port’s $1 billion-plus bet on transforming industrial waterfront land into a mixed-use urban neighborhood. Phase 1 — Restaurant Row and its associated retail — delivered the hospitality anchor. Phase 2 is the residential and commercial core.

    The program for the Millwright District includes:

    • 300+ residential units — waterfront apartment homes on the marina edge
    • 60,000+ square feet of retail and restaurant space — a full neighborhood commercial district supporting the residential population and the broader waterfront draw
    • 200,000+ square feet of commercial and office space — bringing employers directly to the waterfront, something Everett’s downtown has struggled to do at scale

    These aren’t renderings or projections waiting for financing. Lincoln Property Company (LPC West), the Port’s selected private development partner, has an exclusive negotiating agreement and long-term ground lease with the Port. The first residential building’s groundbreaking was targeted for late 2025, and units are expected to begin delivering in 2026.

    Who Is Building It and Why That Matters

    The Port of Everett selected LPC West — the West Coast operating unit of Lincoln Property Company, one of the largest real estate firms in the United States — through a competitive process in late 2021. Lincoln Properties has a significant Pacific Northwest portfolio; its selection was a signal that the Port was serious about executing Phase 2 at scale with a developer who has the balance sheet and track record to deliver.

    The ground lease structure matters for understanding the project’s long-term economics. LPC West leases the land from the Port rather than purchasing it. The Port retains land ownership while the developer builds and operates the improvements. This arrangement generates long-term ground rent revenue for the Port while enabling private capital to fund the construction — a model that protects the public investment while allowing the development to happen faster than the Port could finance it alone.

    The Design: History Built Into the Architecture

    The Millwright District name reflects the site’s industrial heritage — this area of Everett’s waterfront once supported a booming lumber and shingle mill industry. The design team has embedded that history into the neighborhood’s physical form: architectural elements and street names reference the mill era, and a focal point of the district is a “workman’s clocktower” designed to resemble a smokestack, inspired by the Dey Time Register that mill workers used to punch in and out.

    The public realm design includes Timberman Trails — four connecting courtyards — and Champfer Woornerf, a “living street” designed to accommodate events like festivals and pop-up markets. The goal is a neighborhood that functions as a destination, not just a place where people happen to live.

    The marina edge location is the defining feature. Residents in the 300+ units will have waterfront access that doesn’t exist anywhere else in the Snohomish County housing market at this scale.

    What’s Already There: Phase 1 Sets the Stage

    Understanding Phase 2 requires understanding what Phase 1 has already delivered. Restaurant Row at Waterfront Place is now anchored by several tenants:

    • Tapped Public House — opened March 2, 2026, with what is claimed to be Snohomish County’s largest open-air rooftop deck
    • The Net Shed Fresh Fish Market and Kitchen — open since December 2025, already developing a strong local following for its waterfront fish market and miso-glazed sablefish
    • Rustic Cork Wine Bar — established Waterfront Place tenant
    • Marina Azul Cocina and Cantina — announced for 2026, bringing elevated Mexican food and 100+ tequilas to Restaurant Row

    The food and beverage foundation is solid. Phase 2’s residential population will walk directly to these restaurants — and the commercial and office space in the Millwright District will bring a daytime workforce population that sustains the restaurants beyond weekend tourist traffic.

    Connection to the Larger Picture

    The Millwright District is one of three major structural changes reshaping Everett’s downtown and waterfront simultaneously. The other two: the proposed $120 million downtown stadium (currently facing a $38 million funding gap) and Sound Transit’s Everett Link Extension (targeting a 2037 Paine Field opening). If all three execute on their timelines, Everett’s waterfront and downtown in 2030 will look nothing like the Everett of 2020.

    The Millwright District is the piece with the most secured private capital behind it and the clearest execution path. The stadium and light rail are subject to public funding approvals and political processes. Lincoln Properties’ ground lease is a private commitment with a contractual obligation to perform.

    Frequently Asked Questions About the Millwright District

    Q: When will the Millwright District apartments be ready to lease?
    A: The first residential building’s groundbreaking was targeted for late 2025 into early 2026. Units are expected to begin delivering in 2026, with full build-out over several years as the phased development completes. Watch the Port of Everett’s official communications for specific leasing timelines as they are announced.

    Q: Who is Lincoln Property Company?
    A: Lincoln Property Company is one of the largest real estate companies in the United States. LPC West is its West Coast operating unit, active in Washington, Oregon, California, and Idaho since 2005. The company was selected by the Port of Everett through a competitive RFP process in 2021.

    Q: Will there be affordable housing in the Millwright District?
    A: The Millwright District is a market-rate development under a private ground lease. Specific affordability requirements, if any, are governed by the terms of the ground lease agreement between LPC West and the Port of Everett. No public affordability set-aside has been announced.

    Q: What is the total cost of the Waterfront Place project?
    A: The Port of Everett has described Waterfront Place as a $1 billion-plus transformation of 65 acres of working waterfront. The Millwright District represents a significant portion of that investment, with construction funded primarily through private capital from Lincoln Properties under the ground lease structure.

    Q: How does the Millwright District connect to the rest of downtown Everett?
    A: The waterfront is approximately a 10-15 minute walk from Everett’s downtown core along Grand Avenue and the waterfront trail system. A planned hotel component within Waterfront Place and the potential addition of light rail connectivity via the Sound Transit Everett Link Extension (targeting 2037) would strengthen that connection over time.

    Q: What businesses will be in the Millwright District’s retail space?
    A: Specific tenants for the 60,000+ square feet of retail and restaurant space have not been publicly announced as of spring 2026. Leasing for the commercial and retail components is expected to be announced as construction progresses. The existing Restaurant Row restaurants at Phase 1 are immediately adjacent to the Millwright District footprint.

    Related: Everett’s $120M Stadium Has a $38M Funding Gap: Here’s the Full Breakdown | The Net Shed Fish Market and Kitchen: Three Months In, It’s Worth the Hype | Marina Azul Cocina and Cantina Is Coming to Everett’s Waterfront

  • The Real Estate Agent WordPress Post-Publish Checklist: 7 Steps Every Listing and Blog Post Needs

    The Real Estate Agent WordPress Post-Publish Checklist: 7 Steps Every Listing and Blog Post Needs


    Tygart Media — Real Estate Content Strategy

    The Real Estate Agent WordPress Post-Publish Checklist: 7 Steps Every Listing and Blog Post Needs

    By Tygart Media Updated: April 12, 2026
    Why real estate content needs a post-publish checklist: Real estate agents invest significant time in neighborhood guides, market reports, and buyer/seller process content. The optimization layer that determines whether a buyer finds that content — title tag, meta description, local entity references, schema, FAQ section — is almost never applied after publication. The 7-step post-publish checklist applies these signals to existing articles without rewriting content, converting published articles into optimized assets that rank for local buyer and seller queries.

    The 7-Step Real Estate WordPress Post-Publish Checklist

    1. Rewrite the title tag for buyer-stage search intent — Match how buyers actually phrase their search. “Oakwood Heights Neighborhood Guide” → “Living in Oakwood Heights: Schools, Market Conditions & What Buyers Need to Know.” Lead with the neighborhood name, include the most-searched aspect (schools or market), and stay within 50–60 characters. For market reports: “[Neighborhood] Real Estate Market Update: Q1 2026 Conditions for Buyers and Sellers.”
    2. Write a meta description that converts neighborhood searches to clicks — Delete the auto-generated excerpt. Write 140–155 characters specific to what a buyer searching that neighborhood actually wants: “Thinking about Oakwood Heights? Get school ratings, current median prices ($487K Q1 2026), commute times, and what locals love most. Talk to a local agent.” This is copy that converts — and it signals to Google that the article serves a buyer’s actual intent.
    3. Add named local entity references to the content — Inject 3–5 named geographic and institutional entities: the specific school names and district, the highway or transit reference, the MLS board for any market data, and the HOA name if applicable. If the article mentions “good schools,” rewrite to name the schools. If it mentions “easy freeway access,” name the freeway. Entity specificity is what separates genuine local expertise from generic real estate content.
    4. Add a neighborhood FAQ section with FAQPage schema — Write 6–8 questions targeting the buyer research phase for that specific neighborhood: “What schools serve [neighborhood]?”, “What is the median home price in [neighborhood]?”, “Is [neighborhood] a good investment?”, “How is the commute from [neighborhood] to downtown?” Add FAQPage JSON-LD schema alongside the visible FAQ section — both are required for People Also Ask eligibility and AI Overview citation.
    5. Add LocalBusiness schema connecting the article to the agent entity — Inject Article schema with the agent as author (with name, real estate license number if published, and brokerage affiliation) and LocalBusiness schema connecting the content to the agent’s geographic service area. This machine-readable entity connection is what AI systems use to associate neighborhood expertise with a specific local agent — turning a content citation into agent brand recognition.
    6. Set a visible Last Updated date with dateModified schema — Add “Last updated: [quarter, year]” near the article top, especially for market data content. Update the dateModified field in Article JSON-LD schema to match the actual content update date. Buyers and sellers actively check content freshness for market data — a 2023 market report seen in 2026 destroys credibility. Quarterly updates to the data section, with a visible date update, maintain the article’s authority and ranking freshness signals.
    7. Add internal links to and from neighborhood and service pages — Link from the neighborhood guide to your home valuation page (“Curious what your Oakwood Heights home is worth?”), your buyer consultation page, and any related neighborhood or market report. Then update those destination pages to link back to the neighborhood guide. Bidirectional internal linking establishes topical depth, guides buyers through the journey from research to contact, and passes authority between your highest-traffic content and your conversion pages.
    These 7 steps applied to your 10 highest-traffic neighborhood guides and market reports is the scope of WordPress content optimization for real estate agents through SiteBoost for real estate. Every step pushed live via WordPress REST API — your content unchanged, optimization infrastructure added.

    Frequently Asked Questions

    Which of the 7 steps has the highest impact for real estate agent content?

    Step 3 (named local entity injection) and step 4 (FAQPage schema) produce the fastest measurable results for real estate content. Named school district entities, specific transit references, and MLS board citations create the geographic entity depth that distinguishes genuine local expertise from generic content — the primary signal Google uses for local real estate rankings. FAQPage schema enables People Also Ask placement within 2–4 weeks for neighborhood-specific buyer questions. Step 1 (title tag rewrite) has the highest impact on click-through rate from existing search impressions — changing “Neighborhood Guide” to a buyer-intent title immediately improves organic CTR.

    Should real estate agents optimize all their articles or just the most important ones?

    Prioritize by neighborhood importance and existing traffic. Start with your primary farm neighborhoods — the areas where you do the most business and have the deepest knowledge. These guides have the highest ROI because you can write the most specific, authoritative content. Apply all 7 steps to these high-priority guides first. Then systematically work through secondary neighborhoods and market reports. New content published after the checklist is established should have all 7 steps applied at publication rather than retroactively — establishing the optimization habit at the point of creation.

    Does real estate content optimization require coding or developer access?

    No coding or developer access is required. Title tags and meta descriptions update through post fields or SEO plugin fields. Entity references and FAQ sections are text additions to existing content. FAQPage, LocalBusiness, and Article JSON-LD schema blocks are injected as HTML blocks in post content. The WordPress REST API handles all of these changes directly — no theme modifications, no plugin configuration, and no server access needed. The only setup requirement is a WordPress Application Password for REST API authentication, which any agent can generate from their WordPress admin panel in about 30 seconds.

    Sources: SLT Creative, “The Complete Step by Step Guide to Real Estate SEO” (February 2026); Digital Agent Club, “Real Estate Digital Marketing 2026” (November 2025); W3Era, “Real Estate SEO Guide for Agents & Brokers 2026”; Marketing LTB, “10 Best Real Estate SEO Agencies in 2026”
  • How Real Estate Agents Get Found in AI Search Before Buyers Contact Anyone

    How Real Estate Agents Get Found in AI Search Before Buyers Contact Anyone


    Tygart Media — Real Estate Content Strategy

    How Real Estate Agents Get Found in AI Search Before Buyers Contact Anyone

    By Tygart Media Updated: April 12, 2026
    The AI pre-search reality for real estate: Gartner projects up to 25% of traditional search volume will migrate to AI tools by the end of 2026. In real estate, this means buyers and sellers are asking ChatGPT, Perplexity, and Google AI Overviews questions like “What’s the best neighborhood in [city] for families with young kids and walkable schools?” and “How competitive is the [city] real estate market for buyers right now?” — before they open a browser tab, before they visit Zillow, and before they contact an agent. The agent whose content is cited in those answers enters the consideration set at the very beginning of the buyer’s journey.

    Why AI Citation Matters More Than Position 1 for Real Estate

    Traditional real estate SEO chased position 1 rankings for local keywords. AI citation operates differently: it targets the research-phase questions that precede any specific property or agent search. A buyer who asks ChatGPT “what is [neighborhood] like for a family moving from out of state” is not yet searching for a property. They’re building a mental model of the market. The agent cited as the authoritative source on that neighborhood during this phase establishes credibility before any competitor has been considered.

    According to Digital Agent Club’s 2026 real estate digital marketing analysis, AI search queries in real estate are “full-sentence questions people actually ask out loud” — specifically neighborhood character, school quality, market competitiveness, and commute viability. These are exactly the questions that well-optimized neighborhood guides and market reports are built to answer.

    How do real estate agents get cited in ChatGPT and Perplexity for neighborhood and market questions?
    Real estate agents earn AI citations for neighborhood and market queries when their WordPress content combines: ranking in the top 20 organic results for the query (the access prerequisite), named geographic entity references that AI systems can verify (school district names, transit corridors, MLS board as data source, NAR terminology for market conditions), direct-answer speakable blocks targeting neighborhood character questions (“what is [neighborhood] known for” and “what are the schools like in [neighborhood]”), and FAQPage JSON-LD schema making Q&A pairs machine-parseable. National portals have generic neighborhood pages. Local agents have genuine local knowledge encoded in entity-rich, schema-structured content — which is exactly what AI systems prefer to cite.

    The Four Real Estate Content Types That Earn AI Citations

    1. Neighborhood Character Guides

    The most AI-citable real estate content directly answers “what is [neighborhood] like?” — the question buyers ask AI before they search for properties. Guides with named school entities, commute corridor references, community character description, and price range context are machine-verifiable by AI systems against geographic and institutional data. A guide that says “Oakwood Heights is served by Lincoln Elementary (GreatSchools rating 8/10), is 22 minutes to downtown via I-90, and has a median home price of $487K per NWMLS Q1 2026 data” provides entity anchors that AI systems can cite with confidence.

    2. Market Condition Analyses

    Buyers ask AI “is [city] a buyer’s or seller’s market right now?” Market report content with specific MLS data, defined market condition criteria (months of supply, list-to-sale ratio), and a dated “last updated” date is AI-citable because it provides a verifiable, sourced, current answer to a question buyers actively ask during market research. Undated or unverified market commentary is not citable — AI systems evaluate content freshness before surfacing market data.

    3. Buyer and Seller Process Explainers

    Process questions are high-citation opportunities: “how does the home buying process work,” “what is earnest money,” “how do real estate contingencies work,” “what does days on market mean.” These are universal questions with verifiable, direct answers that don’t require geographic specificity. FAQPage schema targeting these questions earns both People Also Ask placements and AI citation for the specific process queries buyers ask AI assistants during active home search.

    4. Local Market Comparison Content

    “[Neighborhood A] vs [Neighborhood B]” comparison content is highly AI-citable because it directly answers one of the most common pre-decision buyer questions. AI systems surface content that provides the specific comparison a buyer is asking about — school district comparison, price difference, commute difference, neighborhood character comparison. An agent who writes authentic, data-backed neighborhood comparison content owns a content type that neither national portals nor most local competitors are producing.

    Geographic entity injection, speakable blocks targeting neighborhood AI queries, and FAQPage schema are the three GEO deliverables applied to real estate WordPress content through WordPress content optimization for real estate agents via SiteBoost.

    Frequently Asked Questions

    Which AI systems matter most for real estate agent visibility?

    Google AI Overviews has the largest reach — appearing at the top of results for real estate research queries including neighborhood character, school quality, and market condition searches. Perplexity is increasingly used by out-of-state buyers doing research before relocation because it cites sources inline, giving cited agents visible brand exposure. ChatGPT’s growing search integration captures the “which neighborhood should I consider” research questions that precede any specific search. All three evaluate similar content signals: named geographic and institutional entity references, direct-answer formatting, and FAQPage schema. Optimizing for one effectively optimizes for all.

    Can a new real estate agent website earn AI citations?

    Yes, for specific hyper-local queries with low competition. A new agent website with one deeply optimized, entity-rich neighborhood guide for a specific neighborhood can rank in positions 11–20 for that neighborhood’s character and school queries — and earn AI citations for those specific queries even without broad domain authority. The AI citation selection among ranking pages rewards content quality signals — entity depth, direct-answer structure, schema — not just ranking position. Starting with your primary farm area and building one genuinely authoritative guide is more effective than thin coverage of many neighborhoods.

    How is AI search optimization different from traditional real estate SEO?

    Traditional real estate SEO prioritized local signals — Google Business Profile, NAP consistency, location-specific pages, and review volume. AI search evaluates content quality signals: named geographic entities (school district names, transit references, MLS board citations), direct-answer formatting (speakable blocks with 40–60 word direct answers), and machine-readable schema (FAQPage, LocalBusiness, RealEstateListing). Traditional SEO remains the prerequisite — 97% of AI citations come from pages already ranking organically. But among ranking pages, AI citation requires the additional entity and schema layer that most real estate agents’ WordPress content currently lacks.

    Sources: Digital Agent Club, “Real Estate Digital Marketing 2026” (November 2025); Luxury Presence, “194 Best Real Estate Keywords for 2025–2026”; Gartner 2025–2026 search migration projections (cited via Digital Agent Club); LLMrefs, “Answer Engine Optimization: The Complete Guide for 2026”