Tag: Real Estate

  • Snohomish County Has the Tightest Retail Market in Puget Sound: A Complete 2026 Guide to the 3.4% Vacancy Rate, Q1 Signals, and What It Means for Everett

    Snohomish County Has the Tightest Retail Market in Puget Sound: A Complete 2026 Guide to the 3.4% Vacancy Rate, Q1 Signals, and What It Means for Everett

    The Number That Defines Snohomish County Retail in 2026

    3.4 percent. That’s Snohomish County’s retail vacancy rate at the end of Q4 2025, per Kidder Mathews’ regional retail market data. To understand what that number means, you need the comparisons. The broader Seattle metro ended 2025 at 4.0% and was trending upward. Portland hit 4.8% retail vacancy in Q1 2026. King County’s retail vacancy was rising through the back half of 2025. By every regional measure, Snohomish County is the tightest retail market in Puget Sound.

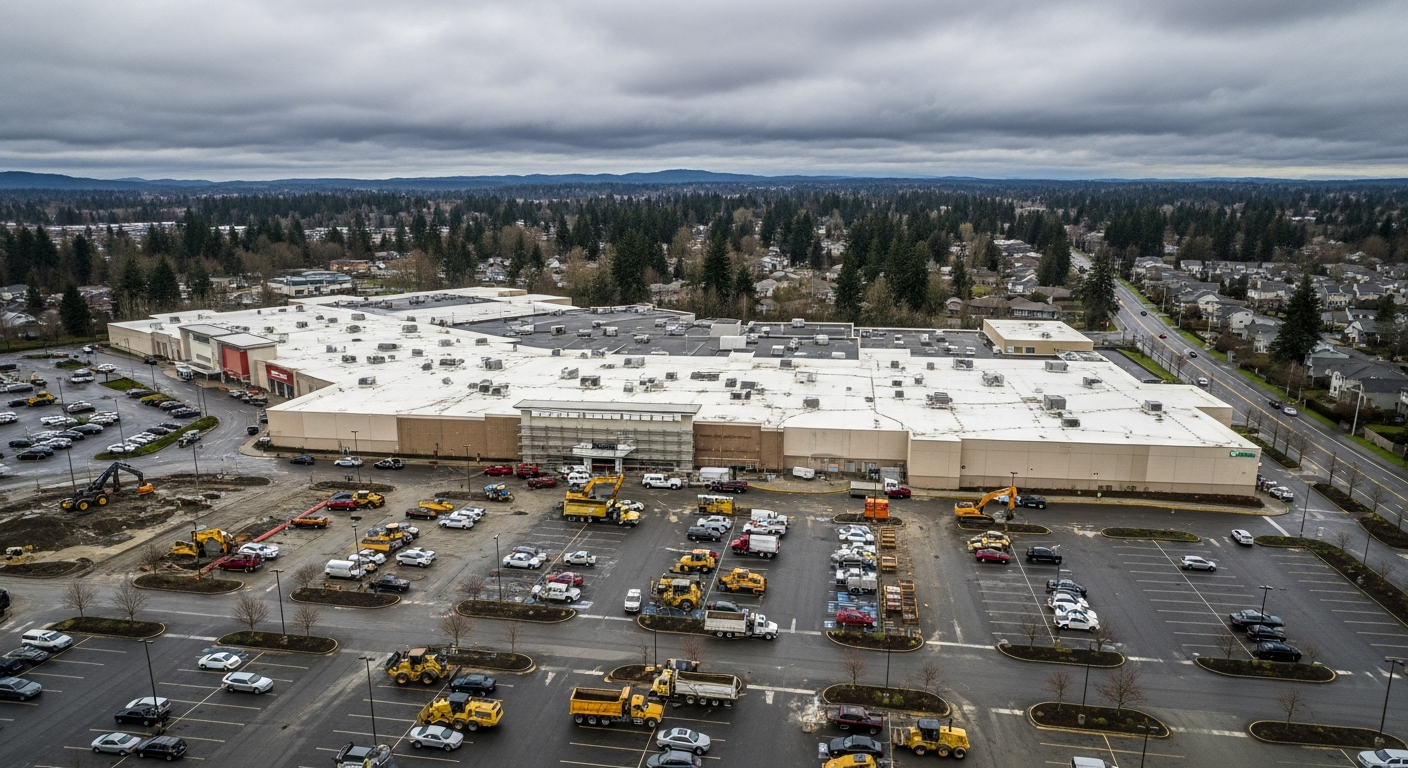
    That’s been true for most of the past three years. And it’s driven by a simple physical reality: almost no new retail square footage has been built in Snohomish County. The last major new shopping center project was years ago. When no new space enters the market, vacancy stays low regardless of whether new tenants are eager to enter.

    What Q1 2026 Is Showing: The First Signs of Softening

    Kidder Mathews’ Q1 2026 retail market data, published by The Registry Pacific Northwest on April 8, 2026, introduced two new phrases into the Snohomish County retail conversation: vacancy is “creeping higher,” and tenants are “growing more selective.”

    These are measured words. This is not a distressed market. But they signal that the absolute floor-tight conditions of 2023–2025 are beginning to soften at the margins. More tenant options are emerging. Lease negotiation dynamics are shifting slightly toward the tenant side. Existing landlords still have strong occupancy and pricing power, but the trend line is worth watching.

    The Q1 2026 data comes against a backdrop of visible vacancy events in downtown Everett. The Bank of America branch on the corner of Colby Avenue and Everett Avenue — occupied for 60 years — went vacant in early 2026, leaving one of downtown’s most prominent corners empty. That one departure doesn’t make a market. But it’s the kind of anchor-tenant exit that shapes perceptions of downtown retail health.

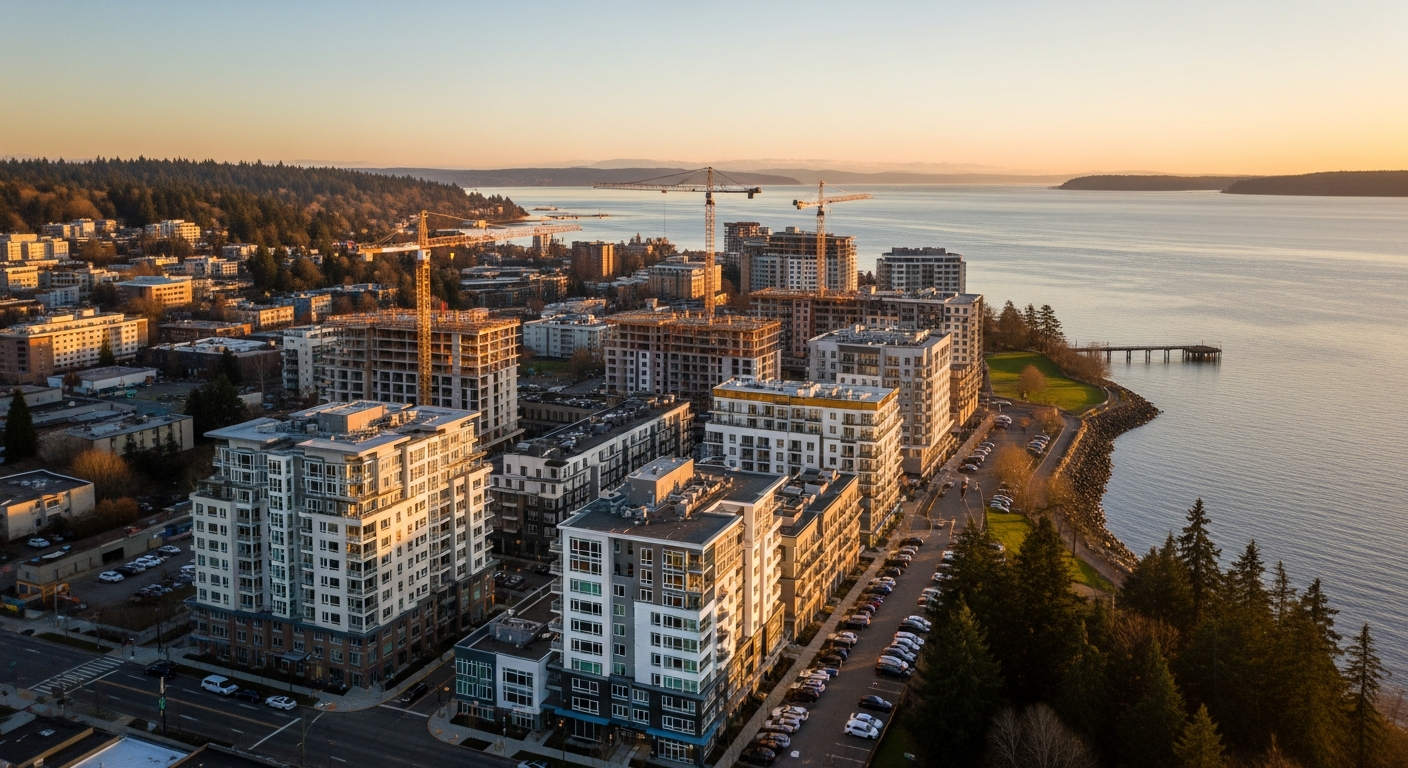
    What This Means for Waterfront Place at the Port of Everett

    Waterfront Place — the Port of Everett’s emerging restaurant and retail district on the marina — opened several tenants in 2025 and 2026, including Jetty Bar & Grille and Marina Azul. The tight countywide market provides context for the pace of tenant recruitment: quality food and beverage operators in Snohomish County have options and are being selective. Waterfront Place competes with downtown Everett, Lynnwood’s retail corridors, and emerging Millwright District space for the same pool of prospective tenants.

    The advantage Waterfront Place has is differentiation — there is no other marina-adjacent dining district in Snohomish County. That uniqueness gives it a claim on tenants who want that specific positioning. The challenge is that the universe of tenants who specifically want a marina location is smaller than the universe of tenants who would consider any well-trafficked Everett location. The Waterfront Place complete guide covers the full tenant roster and what’s coming.

    What This Means for Millwright District Phase 2

    Millwright Phase 2 is the Port of Everett’s next major mixed-use development at the waterfront — adding residential density and ground-floor retail to the marina district. It’s in pre-leasing. The countywide tight market is a genuine asset for its retail program: when you’re trying to recruit tenants, being located in the tightest retail market in Puget Sound is a better starting position than being in the loosest.

    The Q1 2026 softening trend is worth watching for Millwright’s pre-leasing timeline. If vacancy continues to “creep higher” through 2026, the window of maximum landlord leverage will narrow somewhat. Getting pre-leasing commitments signed during the current tight conditions is better than waiting until the softening becomes more pronounced.

    What This Means for Downtown Everett’s Broadway and Hewitt Corridors

    Downtown Everett’s retail health is more complex than the countywide number suggests. The Hewitt Avenue and Broadway corridors have seen both openings and closures in 2025–2026. The Bank of America departure left a high-visibility corner dark. New entrants like Butter Notes Cafe on Broadway — specialty coffee with jazz programming and a podcast studio — represent the kind of independent retail that fills in where national chains won’t go.

    The tight countywide vacancy means that if you have a viable downtown retail concept, finding space is still the challenge — not finding demand. The riverfront retail analysis covers the Snohomish River waterfront retail picture, which is part of the same countywide story.

    The Broader Context: Why Snohomish County Stays Tight

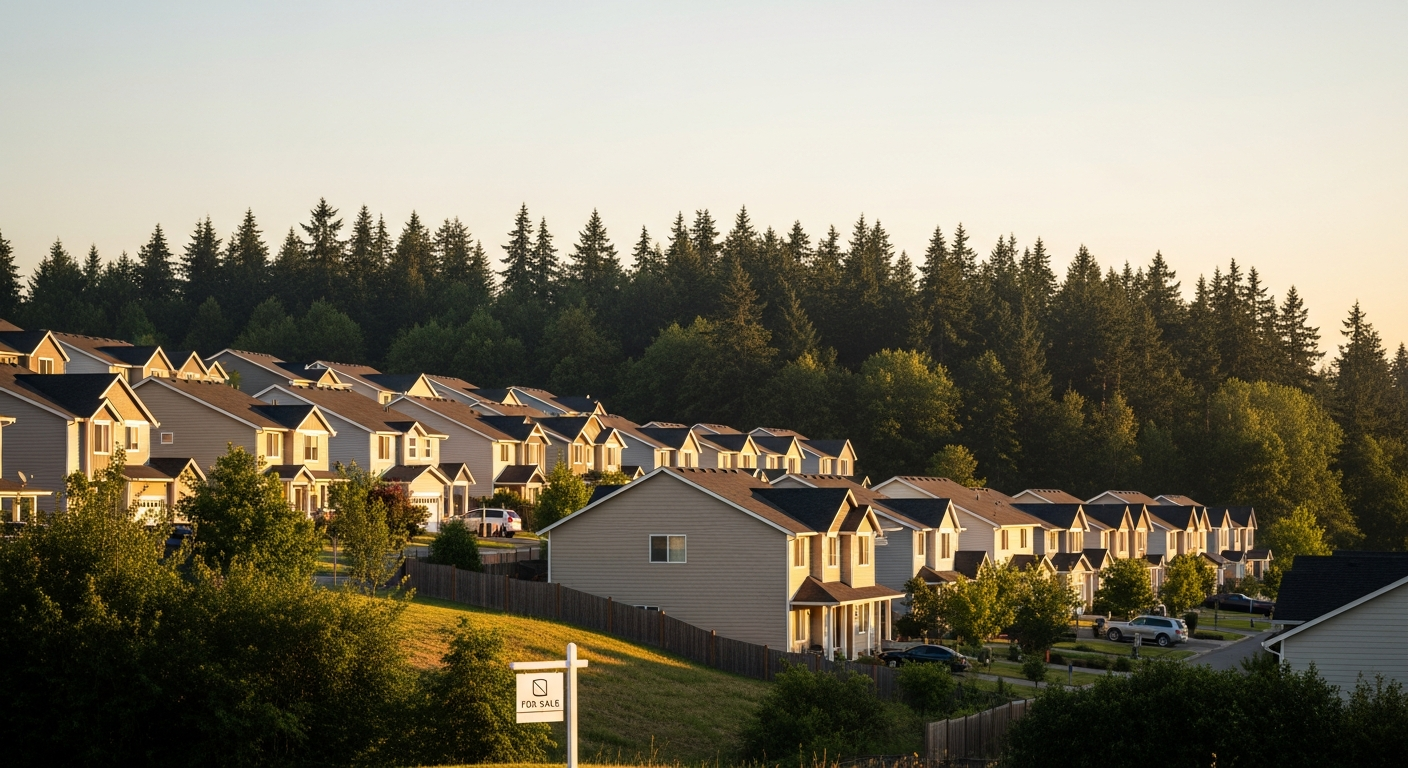
    Three structural factors keep Snohomish County’s retail market tighter than its neighbors: population growth (the county has grown consistently, adding household demand), limited new supply (almost no major new retail development for years), and an employment base anchored by Boeing, the Navy, and Paine Field that generates stable household incomes. Those factors don’t disappear with one quarter of softening. They’re the durable engine underneath the 3.4% number.

    The Q1 2026 data is a signal to watch, not a signal to act on in panic. Snohomish County retail is not in trouble. It’s at the end of an unusually tight cycle, normalizing toward regional equilibrium. That’s a healthy market movement.

    Frequently Asked Questions

    What is Snohomish County’s retail vacancy rate in 2026?

    3.4% at year-end Q4 2025, per Kidder Mathews data cited by the Everett Herald. Q1 2026 Kidder Mathews data (Registry Pacific Northwest, April 8, 2026) shows vacancy “creeping higher” but remains below the Seattle metro’s 4.0% and Portland’s 4.8%.

    Why is Snohomish County’s retail vacancy so low?

    Primarily because almost no new retail space has been built in years. When supply doesn’t increase, vacancy stays low regardless of demand conditions. Consistent population growth and a stable Boeing/Navy/Paine Field employment base provide steady retail demand on top of the supply constraint.

    How does Snohomish County compare to Seattle and Portland for retail vacancy?

    Snohomish County (3.4% Q4 2025) is tighter than the broader Seattle metro (4.0% Q4 2025, climbing) and significantly tighter than Portland (4.8% Q1 2026). It is the tightest retail submarket in the Puget Sound region.

    What does the retail market data mean for Waterfront Place and Millwright Phase 2?

    The tight market provides leverage for landlords recruiting tenants into new developments. However, the “more selective” tenant dynamic from Q1 2026 means quality tenants have options and aren’t rushed. Major new developments benefit from the overall tightness but need to differentiate on location and amenity to compete effectively for the best tenants.

    Is Snohomish County retail market heading toward higher vacancy?

    Q1 2026 data shows a “creeping higher” trend — a marginal softening after years of extreme tightness. This is a normalization, not a downturn. The structural supply constraint (very little new retail built) and population growth continue to support low vacancy. Watch for continued Q2 and Q3 2026 data for more directional clarity.

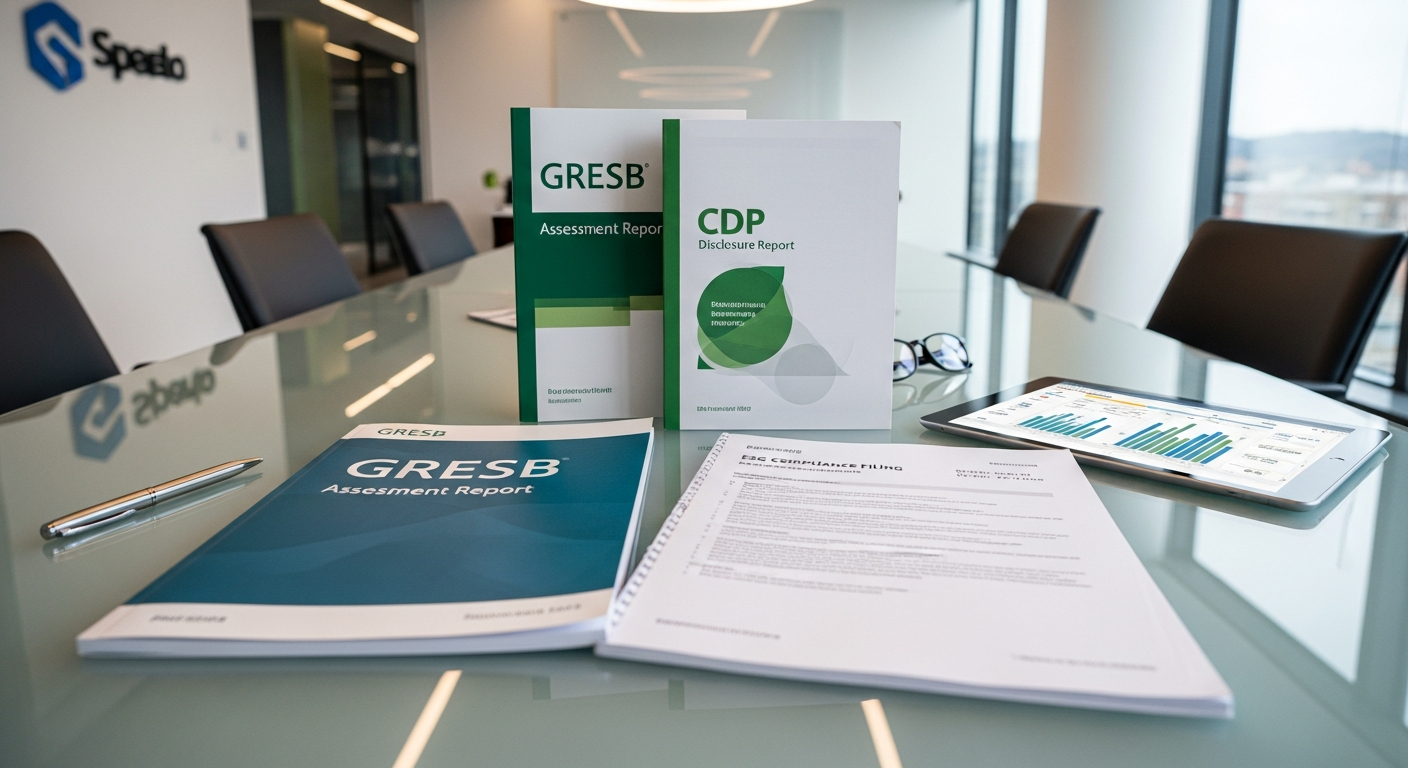
    What is the source for Snohomish County retail vacancy data?

    Kidder Mathews quarterly retail market reports. Q4 2025 data was cited by the Everett Herald in February 2026. Q1 2026 data was published by The Registry Pacific Northwest on April 8, 2026.

  • Snohomish County Apartment Sales Hit $640 Million in 2025 — Here Is What the Investment Recovery Means for Everett

    Snohomish County Apartment Sales Hit $640 Million in 2025 — Here Is What the Investment Recovery Means for Everett

    How is the Snohomish County apartment investment market performing in 2026?
    Snohomish County apartment sales reached $640 million across 32 deals in 2025 — more than doubling from 2023 transaction volumes — as flat rents and stable vacancy created entry conditions that yield-focused investors found compelling. Average pricing settled around $294,557 per unit, and with 17,089 units still under construction regionally, capital is moving before the next supply cycle closes.

    Snohomish County’s Apartment Investment Market Hit $640 Million in 2025 — And the Capital Is Still Moving

    Most of the housing market coverage you’ve read about Snohomish County this year has been about buyers, sellers, and mortgage rates. That’s not the whole picture.

    While the for-sale residential market has been digesting a 51% inventory surge and buyers have been navigating 6.4% rates, a parallel story has been unfolding in the investment market — the institutional and private capital that buys, holds, and sells apartment buildings. And that story has a very different tone.

    Snohomish County apartment sales hit $640 million in 2025, according to a Kidder Mathews analysis reported by The Registry Pacific Northwest. That’s across 32 deals. The volume more than doubled from 2023 levels — the trough of what had been a significant pullback in multifamily transaction activity driven by rising interest rates and reset expectations.

    The question worth asking now: what do those investors see in Snohomish County, and what does their move back into the market mean for Everett specifically?

    Why the Market Reset the Way It Did

    To understand where we are, it helps to understand where we came from.

    The 2021-2022 apartment investment boom was driven by cheap debt and outsized rent growth. Cap rates compressed dramatically. Then the Federal Reserve raised rates, borrowing costs spiked, and sellers who bought in 2021-2022 at aggressive prices couldn’t hit the numbers that 2023-2024 buyers needed to see. Transaction volume crashed nationally, and Snohomish County wasn’t immune.

    The recovery that’s now playing out isn’t a return to 2021 pricing. It’s something more durable: a market where seller expectations have adjusted, where buyers can underwrite deals to current rent levels and get a yield, and where the operating fundamentals — occupancy, rent trends — are stable enough to justify putting capital to work.

    The Kidder Mathews data point on average price per unit illustrates this. At approximately $294,557 per unit with a 4% year-over-year decline from 2024 levels, pricing is off the peaks but far from distressed. That’s a reachable entry point for buyers who couldn’t compete in 2021-2022 and have been waiting.

    What Makes Snohomish County Attractive Right Now

    Apartment investors look at fundamentals first: vacancy rates, rent trends, and the supply pipeline.

    On vacancy, Kidder Mathews’ Q4 2025 Seattle-Puget Sound regional data shows multifamily vacancy holding at 7.4% year-over-year. That’s not tight — but it’s not distressed either. For a county where the job base is anchored by Boeing, Paine Field aerospace, the Naval Station, and a growing tech cluster along I-5, that vacancy rate reflects a market with durable demand drivers.

    On rent, the story for 2025 was flat. Everett’s rental market saw rents down roughly 2% year-over-year in 2025, to an average around $1,849 according to prior market data. That’s the downside. But for investors, flat rents in a well-employed market with a constrained land supply are different from flat rents in a market with weak fundamentals. Investors who can buy at current prices and hold for a rent recovery cycle are making a different bet than investors who overpaid during the growth phase.

    On supply, the regional construction pipeline is thinning. Roughly 17,089 units remain under construction across the Seattle-Puget Sound metro — a 23% decline from the prior year. That contraction means the supply overhang that compressed rents will start to clear in 2026 and 2027. Capital that moves now is positioning ahead of that clearing.

    What This Means for Everett Specifically

    Everett is not a monolith in this investment market. The specific submarkets attracting attention are worth understanding.

    The premium waterfront product — the Sawyer and Carling at Waterfront Place — has been holding occupancy at roughly 95% even as broader rents softened, with $2,202-$2,800 monthly rents demonstrating that the waterfront premium survives a soft market. For institutional investors, that occupancy and rent spread is a data point about the durability of location-driven demand.

    Lincoln Properties is underway on Phase 2 of Millwright District — 300-plus units in a mixed-use waterfront setting that will be the first large new-to-the-market supply at the Port of Everett waterfront in this cycle. When those units come online, they’ll reset the comp set for waterfront multifamily in Everett.

    Further south, the adaptive reuse pipeline is active. The Sage Investment Group conversion of the former Econo Lodge at 9602 19th St SE into 124 studio apartments (Phase 1 leasing August 2026) represents the workforce housing angle that Kidder Mathews noted in its investment outlook: value-add and workforce housing offer compelling yield opportunities where class-A development doesn’t pencil.

    The downtown core and the corridors adjacent to the new stadium site are also drawing attention from development capital, though in earlier-stage planning. The city’s approval of the $10.6 million stadium design package in late April sets a September 2026 construction start target for the 5,000-seat Outdoor Event Center — and stadium-adjacent development is a real category of investment thesis that capital is starting to evaluate.

    The Investor’s Lens vs. the Resident’s Lens

    It’s worth being honest about the tension here.

    When apartment investment capital flows into a market like Everett, it’s not always aligned with what existing residents need. Yield-focused buyers have incentives to optimize revenue per unit. Workforce housing conversions can displace existing tenants if not managed carefully. Rising investor interest in a market can precede rent pressure once the supply overhang clears.

    The city’s tools to manage this tension — the Affordable Housing Trust Fund, inclusionary zoning in new developments, the Housing Hope ecosystem, the EHA pipeline — matter precisely because the market is now active enough to require them.

    The $640 million in 2025 transaction volume tells us that capital has made a judgment: Snohomish County is on the right side of the Puget Sound affordability gradient, close enough to Seattle employment to benefit from overspill demand, with enough job diversity to hold occupancy through economic cycles. That judgment drives development, drives transactions, and ultimately drives the housing conditions that Everett residents live inside.

    Understanding how this capital thinks is part of understanding where Everett’s housing goes next.


    Frequently Asked Questions

    How much did apartment sales reach in Snohomish County in 2025?
    Snohomish County apartment sales reached $640 million across 32 deals in 2025, according to a Kidder Mathews analysis, more than doubling transaction volume from 2023 levels.

    What is the average price per apartment unit in Snohomish County?
    Average pricing was approximately $294,557 per unit in the most recent market data, down about 4% year-over-year from 2024 — reflecting pricing adjustments from the 2021-2022 peak.

    What is the apartment vacancy rate in the Snohomish County area?
    Kidder Mathews’ Q4 2025 data showed multifamily vacancy holding at 7.4% year-over-year across the Seattle-Puget Sound region. Everett’s specific figures track roughly with the broader market.

    Why are investors buying apartments in Snohomish County now?
    Flat rents, stable vacancy, and adjusted pricing from the 2021-2022 peak have created entry conditions that yield-focused buyers find workable. The thinning construction pipeline also suggests supply overhang will clear in 2026-2027, giving investors who buy now exposure to the next rent recovery cycle.

    What new apartment projects are coming to Everett?
    Lincoln Properties is underway on 300-plus units at Millwright District (Waterfront Place). Sage Investment Group is converting the former Econo Lodge on 19th St SE into 124 studio apartments with Phase 1 leasing targeting August 2026. Stadium-adjacent development opportunities are also being evaluated as the downtown Outdoor Event Center advances toward a September 2026 construction start.

    How does Everett’s apartment investment market compare to King County?
    Snohomish County typically offers lower per-unit pricing than King County submarkets like Bellevue or Seattle proper, while maintaining access to the same labor market. That affordability gradient is part of what draws yield-focused capital — investors can enter at lower basis points while capturing similar demand dynamics.

  • What the Theler Wetlands Restoration Tells Hood Canal Property Owners About Their Own Shoreline

    What the Theler Wetlands Restoration Tells Hood Canal Property Owners About Their Own Shoreline


    If you own waterfront property along Hood Canal, the project happening at Theler Wetlands in Belfair is worth understanding closely. It is one of the most carefully engineered shoreline restorations in the south Puget Sound, and the principles behind it — tidal reconnection, undersized-culvert replacement, set-back levee design — are the same principles increasingly showing up in shoreline permits, county code updates, and property-value assessments across Mason County.

    This is what Hood Canal property owners should know about the science, the timeline, and the policy direction Theler signals.

    What WDFW and HCSEG Actually Did at Theler

    The earthwork phase, completed in fall 2025, was substantial. The Hood Canal Salmon Enhancement Group (HCSEG) and the Washington Department of Fish and Wildlife removed a failing levee that had cut off roughly seven acres of estuary from Hood Canal’s tidal flow for decades. They replaced a 12-inch metal culvert — far too small to handle natural tidal exchange — with a 15-foot-wide concrete box culvert. They dug a new sinuous tidal channel through the rehabilitated wetland. And they raised a section of Northeast Roessel Road to serve as a set-back levee, moving the line of flood protection landward instead of armoring the original shoreline.

    The summer 2026 phase is the visible one: a 1,200-foot piling-supported elevated boardwalk through the restored marsh.

    Why It Matters for Your Shoreline

    The mechanics of what Theler does — restoring tidal connectivity, replacing undersized infrastructure, and using set-back rather than armored levees — match what Mason County and Washington state regulators are looking for when shoreline owners apply for permits today. If you have a bulkhead, an undersized culvert under a private driveway, or a failing seawall, the next round of permit conversations is increasingly going to look like the conversations that produced Theler.

    Three takeaways for property owners:

    • Undersized culverts are the single most common shoreline restoration target. A 12-inch culvert blocking tidal flow is the kind of feature that gets flagged on more than half of Hood Canal property assessments. Replacement, not repair, is the direction of policy.
    • Set-back levees protect property value better than armored shorelines. A bulkhead that fails in 20 years drops shoreline value sharply. A set-back design, like the raised section of Roessel Road, holds up because it works with tidal processes rather than against them.
    • Restored estuaries support adjacent property values, not just salmon. Healthy salt marshes filter water, dissipate wave energy, and stabilize the shoreline upstream and down. Properties next to functioning estuaries tend to require less ongoing maintenance.

    The Endangered Species Act Layer

    Hood Canal summer chum salmon are listed as threatened under the federal Endangered Species Act. That listing has direct consequences for shoreline permitting along the Union River, the canal’s south end, and any waterway with chum-bearing tributaries. Projects that improve summer chum habitat — like Theler — generally clear permits faster. Projects that may impair it face longer review timelines and more conditions.

    For property owners, the practical implication is that the closer your shoreline is to a chum-bearing estuary, the more aligned your project plans need to be with restoration-friendly design. Working with WDFW or HCSEG early in the process tends to be faster than fighting through a denied permit later.

    Public Access and Property Value

    The Theler boardwalk also matters for the broader north-Mason real-estate environment. Public-access amenities — restored trails, completed loop walks, accessible nature preserves — drive durable property values across waterfront and near-waterfront parcels. The Belfair area benefits when Theler is a complete, walkable destination rather than a half-closed construction site.

    Where to Watch the Project

    The preserve is at 22871 NE SR-3 in Belfair, off Highway 3 before the town center. HCSEG posts construction and trail-access updates at pnwsalmoncenter.org. WDFW’s Union River Estuary Restoration project page is the source for engineering and habitat detail.

    Frequently Asked Questions

    What is a set-back levee and why does it matter for property owners?

    A set-back levee is a flood-protection structure built landward of the original shoreline, allowing the natural tidal zone to function. At Theler, a section of Northeast Roessel Road was raised to serve as the set-back levee. For property owners, set-back designs typically permit faster than armored shorelines and hold up longer.

    Why are undersized culverts a target for restoration?

    Culverts that are too small — like the original 12-inch metal culvert at Theler — block tidal exchange, prevent fish passage, and tend to fail in storm events. Washington state policy has shifted heavily toward replacing undersized culverts with appropriately sized box culverts that allow full tidal flow.

    How big is the Theler restoration?

    Approximately seven acres of estuarine wetland habitat at the southeast end of Hood Canal. The earthwork phase finished in fall 2025; the summer 2026 phase will install a 1,200-foot elevated boardwalk through the restored marsh.

    Does proximity to a restored estuary affect property value?

    Healthy estuaries filter water, dissipate wave energy, and stabilize shorelines upstream and down. Properties adjacent to functioning estuaries typically require less ongoing maintenance, and public-access amenities like the Theler boardwalk support area-wide real-estate value.

    What does the Endangered Species Act mean for Hood Canal shoreline projects?

    Hood Canal summer chum are federally listed as threatened. Properties along chum-bearing waterways face additional review when permitting shoreline work. Projects designed to improve habitat tend to clear permits faster than projects that may impair it.

    Related coverage on tygartmedia.com: Hood Canal Property Owner’s Guide to Shellfish Access at Potlatch, Hood Canal Property Owners: What the Tahuya River Preserve Means for Water Quality.

  • Snohomish County’s April 2026 Housing Market Has a Number Most Reports Miss: Sales Activity Intensity at 54.9%

    Snohomish County’s April 2026 Housing Market Has a Number Most Reports Miss: Sales Activity Intensity at 54.9%

    What’s the headline number from the Madrona Group’s April 2026 Snohomish County housing report? Sales Activity Intensity came in at 54.9%, down only slightly from 56.0% the month before — meaning more than half of all listings still went pending within the first 30 days. Inventory tightened to 1.6 months. Mortgage rates moved up to 6.45%. Single-family resale prices held near $877,000 with homes selling at 99.8% of list price. The market did not slow down the way the inventory headlines suggested.

    You probably read yesterday’s coverage of Snohomish County’s April housing market — the NWMLS data showing inventory up 51.8% year-over-year, the median sale price at $738,000, the 2.8 months of supply. That is one accurate way to read this market. Here is another, also accurate, with very different implications.

    The Madrona Group dropped its April 2026 Snohomish County report this week, and it does not look like a market that lost its footing. It looks like a market that is moving slower at the top of the funnel — fewer homes coming on, fewer offers per listing, more buyer hesitation — but where the deals that do happen are happening fast and at strong prices.

    The number we want to focus on is Sales Activity Intensity — and we are going to explain it because it is not a number that shows up in every market report and most readers have never seen it framed this way.

    What Sales Activity Intensity actually measures

    Sales Activity Intensity is the share of all active listings that go pending within the first 30 days on the market. Not closed — pending. Pending is the moment a buyer’s offer has been accepted and the deal is moving toward closing. It is the moment when the market said yes.

    A 54.9% Sales Activity Intensity in Snohomish County for April 2026 means that more than one out of every two homes that listed last month had a buyer say yes within 30 days. That is a fast market. It is fast even after a small dip from March, when the same number was 56.0%.

    For comparison, a market that is genuinely cooling — homes sitting, sellers cutting prices, buyers waiting — typically shows Sales Activity Intensity drop into the 30s or below. When intensity drops below 30%, sellers start to see real concessions show up at the closing table. That is not what we have right now.

    What’s behind the number

    Three factors are working at once in the April 2026 Madrona Group data, and none of them point in the same direction:

    Mortgage rates moved up to 6.45%. That is up from earlier in the year and up enough to price some buyers out at the margin. Higher rates almost always slow demand. They have slowed it some — but they have not killed it.

    Inventory tightened to 1.6 months. A balanced market in real estate is usually 4 to 6 months of inventory. At 1.6 months, Snohomish County is still well into seller’s-market territory. Note this is the Madrona Group’s specific measurement — the broader NWMLS data on the same county shows 2.8 months because the two reports use slightly different inventory definitions and time windows. Both are true. The Madrona number is the tighter view.

    Single-family resale prices held near $877,000 with homes selling at 99.8% of list price on average. When buyers are paying within 0.2% of the asking price, they are not negotiating much. They are competing.

    Put the three factors together: rates went up, but the homes that are listed are still moving fast and selling at almost full asking. The buyers who are still in the market have stopped flinching.

    What this looks like on the ground in Everett

    Everett sits inside the Snohomish County data but does not behave exactly like the county average. The city’s median sale price runs lower than the county figure — Redfin had Everett’s most recent typical home value near $620,000, well under the $738,000 county median that NWMLS reported. The reasons are familiar: more starter homes, more condos, more older housing stock, more variation between neighborhoods.

    The Sales Activity Intensity dynamic still applies in Everett. A waterfront condo at Sawyer or Carling priced reasonably is going pending in days, not weeks. A starter home in Delta or Riverside priced at the neighborhood median is doing the same thing. What sits is what is overpriced. What sits is what assumes the market is still set to 2022.

    We have seen this pattern in our own coverage — the April 2026 condo market story we published last week showed Snohomish County condo averages up 4.4% year-over-year and Everett condos selling in a 22-day median at 99% of list. That is the same fast-but-narrow market the Madrona report is describing, just on a different property type.

    What this means for buyers right now

    If you are buying in Snohomish County in May 2026 and you have been waiting for the market to break, the Madrona data is the latest signal that a wholesale break is not coming. Specific properties will be soft. Specific sellers will negotiate. But the broad market is still leaning seller.

    A few practical takes from how this number sits:

    • Stop waiting for the price to come down before you make an offer. At 54.9% Sales Activity Intensity, the home you are watching probably already has another offer. The price you saw on Zillow last Tuesday may not be the price that closes.
    • Get rate-locked before you write an offer. With rates at 6.45% and trending up rather than down, the rate you can get this week is probably better than the rate you can get if you wait three weeks. A 0.25% rate move on a $620,000 Everett home is roughly $90 a month for the life of the loan.
    • The 99.8% of list price number is the real number. If you are writing offers at 95% of list and watching them lose, that is why. The market is not built for 95% offers right now.

    What this means for sellers right now

    If you are selling in Snohomish County, the Madrona data is telling you something sellers sometimes miss: price-to-list discipline matters more than ever.

    • Price it right and it goes pending in 30 days. Price it 5% high and it sits — and the market has been trained to read sitting as a problem. The 30-day window is the window where intensity captures your home as a fast mover. Past 30 days, you are competing with newer listings.
    • The 99.8% of list price number cuts both ways. You probably will not get more than asking. You also will not have to take much less than asking. So price it where you are happy to close.
    • Inventory is tight but moving up. The Madrona number says 1.6 months, the NWMLS number says 2.8 months — both are tighter than 4-6, but both are looser than 12 months ago. If you have been on the fence about listing, the supply side is finally giving you some company on the market. Earlier was easier. Now is still good.

    How this fits with everything else we know about Snohomish County in April 2026

    This week alone we have seen:

    • The NWMLS report showing 51.8% year-over-year inventory growth and 2.8 months of supply
    • The Madrona Group report showing 1.6 months supply and 54.9% Sales Activity Intensity
    • Snohomish County condo data showing 4.4% YoY appreciation and 22-day Everett median time on market
    • Mortgage rates moving up to 6.45%, the highest level since fall 2025
    • The Sage Investment Econo Lodge studio-apartment conversion announcement in South Everett — 124 new units coming online by August 2026

    None of those data points contradict each other. They are all measuring different parts of the same market. The market is more inventory than it had, fewer offers than it had, slower at the top of the funnel — and still selling fast and near asking when the property is priced right. That is a more complicated story than “the market is hot” or “the market is cooling.” It is the market being different things at the same time depending on which lens you bring.

    The Madrona Group report adds a useful lens: the velocity at which deals close, not just the count of homes listed. That velocity number is what tells you whether the market still works. In April 2026, in Snohomish County, it still works.

    Frequently Asked Questions

    What is Sales Activity Intensity in real estate?

    Sales Activity Intensity is the percentage of all active listings that go pending — meaning a buyer’s offer has been accepted — within the first 30 days on the market. It is a velocity measure of how fast the average home is moving. Above 50% indicates a fast seller’s market; below 30% indicates real cooling.

    What was Snohomish County’s Sales Activity Intensity in April 2026?

    54.9%, according to the Madrona Group’s April 2026 Snohomish County housing market report. That is down slightly from 56.0% in March. Both numbers indicate a strong seller’s market.

    What are mortgage rates in Snohomish County right now?

    The 30-year fixed rate referenced in the April 2026 Madrona report is 6.45%. Rates have ticked up from earlier in the year. Individual rate quotes vary by lender, credit score, down payment, and loan size.

    Why does the Madrona Group report say 1.6 months of inventory and the NWMLS report say 2.8 months?

    They use slightly different inventory definitions and time windows. The Madrona Group’s measure tends to capture a tighter view focused on actively moving listings. NWMLS uses a broader inventory definition that includes some listings the Madrona view excludes. Both are accurate; both reflect a Snohomish County market still well below the 4-6 month range that defines balance.

    What is the median home price in Snohomish County in April 2026?

    The April 2026 NWMLS report listed the county median sale price at $738,000. The Madrona Group report references single-family resale prices holding near $877,000, which uses a different scope (single-family resale only, with different geographic weighting). The two numbers describe overlapping but not identical slices of the market.

    Is now a good time to buy a home in Everett?

    “Good” depends on your specific situation — your down payment, your job stability, your timeline, the neighborhood you’re targeting. What the April 2026 data says broadly: prices are not falling, inventory is up but still tight, and rates are higher than they were earlier in the year. Waiting for a wholesale price break is currently not what the data supports. Talk to a local agent and a local lender about your specific math.

    Is now a good time to sell a home in Everett?

    Yes, if it is priced right. The market data says homes priced at the neighborhood median are going pending within 30 days at 99.8% of list. Homes priced 5%+ above the neighborhood median sit. Pricing discipline is the difference between a fast sale and a long sit.

  • Everett Mall’s Hub Vision Just Got Smaller: Brixton Capital Files for Self-Storage and Office Where Topgolf Was Going

    Everett Mall’s Hub Vision Just Got Smaller: Brixton Capital Files for Self-Storage and Office Where Topgolf Was Going

    What just changed at Everett Mall? Brixton Capital — the mall’s owner — has scheduled a May 19, 2026 pre-application meeting with the City of Everett to convert a portion of the existing enclosed mall into a self-storage facility, with a 60,000-square-foot proposed office sitting where Topgolf’s hitting bays were going to go. Topgolf was supposed to be the Hub @ Everett’s anchor tenant. Now it may not happen at all.

    For two years the story we got told about Everett Mall was the Hub. Brixton Capital — the San Diego-based real estate group that bought the property — and the City of Everett came out together in 2024 with renderings of an outdoor walkable destination, retail recolored from the inside out, and a 68,000-square-foot, three-level Topgolf as the anchor pulling everyone in. The permits were filed. The 11-acre site was mapped. The narrative held.

    That narrative is now bending.

    On the City of Everett’s permitting portal this week, Brixton Capital has scheduled a May 19, 2026 pre-application meeting for a project described as “the interior demolition of the existing enclosed mall structure and the conversion of a portion of the building into a self-storage facility. The scope also includes subdivision actions to place the proposed storage use on a separate legal parcel.”

    That alone would just be news that the demolition we’ve all been waiting for is finally getting paperwork moving. But the latest site plan that came in with the application tells a different story.

    What the new site plan shows

    Two things sit on the new Brixton site plan that were not on the Hub renderings.

    The first is a single-story building labeled “Everett Mall Self Storage.” It sits where a parking lot was going to be in the Hub vision — so it is not directly displacing Topgolf. But it is also not what anyone signed up for when this redevelopment started. There are already a dozen self-storage facilities within five miles of the mall. None of them are destinations. None of them generate the foot traffic that a mall reinvention needs to work.

    The second is more telling: a 60,000-square-foot building labeled “Proposed Office” that sits squarely on the footprint where the Topgolf hitting bays and outfield were going to go. The old LA Fitness building, which was supposed to come down to make room for Topgolf, now appears in the plan as something that will either be salvaged or replaced to provide that office space.

    Topgolf needs the area marked for the office. The office is in the area Topgolf needed.

    The two plans cannot both be true.

    Why this might be happening

    Topgolf’s parent company has been in restructuring mode since the same window the Everett permits were getting approved. Topgolf Callaway Brands announced a corporate split, then Topgolf CEO Artie Starrs left for Harley-Davidson in 2025. On January 1, 2026, private equity firm Leonard Green & Partners completed an acquisition of a 60 percent stake in Topgolf from Topgolf Callaway Brands for approximately $1.1 billion. Industry coverage has framed the entertainment chain’s recent decline as a problem of over-expansion — too many venues opened too fast, with the new ones cannibalizing the older ones.

    In other words: Topgolf is in pullback mode, not expansion mode. New venues that were promised but never officially confirmed by Topgolf corporate — like Everett — are exactly the kind of project that quietly disappears in a private-equity restructuring.

    Neither Brixton Capital nor Topgolf has officially said the Everett venue is dead. The City of Everett has not announced a change. But the new site plan does the talking.

    What we covered before — and what’s different now

    We wrote about The Hub @ Everett a week ago, on April 25, when the story was that Topgolf was stuck — permitted in January 2025, but on hold pending corporate restructuring. The construction never started. The 11-acre footprint sat untouched. At that point the question was whether Topgolf would eventually break ground or whether Brixton would have to find a new anchor.

    The May 19 pre-application meeting is the answer to that question. Brixton is not waiting on Topgolf anymore. Brixton is moving forward with a different building program for that footprint. Even if Brixton hopes Topgolf eventually shows up, the site plan being submitted to the City does not assume Topgolf shows up. That is the meaningful change.

    It is also a quiet downgrade of what The Hub was supposed to be. A self-storage building and a 60,000-square-foot office building are not the kind of tenants that bring people to a mall on a Saturday. Alderwood Mall down in Lynnwood is full on Saturdays. People circle the parking lot waiting for spots. That is what a working mall in 2026 looks like. A storage facility and a cubicle building is not in that category.

    What this means for the larger Everett Mall picture

    The Hub @ Everett sits on 11 acres in the Twin Creeks neighborhood and is the largest single retail-redevelopment project in South Everett. The mall as a whole is roughly 800,000 square feet of building on a much larger campus. Brixton’s original sales pitch for The Hub assumed Topgolf would draw the foot traffic, which would justify upgrades to the rest of the campus — Ulta Beauty and At Home are already moving into the former Sears box, and the relocated Mall Station opened in December 2025. The walkable outdoor reorientation only works if the anchor pulls.

    If the anchor turns out to be a storage building and an office, the rest of the upgrade math gets harder. Tenants pay rent based on the foot traffic they expect. Foot traffic projections that assumed a Topgolf are not the projections you get with self-storage.

    There is still room for another pivot. Brixton could find another entertainment anchor — a movie theater, a family entertainment center, a fitness destination — and the storage and office plans become the backup. The May 19 meeting is a pre-application discussion, not a building permit. Things can still change between now and the actual permit filing.

    But for right now, what the City of Everett’s permitting portal shows is a mall that planned to be a destination and is being re-planned around uses that nobody drives across town to visit.

    The May 19 pre-application meeting: what it is and what it isn’t

    A pre-application meeting in Everett is the very first formal step a developer takes with the city before submitting actual building permits. It’s a planning-staff conversation — the developer brings their concept, the city tells them what regulations will apply, what studies they’ll need, what review process the project will go through. It is not a public hearing. There is no vote. There is no decision.

    But it does signal seriousness. Pre-application meetings cost money to schedule and prepare for. Developers don’t book them for ideas they’re not pursuing. When a project shows up on the pre-app calendar, it means the developer has internal alignment to keep moving forward with that specific concept.

    So the May 19 meeting is the equivalent of Brixton telling the city: this is what we’re actually planning to build now. The Hub @ Everett brochure is no longer the operative document. The new site plan is.

    What we’ll be watching

    A few things to track in the coming weeks:

    • The actual building permit application. A pre-application meeting usually produces a building permit application within three to nine months. Whatever Brixton submits formally will tell us whether the storage-and-office concept holds or whether they pivot again.
    • Any official Topgolf statement. Leonard Green & Partners has been making public moves since taking control on January 1. A formal cancellation of Pacific Northwest expansion would clarify a lot.
    • Brixton’s leasing posture for the rest of The Hub. If self-storage and office are now in the program, the retail pitch to other tenants changes. Watch for tenant announcements that downshift from the original Hub vision.
    • City of Everett response. The original Hub deal involved zoning and permitting cooperation from the city. A meaningful program change at the site may trigger new city review — especially if the storage building requires the subdivision Brixton is also proposing.

    Frequently Asked Questions

    Is Topgolf coming to Everett Mall?

    As of May 2026, no construction has started, no Topgolf representative has confirmed the Everett location publicly, and Brixton Capital — the mall owner — has filed a pre-application with the City of Everett showing a 60,000-square-foot office building in the exact footprint Topgolf was going to occupy. The official permits from January 2025 are still on the books, but the new site plan does not assume Topgolf is happening.

    Who owns Everett Mall?

    Brixton Capital, a San Diego-based real estate firm, owns Everett Mall. Brixton acquired the property and announced The Hub @ Everett redevelopment plan in 2024.

    What is the Hub @ Everett?

    The Hub @ Everett is the marketing name Brixton Capital and the City of Everett gave to the planned redevelopment of the existing enclosed Everett Mall into a more walkable, outdoor-oriented retail and entertainment destination. The original anchor was supposed to be a 68,000-square-foot Topgolf venue.

    When is the Brixton pre-application meeting?

    May 19, 2026, with the City of Everett’s planning staff. This is a pre-application discussion, not a public hearing — there is no public comment period and no vote.

    What did Brixton apply to build?

    According to the City of Everett’s permitting portal, the May 19 application covers the interior demolition of the existing enclosed mall, conversion of a portion of the building into a self-storage facility, and subdivision of the storage use onto its own legal parcel. The accompanying site plan shows a 60,000-square-foot proposed office building in the area where Topgolf was going to be built.

    Is the rest of The Hub redevelopment still happening?

    Yes — Ulta Beauty and At Home are still moving into the former Sears box, the relocated Mall Station opened in December 2025, and other tenant work continues. The pre-application change appears specific to the Topgolf footprint and the previously-planned parking lot area where the storage facility would now sit.

    When would construction actually start?

    A pre-application meeting is the first step. A formal building permit application typically follows three to nine months later, and construction starts after the permit is issued. So even if the storage-and-office concept holds, ground-breaking is at minimum late 2026 and more likely 2027.

    Deeper coverage in the Hub @ Everett Pivot Cluster:

  • GRESB vs CDP vs SB 253: Which ESG Framework Actually Governs Your Property Portfolio

    GRESB vs CDP vs SB 253: Which ESG Framework Actually Governs Your Property Portfolio

    Property owners and asset managers in institutional real estate operate in an increasingly layered ESG disclosure environment. GRESB drives investor-facing ESG scoring. CDP provides voluntary supply chain disclosure that is increasingly investor-requested. California SB 253 mandates Scope 3 disclosure for large entities. And the EU’s Corporate Sustainability Reporting Directive (CSRD) extends mandatory ESG reporting to European operations and, through supply chain due diligence requirements, reaches global real estate companies with EU exposure.

    For BOMA members — building owners, REITs, asset managers — understanding which framework governs which obligations, and where they overlap, is essential for building an ESG program that satisfies all of them without duplicating work. This article maps each framework against the specific Scope 3 obligations it creates for property owners, with particular focus on the contractor supply chain data gap that sits at the intersection of all three.

    GRESB: Investor-Driven, Asset-Level, Annual

    GRESB is the primary ESG accountability mechanism for institutional real estate globally. It is not a regulation — it is an investor-driven benchmark that most institutional property owners participate in voluntarily because their capital partners require it. GRESB assessments are annual, asset-level, and scored on a 0–100 scale that investors use to compare portfolio ESG performance.

    For Scope 3, GRESB evaluates both governance (do you have a Scope 3 target and supply chain policy?) and performance (do you have actual Scope 3 data?). Contractor emissions — Scope 3 Category 1 — factor into both components. Property owners without contractor data collection programs score lower on supply chain governance and leave Category 1 data fields blank in the Performance section.

    GRESB is the most immediate Scope 3 pressure for most BOMA members because it directly affects your capital relationships. A poor GRESB score can affect asset valuations, borrowing costs, and investor mandates in ways that regulatory compliance does not.

    CDP: Voluntary, Supply Chain Driven, Escalating

    CDP’s supply chain program allows large corporations — including real estate companies’ major tenants and capital partners — to request Scope 3 supply chain data from their vendors. For property owners, CDP requests typically arrive from two directions: from institutional tenants whose corporate ESG programs require supply chain data from their landlords, and from institutional investors whose own CDP commitments require portfolio-level Scope 3 supply chain data.

    CDP participation is voluntary, but declining a CDP request from a major tenant or capital partner has commercial consequences. As CDP participation expands — the program now covers thousands of companies — the probability that a significant counterparty will request Scope 3 data from your organization continues to increase.

    California SB 253: Mandatory, Regulated, Enforced

    SB 253 is the only mandatory framework in this set, at least for US-domiciled organizations. It applies to entities doing business in California with revenues above the threshold, requires Scope 1 and 2 disclosure starting with fiscal year 2025 data, and adds Scope 3 starting with fiscal year 2026 data. CARB administers the program and has authority to assess penalties for non-compliance and material misstatement.

    For real estate entities with California assets, SB 253 transforms the Scope 3 contractor data question from an investor relations consideration into a legal compliance obligation. The same contractor emissions data that improves your GRESB score and satisfies CDP supply chain requests now also needs to be accurate enough to withstand CARB review.

    Where Restoration Contractor Data Fits in Each Framework

    The Restoration Carbon Protocol addresses the same data gap across all three frameworks. An RCP-compliant restoration contractor provides project-level emissions data in a format aligned with GHG Protocol Category 1. That data feeds directly into your GRESB Performance section, satisfies CDP supply chain data requests for Category 1, and provides the documented, methodology-backed Scope 3 Category 1 data that SB 253 requires.

    The strategic efficiency argument for RCP adoption by property owners is that solving the restoration contractor data problem once solves it for all three frameworks simultaneously. You do not need different data for GRESB, CDP, and SB 253 — you need GHG Protocol Category 1 data, and RCP produces it in that format.

    Building a Unified Response

    For BOMA members navigating GRESB, CDP, and SB 253 simultaneously, the most efficient path is a unified Scope 3 data program rather than three separate compliance efforts. The foundation is a GHG Protocol-aligned inventory methodology that covers all fifteen Scope 3 categories. Contractor data — collected through RCP-compliant vendor agreements and green lease extensions — feeds into that inventory once and satisfies all three frameworks.

    The timeline pressure is real: SB 253 Scope 3 data collection for fiscal year 2026 should already be underway, GRESB 2026 assessments will open in the first quarter, and CDP supply chain requests arrive year-round. The property owners who have built the contractor data infrastructure now — preferred vendor panels with RCP adoption, ESG clauses in service agreements, documented methodology — will be the ones with defensible Scope 3 inventories when all three frameworks converge on the same data set in 2027.

    Frequently Asked Questions

    Does GRESB require the same data as SB 253?

    Both require Scope 3 GHG data aligned with the GHG Protocol Corporate Standard. GRESB collects it through an annual assessment submitted to the benchmark platform. SB 253 requires public disclosure filed with CARB. The underlying data set is the same — a GHG Protocol-compliant Scope 3 inventory by category — which is why building one unified inventory program satisfies both frameworks efficiently.

    How does CSRD affect US-based property owners?

    The EU’s Corporate Sustainability Reporting Directive (CSRD) applies directly to large EU-domiciled companies and EU subsidiaries of non-EU companies above defined thresholds. For US-based real estate companies with EU operations or EU-listed capital partners, CSRD may apply directly. Even for those it does not reach directly, CSRD’s supply chain due diligence requirements mean EU-based capital partners and tenants will increasingly request Scope 3 supply chain data from their US counterparties as part of their own CSRD compliance.

    What is the Restoration Carbon Protocol and why do BOMA members need it?

    The Restoration Carbon Protocol (RCP) is an industry self-standard that gives restoration contractors a structured GHG accounting methodology for project-level emissions reporting. For BOMA members, RCP-compliant contractors provide the Scope 3 Category 1 data needed for GRESB performance scores, CDP supply chain responses, and SB 253 mandatory disclosure — in a format directly compatible with GHG Protocol reporting requirements.

  • Green Lease 2.0: How Property Owners Can Use Lease Language to Drive Scope 3 Contractor Compliance

    Green Lease 2.0: How Property Owners Can Use Lease Language to Drive Scope 3 Contractor Compliance

    Green leases have been a standard tool in the institutional real estate ESG toolkit for over a decade. Originally designed to align landlord and tenant incentives around energy efficiency, green lease clauses have evolved to cover data sharing, sustainability reporting, and — in more sophisticated agreements — explicit GHG emissions obligations.

    The same contractual logic that makes green leases effective for tenant emissions management can be applied to the contractor supply chain. Property owners who have invested in green lease programs for tenant Scope 3 (Category 13) data now have a parallel opportunity: using vendor agreement language to systematically collect Scope 3 Category 1 data from the contractors who perform work on their assets.

    What Green Lease Language Has Achieved — and Where It Stops

    Modern green lease frameworks — developed by BOMA, the Institute for Market Transformation, the Urban Land Institute, and others — have established standard clauses for energy data sharing, sub-metering requirements, sustainable operations standards, and ENERGY STAR reporting. These clauses give property owners a contractual mechanism to collect the tenant data needed for GRESB Category 13 reporting and corporate GHG inventories.

    Green leases stop at the tenant boundary. They do not govern the contractors the property owner engages for capital projects, maintenance, and emergency response. Those contractor relationships are covered by master service agreements, purchase orders, and emergency vendor panel arrangements — none of which have traditionally included GHG data reporting requirements.

    Extending the Logic: Contractor ESG Clauses

    The Green Lease 2.0 framework extends the proven lease-language approach to contractor agreements. The principle is identical: establish a contractual data delivery obligation, specify the format and methodology, and make compliance a condition of the vendor relationship.

    For restoration contractors specifically, the relevant clause structure covers three elements. A methodology requirement — specifying that the contractor must use a recognized GHG accounting methodology (such as the Restoration Carbon Protocol) for calculating project emissions. A data delivery requirement — specifying that a project emissions report in a format compatible with GHG Protocol Category 1 reporting must be delivered within 30 days of project completion. And a pre-qualification requirement — specifying that participation in the property owner’s preferred restoration vendor panel requires demonstrated GHG reporting capability prior to emergency deployment.

    Why the Pre-Qualification Step Matters

    The most important element of the contractor ESG clause framework is pre-qualification — establishing GHG reporting capability before the loss event occurs. Property owners cannot negotiate data requirements at 2 AM when a pipe bursts. The contractual infrastructure needs to exist before the emergency.

    Pre-qualification creates a preferred vendor panel of restoration contractors who have adopted RCP or an equivalent methodology and are contractually committed to delivering project emissions data. When a loss event occurs, the property manager calls from that panel — and GHG data collection is already built into the engagement.

    What This Looks Like for GRESB and SB 253

    For GRESB participants, a documented contractor ESG clause program with demonstrated adoption across your preferred vendor panel satisfies the supply chain governance requirements in the Management component of the GRESB assessment. It shows that your organization has policies in place, that those policies have contractual teeth, and that you are actively collecting contractor emissions data — not estimating it.

    For SB 253, the contractor ESG clause approach provides the documented data collection methodology that CARB’s guidance suggests as the evidentiary standard for Scope 3 Category 1 reporting. Organizations that can demonstrate a systematic contractor data collection program — rather than spend-based estimation — are better positioned for both initial compliance and the audit scrutiny that mandatory disclosure programs inevitably generate over time.

    Green Lease 2.0 is not a dramatic reinvention. It is the application of a framework that already works — for tenants — to the contractor relationships where property owners have an equivalent data obligation and an equivalent contractual lever to close it.

  • The Restoration Carbon Protocol: A Property Owner’s Guide to Contractor Scope 3 Data

    The Restoration Carbon Protocol: A Property Owner’s Guide to Contractor Scope 3 Data

    Property owners managing large commercial real estate portfolios have made significant progress on Scope 1 and Scope 2 emissions. Energy management systems, green building certifications, and utility procurement strategies have given asset managers real tools for reducing and reporting direct and indirect energy emissions. Scope 3 Category 1 — the contractor supply chain — has been the persistent blind spot.

    The Restoration Carbon Protocol (RCP) is designed to close the most acute piece of that gap: the emissions generated by restoration contractors during loss events and emergency response projects. This article explains what the RCP covers, how it generates the data property owners need, and how to integrate it into your ESG program and vendor management processes.

    Why Restoration Contractors Are a Unique Scope 3 Challenge

    Most contractor Scope 3 challenges can be addressed through procurement policy — adding ESG reporting requirements to RFPs, master service agreements, and annual vendor reviews. This works for planned, recurring vendor relationships where you control the selection process and the contract terms.

    Restoration contractors operate differently. They are engaged reactively, after a loss event. The property manager calls whoever is on the emergency vendor panel. The contractor mobilizes immediately. There is no competitive procurement, no ESG pre-qualification review, and no time to negotiate reporting requirements before work begins. The emissions happen regardless of whether data is collected.

    This is why the RCP matters: it establishes the data collection methodology on the contractor’s side, before the loss event. A contractor who has adopted the RCP arrives at your property already equipped to generate the emissions data you need — no negotiation required at the time of loss.

    What the RCP Measures

    The Restoration Carbon Protocol covers four primary emissions categories for a typical restoration project. Equipment fuel consumption — diesel generators, drying equipment, dehumidifiers, extraction units, and vehicles — is measured against hours of operation and fuel consumption logs. Materials with embedded carbon — replacement drywall, flooring, insulation, and structural components — are estimated using industry-standard embodied carbon factors. Waste generation — demolition debris, contaminated materials, and packaging — is tracked by weight and disposal method. Transportation — contractor vehicle miles, equipment hauling, and materials delivery — is calculated using distance and load data.

    The RCP output is a project-level emissions report expressed in metric tons of CO2 equivalent, broken down by category. That format maps directly to GHG Protocol Scope 3 Category 1 reporting requirements — making it usable for GRESB data submissions, CDP supply chain responses, and SB 253 Scope 3 inventory filings.

    How to Ask Your Vendors About RCP

    For property owners building RCP adoption into their vendor management process, the conversation with restoration contractors has three components. First, ask whether the contractor has adopted the RCP or an equivalent GHG reporting methodology — this establishes whether data collection infrastructure exists. Second, ask what the output format looks like and whether it maps to GHG Protocol Category 1 — this determines whether the data is actually usable for your reporting obligations. Third, ask about the delivery timeline — GRESB, CDP, and SB 253 all require annual inventory data, and you need project-level data within the fiscal year it occurred.

    Contractors who have not adopted RCP but are aware of it may be willing to do so if a significant client requests it. The RCP is an industry self-standard, not a certification program with fees or audits — the barrier to adoption is methodology, not cost.

    Integrating RCP Data into Your ESG Program

    Once you have RCP-compliant contractors on your preferred vendor panel, the data integration is straightforward. Each completed project generates an emissions report. Those reports are aggregated annually by property and portfolio. The totals feed into your Scope 3 Category 1 inventory alongside data from other contractor categories. The result is a documented, methodology-backed contractor emissions number — not a spend-based estimate — that satisfies the evidentiary standard for GRESB, CDP, and SB 253 reporting.

    For BOMA members managing portfolios under institutional ESG frameworks, this is the difference between a defensible Scope 3 inventory and a gap that investors, auditors, and regulators will flag. The RCP does not solve the entire contractor Scope 3 problem — but it solves the most unpredictable piece of it, and it does so in a format property owners can actually use.

  • California SB 253 and Real Estate: What Property Owners Must Demand from Restoration Contractors

    California SB 253 and Real Estate: What Property Owners Must Demand from Restoration Contractors

    California’s Climate Corporate Data Accountability Act (SB 253) has been widely discussed in the context of large manufacturers and technology companies. Less discussed — but equally significant — is the exposure it creates for real estate entities. Property owners, REITs, and asset managers with California operations and revenues above the threshold face mandatory Scope 3 disclosure beginning with fiscal year 2026 data, due in 2027.

    For BOMA members managing California commercial real estate, SB 253 changes the contractor relationship in a material way. The restoration contractor who responds to a water loss event at your San Francisco office tower, your Los Angeles industrial park, or your San Diego mixed-use development is generating Scope 3 Category 1 emissions that will need to appear in a mandatory public disclosure. And that contractor almost certainly has no mechanism for providing you that data today.

    Who SB 253 Applies To

    SB 253 applies to entities doing business in California with total annual revenues exceeding $1 billion. The law is administered by the California Air Resources Board (CARB). For Scope 3, the first reporting year is fiscal year 2026 — meaning data collection for Scope 3 needs to begin now for organizations that have not already started.

    Many institutional real estate owners — national REITs, pension fund asset managers, sovereign wealth fund-backed property companies — clear the revenue threshold and have California assets. For these entities, SB 253 Scope 3 reporting is not a future consideration. It is an active compliance requirement with a defined first filing date.

    The Reactive Vendor Problem for Real Estate

    SB 253’s Scope 3 requirement covers all fifteen GHG Protocol categories. For property owners, Category 1 (Purchased Goods and Services) includes every contractor engaged during the reporting year — planned maintenance vendors, capital project contractors, and reactive emergency-response vendors like restoration companies.

    The planned vendor relationship is manageable. You can add ESG data reporting to your master service agreements with recurring maintenance contractors, HVAC firms, and janitorial services. You can build it into your RFP process and annual vendor reviews.

    Reactive vendors are the structural problem. You do not choose when a pipe bursts or when a fire damages a tenant floor. You do not run a competitive procurement when a Category 1 water loss event hits your building at 2 AM. The restoration contractor who shows up is whoever your property manager calls — and the emissions from their equipment, materials, and transportation are your Scope 3 Category 1 obligation regardless of whether they provide data or not.

    The Restoration Carbon Protocol as a Compliance Bridge

    The Restoration Carbon Protocol (RCP) was developed specifically to address the reactive vendor data gap. It provides restoration contractors with a standardized methodology for calculating project-level GHG emissions across equipment fuel consumption, materials, waste, and transportation — and for communicating that data to property owner clients in a format aligned with GHG Protocol Category 1 requirements.

    For SB 253 compliance purposes, an RCP report from your restoration contractor provides the documented, methodology-backed data needed to populate your Scope 3 Category 1 inventory for loss events. Without it, your organization faces the CARB-specified alternative: estimation using spend-based methods — which typically overstate emissions and provide no path to reduction.

    What to Put in Your Vendor Agreements Now

    For California property owners preparing for SB 253 Scope 3 compliance, three vendor agreement changes directly address the restoration contractor gap. Add a GHG data delivery requirement to your preferred restoration vendor agreements, specifying RCP-compliant project emissions reports as a deliverable within 30 days of project completion. Add an ESG pre-qualification question to your emergency vendor panel selection process, asking whether candidates have adopted RCP or an equivalent methodology. And brief your property managers on the new data requirement — so that when a loss event occurs, GHG data collection is part of the project closeout process, not an afterthought six months later during annual reporting.

    SB 253 enforcement has a ramp period, but the data collection requirement is retroactive to fiscal year 2026. The time to build the vendor data pipeline is now, before the loss events that will generate the data you need occur.

  • GRESB and Scope 3: What Property Owners Must Report and Where Contractors Fit

    GRESB and Scope 3: What Property Owners Must Report and Where Contractors Fit

    For property owners and asset managers in institutional real estate portfolios, the Global Real Estate Sustainability Benchmark (GRESB) is not optional — it is the standard by which your ESG performance is measured, scored, and reported to institutional investors. And as GRESB’s scoring methodology continues to align with TCFD, ISSB, and the GHG Protocol, Scope 3 supply chain data has moved from a nice-to-have to a measurable gap in your assessment score.

    This article examines exactly where contractor Scope 3 data fits in the GRESB Real Estate Assessment, what the consequences of a data gap look like in practice, and how the Restoration Carbon Protocol (RCP) gives property owners a direct path to closing it.

    How GRESB Measures Scope 3

    The GRESB Real Estate Assessment is structured around two components: Management (governance, policy, targets, and reporting) and Performance (actual environmental and social data). Scope 3 emissions surface in both.

    In the Management component, GRESB evaluates whether your organization has a GHG emissions reduction target that includes Scope 3, and whether your supply chain policies address emissions reporting from contractors and vendors. Property owners without explicit contractor emissions standards in their procurement policies lose points here.

    In the Performance component, GRESB collects actual GHG data at the asset level — and Scope 3 Category 1 (Purchased Goods and Services, including contractors) is part of the expected data set for organizations reporting under GHG Protocol Corporate Standard.

    The Contractor Data Gap in Practice

    Most property owners managing large portfolios have reasonable visibility into Scope 1 (direct combustion at owned assets) and Scope 2 (purchased electricity). The contractor supply chain is where the inventory breaks down.

    Restoration contractors are among the highest-emission vendor categories in a property owner’s supply chain — yet they are engaged reactively, after loss events, and almost universally lack any mechanism for providing GHG data to their clients. A commercial building fire or flood event that triggers a six-figure restoration project will generate significant Scope 3 Category 1 emissions. Those emissions belong in your GRESB data. In most cases, they are simply missing.

    What RCP-Compliant Contractors Provide

    The Restoration Carbon Protocol gives restoration contractors a standardized methodology for calculating and communicating project-level emissions data — covering equipment fuel consumption, materials with embedded carbon, waste generation, and transportation. RCP output maps directly to GHG Protocol Category 1 reporting requirements.

    For GRESB participants, this means an RCP-compliant restoration contractor can provide the data needed to populate your Scope 3 Category 1 inventory for loss events — closing a gap that most property owner GHG inventories currently leave blank. That data supports your GRESB Performance score and demonstrates supply chain governance maturity in the Management component.

    Tenant Emissions: The Category 13 Problem

    While contractor data is the most actionable gap for most BOMA members, tenant emissions represent the largest Scope 3 exposure in most property portfolios. GRESB specifically evaluates whether property owners collect tenant energy and emissions data — and whether green lease clauses are in place to facilitate that collection.

    The contractor and tenant problems are structurally similar: both involve third parties operating within your assets whose emissions appear in your Scope 3 inventory, but whose data collection you do not directly control. Green leases address the tenant side. Contractor ESG requirements in your procurement standards — and RCP adoption by your preferred vendor panel — address the contractor side.

    Practical Steps for GRESB Participants

    For property owners currently completing or preparing for GRESB assessments, three actions directly improve your Scope 3 contractor data position. First, add an ESG data reporting requirement to your preferred vendor agreements — specifying that contractors must provide project-level GHG data in a format compatible with GHG Protocol Category 1 reporting. Second, ask your preferred restoration contractors whether they have adopted the Restoration Carbon Protocol or a comparable methodology. Third, build contractor emissions data into your post-loss project closeout process — making GHG reporting a deliverable alongside cost documentation and certificate of completion.

    These are not theoretical improvements. They are the specific steps that convert a data gap in your GRESB Performance section into a documented, improving metric — the kind institutional investors recognize as evidence of genuine ESG program maturity rather than checkbox compliance.