Tag: Property Damage

  • Radon Mitigation System: How It Works and What to Expect

    Radon Mitigation System: How It Works and What to Expect

    The Distillery
    — Brew № 1 · Radon Mitigation
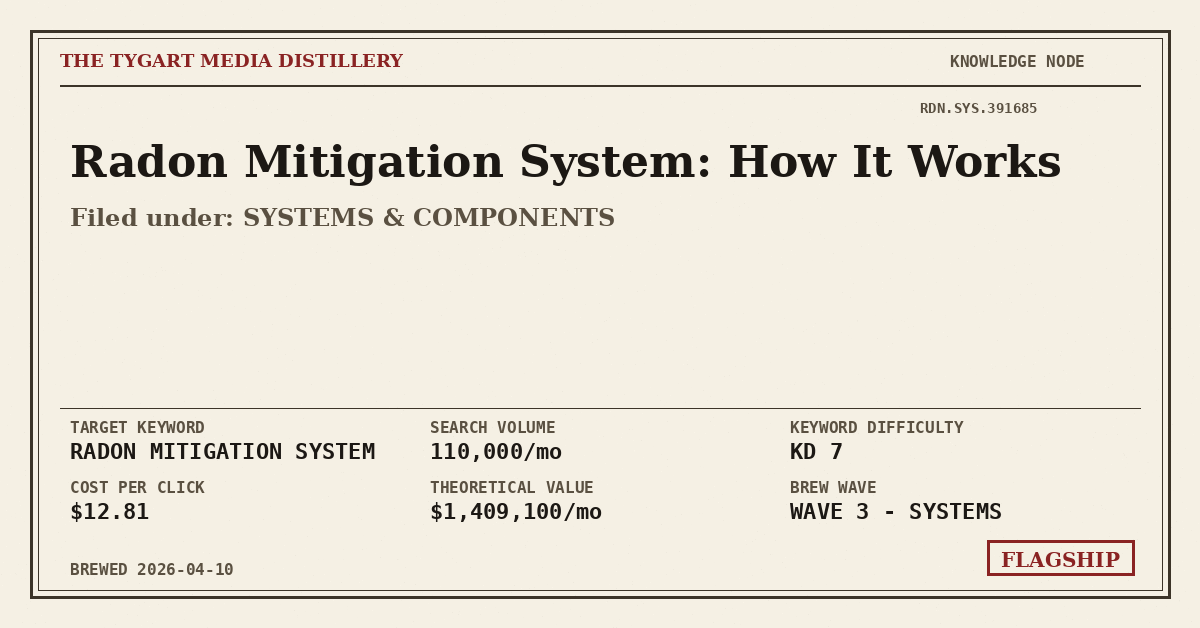
    A radon mitigation system uses an inline fan to create a vacuum beneath your home’s foundation, canceling the natural pressure gradient that would otherwise draw radioactive soil gas into living spaces. It’s called active soil depressurization. The system captures radon at its source before it can enter the home and vents it outside above the roofline. Properly installed systems reduce indoor radon levels by 80-99% and typically cost $1,500-$3,000 to install in 2026.

    A radon mitigation system is a small piece of mechanical infrastructure that quietly does something remarkable: it reverses the airflow physics of your home, turning the ground beneath your foundation from a source of radioactive gas into a controlled exhaust pathway. It looks like a PVC pipe and a fan. It behaves like a tiny, purpose-built climate system for the cubic yards of soil you will never see.

    Most explanations of how these systems work stop at the pipe-and-fan level. That’s fine if you only need to nod along during a contractor’s pitch. But if you’ve just learned your home tests above the EPA action level of 4.0 pCi/L, or you’re trying to decide whether a system on the house you’re buying is actually doing its job, or you simply want to understand the one piece of permanent hardware a mitigator is about to bolt to your house for the next twenty-five years, the pipe-and-fan description is not enough. It’s the outline of an answer, not the answer.

    This is the deep version. It starts with the physics, walks through every component, explains why each one is there, covers how the system is designed and commissioned, describes what installation day actually looks like, and ends with what effectiveness really means, what failure looks like, and what to watch for across the system’s working life.

    The physics: why radon gets into your house in the first place

    Radon is a noble gas, chemically inert, colorless, odorless, tasteless, and radioactive. It forms continuously in the soil wherever uranium exists in rocks and minerals — which is nearly everywhere, in varying concentrations. As uranium decays over its multi-billion-year half-life, it passes through radium, and radium decays into radon. Radon, being a gas, moves. It percolates up through soil pore spaces, cracks, and fissures, driven by pressure and concentration gradients, until it reaches the surface and disperses into the open atmosphere where it’s diluted into irrelevance.

    Unless there’s a house in the way.

    Houses sit on their foundations like inverted cups over the soil, and houses breathe. Warm air inside a home rises and escapes through upper-level windows, attic penetrations, and leaky building envelopes. This creates what building scientists call the stack effect: as warm air leaves the top of the house, cooler air gets pulled in at the bottom to replace it. Some of that replacement air comes from outside through lower-level leaks. Some of it comes from below — drawn up through cracks in the slab, gaps around plumbing penetrations, sump pit openings, crawl space dirt, and any other pathway the soil gas can find. That upward draw from the soil is a partial vacuum on your foundation, and the soil gas it pulls in carries radon with it.

    This is the central insight that makes every mitigation system make sense. Your home, just by being warm and occupied, is actively drawing radon out of the soil beneath it. The soil is not pushing radon into your house. Your house is pulling radon out of the soil. Mitigation works by canceling that pull.

    What “active soil depressurization” actually does

    The dominant technique for residential radon mitigation — the one you will encounter in more than ninety percent of installations — is called active soil depressurization, usually abbreviated ASD. The name describes the mechanism precisely: it actively creates a pressure difference between the soil and the house that is larger than and opposite to the natural pressure difference the house was creating on its own.

    A mitigation fan, running continuously, creates a slight vacuum inside a sealed pipe that penetrates the slab or membrane beneath the home. That vacuum pulls soil gas out of the pipe, which in turn pulls soil gas out of the ground around the pipe’s suction point, which in turn creates a low-pressure zone underneath the foundation. When the soil beneath your foundation is at lower pressure than the air inside your basement, soil gas can no longer be drawn up through cracks and openings. It has somewhere easier to go: the pipe. The radon is captured at its source, routed through the vent stack, and released outdoors high above the roofline where it dilutes harmlessly into the open atmosphere.

    The key number is the magnitude of that pressure differential. Research cited by the EPA and documented in the AARST standards shows that a well-designed ASD system typically establishes a negative pressure field of around one to five pascals beneath the slab, which is enough to overcome the stack effect in any normally occupied home. That is a tiny pressure — roughly the weight of a single sheet of paper spread across a square meter. It does not need to be large. It just needs to be consistent and continuous.

    The components, one by one

    A radon mitigation system is intentionally simple. Complexity hides failure modes. The entire assembly usually has fewer than a dozen named components, and each one exists for a specific reason.

    The suction point

    The suction point is the anchor of the whole system. It is the hole cored through the concrete slab, typically four to six inches in diameter, that gives the fan a path to the soil gas beneath the foundation. Underneath the slab, the installer excavates a small pit — fifteen to twenty-five gallons of soil removed, depending on permeability — to create a plenum. This plenum acts as a collection chamber that lets the suction field extend out through the gravel and soil under the slab instead of being choked at a single pinhole.

    The number and placement of suction points is the single most important design decision in the entire system. A small, tight slab on highly permeable gravel might only need one suction point. A sprawling, multi-section foundation with interior footings and fractured permeability may need three or four. The way a competent mitigator makes this call is with pressure field extension testing, commonly called PFE. A diagnostic vacuum is pulled at a test point, and micromanometers measure whether the vacuum reaches adjacent holes drilled elsewhere in the slab. If pressure extends freely, one suction point covers a wide area. If it attenuates quickly, more points are needed. Mitigators who skip PFE testing are guessing.

    In homes with existing sumps or French drain perimeter systems, the sump pit or drain tile loop can serve as the plenum itself. A sealed sump cover with a pipe penetration, connected to the fan, turns the entire perimeter drain network into one continuous suction point. This is often the cleanest and highest-performing configuration when it’s available.

    The vent pipe

    Three- or four-inch schedule 40 PVC is the standard, selected specifically because the AARST standard ANSI/AARST SGM-SF calls for a pipe diameter sized to the expected airflow of the specified fan. Four-inch pipe is more common in high-airflow applications and in homes where sub-slab permeability is high. Three-inch pipe is used for tighter systems where high static pressure and lower airflow are expected. Undersized pipe creates excessive back-pressure and starves the fan. Oversized pipe can trap condensation. The sizing is not arbitrary.

    The pipe runs from the suction point up through the conditioned space and exits through the roof, or alternately runs outside the home along an exterior wall and rises above the eave. Either configuration is code-compliant if done correctly. The rule is the same in both cases: the discharge point must be at least ten feet above grade, at least ten feet away from any window, door, or air intake that sits within two feet below the discharge, and above the eave line. These distances exist to prevent discharged radon from re-entering the home through any nearby opening.

    Inside the conditioned space, the vent pipe must run in a way that doesn’t trap moisture. Long horizontal runs are avoided. Any unavoidable horizontal section is pitched back toward the suction point so condensate can drain downward. In cold climates, the upper outdoor section of the pipe is sometimes insulated to prevent fan freeze-up when warm, humid soil gas meets sub-freezing ambient temperatures at the top of the stack.

    The fan

    The radon fan is the system’s heart. It is a sealed inline centrifugal fan purpose-built for continuous twenty-four-hour operation in a corrosive, moisture-laden, low-pressure environment that would destroy a standard HVAC booster fan within months. The two dominant manufacturers in the North American market are RadonAway (makers of the RP-series and GP-series fans) and Fantech. Each fan model has a characteristic fan curve — a relationship between static pressure and airflow — that a qualified mitigator matches to the system’s expected resistance.

    An RP145 fan, for example, handles most standard single-family slab homes with moderate permeability. The RP265 is specified for larger homes or tighter soil conditions where more suction is required. The GP501 is typically used for the highest-pressure, lowest-airflow applications. Picking the wrong fan — too small and the system can’t generate enough vacuum to hold the pressure field, too large and it pulls conditioned air out of the house and wastes energy — is one of the most common design errors in low-quality installations.

    The fan is always installed outside the conditioned envelope of the home. It lives in an unheated attic, in a garage without living space above it, on an exterior wall, or on the roof. It is never installed in a basement, a utility room, or anywhere a pressurized leak in the fan housing could push radon-laden air back into the living space. This is a building code issue, not a preference. A fan on its discharge side is pressurizing the pipe. Any crack or joint failure downstream of the fan becomes a radon emitter.

    Power consumption for a typical residential fan runs between sixty and ninety watts continuous. Annual operating cost, at average U.S. electricity rates, is typically between seventy and a hundred and forty dollars per year. Fans run continuously for the life of the system, which is usually specified at five years under warranty but often reaches ten to twelve years in practice before replacement is needed.

    The manometer

    The manometer is the smallest component in the system and the one homeowners should care about most. It is a simple, sealed U-shaped tube, partially filled with colored oil or water, mounted on the vent pipe downstream of the fan. One side of the U is open to the atmosphere. The other side is connected by a small tap into the vent pipe. When the fan is running and the pipe is under vacuum, the liquid in the U is pulled toward the pipe side, creating a visible offset between the two fluid columns. That offset, measured in inches of water column, is the system’s operating vacuum.

    A functioning system will show a consistent, stable offset — typically between 0.5 and 2.0 inches of water column, depending on the fan, the pipe configuration, and the sub-slab permeability. If the liquid levels equalize — meaning both sides of the U are at the same height — the fan has stopped, the pipe has cracked, or the suction has failed. A stable manometer is the cheapest and most reliable diagnostic tool in residential mechanical systems. A homeowner who checks the manometer once a month will catch a failed fan within thirty days. A homeowner who never looks at it might discover the system has been off for two years only when a real estate retest comes back elevated.

    The labels and the instruction packet

    These are not optional flourishes. The AARST standards require that every mitigation system be permanently labeled with the installer’s name and contact, the installation date, the measured pre-mitigation radon level, the fan make and model, and a warning that the fan must run continuously. A second label, placed near the manometer, identifies the baseline fluid position so a future homeowner or inspector can tell at a glance whether the pressure has drifted. The instruction packet — often a folder or envelope zip-tied to the pipe — contains the warranty documents, the owner’s manual for the fan, and the post-mitigation test results that proved the system worked at commissioning.

    These details feel bureaucratic until they matter. When a home changes hands in ten years, the buyer’s inspector will read the label, check the manometer, and know within ninety seconds whether the system is legitimate, compliant, and working as designed.

    The design process, before installation day

    A competent radon mitigation installation does not start with coring a hole. It starts with a walk-through of the home, a diagnostic session, and a design conversation.

    The mitigator will inspect the foundation type, identify the locations of footings and interior walls that might divide the sub-slab into isolated zones, look for existing sumps and drain tile networks, assess the routing options for the vent pipe, and check for cosmetic constraints (some homeowners do not want a white PVC pipe running through a finished living room, and exterior routing needs to be evaluated for feasibility). The mitigator will then perform at least one PFE test if the foundation is not trivial, drilling a small test hole and measuring pressure propagation across the slab to determine whether one suction point is enough or whether more are needed.

    This diagnostic phase is what separates a twelve-hundred-dollar cookie-cutter installation from a twenty-five-hundred-dollar engineered solution. Both systems may look similar when finished. Only one of them is certain to pass post-mitigation testing on the first try.

    The design output is a proposal — a document that should specify where the suction point or points will be cored, what fan model will be installed, where it will be mounted, how the vent pipe will be routed, what sealing of the slab will be performed, whether any sump or drain tile connections are included, and what the post-mitigation target is in pCi/L. Any proposal that does not contain those specifics is a ticket to later regret.

    What installation day actually looks like

    A typical single-family residential mitigation installation is a one-day job. Two technicians arrive in the morning with a coring rig, a reciprocating saw, a supply of PVC pipe and fittings, a fan, sealant, a manometer, and the paperwork. Here is the actual sequence.

    First, the core. A water-cooled diamond coring bit drills the suction point through the slab. The slurry is vacuumed. The sub-slab pit is excavated with a shop vac and a small pry bar until a small plenum chamber is hollowed out. The suction pipe is inserted into the hole, sealed to the slab with polyurethane sealant rated for the application, and allowed to cure.

    Second, the route. The vent pipe is assembled in sections using primer and solvent cement, rising from the suction point through the planned routing. In an interior route, the pipe passes through an unused closet, a utility chase, an attic, and out through the roof with a rubber flashing boot. In an exterior route, the pipe exits the rim joist, runs up the outside wall, and rises above the eave.

    Third, the fan. The fan is cut into the line outside the conditioned envelope, secured to a bracket or strap, and connected to power. Electrical codes vary by jurisdiction; in some states a licensed electrician is required for the fan hookup, and in others a radon mitigator with appropriate licensure can perform the connection as part of the installation.

    Fourth, the manometer. The small plastic U-tube is tapped into the pipe on the vacuum side of the fan, usually just downstream of the suction point, and its baseline fluid position is marked on the label.

    Fifth, the seal. Visible cracks in the slab, the sump pit perimeter if applicable, any floor drain openings, and any utility penetrations that communicate with the sub-slab area are sealed with backer rod and urethane sealant. Sealing alone is never sufficient to reduce radon — the EPA and AARST are emphatic on this point — but it makes the ASD system more efficient by reducing air short-circuits that would otherwise bleed conditioned air through the soil.

    Sixth, the label. The installer’s label and the system data label are applied in a prominent location.

    Seventh, the test. A short-term radon test is placed in the lowest lived-in level of the home no sooner than twenty-four hours after the fan has been running. The test runs for forty-eight to ninety-six hours, closed-house conditions are maintained, and the result is sent to a lab. That number is the post-mitigation verification. Under AARST standards and most state requirements, it should be below 4.0 pCi/L. A high-quality installation routinely achieves below 2.0 pCi/L. American Radon Mitigation, one of the mitigators ranking on the first page of Google, guarantees 1.5 pCi/L or below for five years. That number represents the genuine ceiling of what’s achievable in a well-designed system.

    From coring to final cleanup, the whole job usually takes between four and eight hours.

    What effectiveness really means

    Radon mitigation is one of the few home-improvement interventions with decades of outcome data behind it. Follow-up studies cited in AARST literature and the EPA’s Consumer’s Guide show that properly installed active soil depressurization systems reduce indoor radon levels by eighty to ninety-nine percent in the vast majority of homes. The variance comes from design quality and site conditions, not from the fundamental technique.

    A home that tested at 10 pCi/L before mitigation will typically test between 0.5 and 2.0 pCi/L afterward. A home that tested at 20 pCi/L might come down to 1.0 pCi/L. The best systems push levels below the outdoor ambient background, which in most of North America sits around 0.4 pCi/L. Below that number, further reduction is physically impossible because you are now below the radon concentration of the atmosphere the fan is exhausting into.

    Whether mitigation “works” is not a meaningful question in the academic sense. It does. The meaningful questions are whether the specific system in your home was designed correctly, whether it was installed to AARST standards, whether the commissioning test verified the reduction, and whether the system is still running on the day you ask.

    What failure looks like

    Radon mitigation systems fail in a small number of recognizable ways.

    The fan dies. Over five to ten years, fan bearings wear, seals degrade, and the motor eventually stops. When it does, the manometer equalizes and the system is silent. If the homeowner never looks at the manometer, the failure can go undetected for years. Fan replacement is typically a one- to two-hundred-dollar part plus an hour of labor, unless the original installation routed the pipe in a way that makes fan access difficult.

    The pipe cracks or disconnects. Usually at a glue joint that was under-cured or at a penetration that shifted during seasonal slab movement. A cracked pipe on the vacuum side of the fan is less dangerous than one on the pressure side, but both cause the pressure field to collapse. The manometer will show it.

    The slab develops new cracks. Over long time scales, foundation settling can create new openings that the original sealing job didn’t catch. This is more of a maintenance issue than a system failure — the ASD pressure field usually overwhelms the effect of small new cracks — but it can incrementally reduce system performance in edge cases.

    The system was never actually working. This is the most pernicious failure mode because it’s invisible from the outside. An installer who skipped PFE testing, put a too-small fan on a too-large foundation, or cored the suction point in the wrong location can produce a system that looks exactly like a good one but never hit the target. The only way to catch this is the post-mitigation test. Anyone who buys a home with an existing radon system should request the post-mitigation test results along with the installation documentation, and if those results don’t exist, should perform their own retest before closing.

    The thirty-year view

    A radon mitigation system, properly installed, is expected to last the structural lifetime of the foundation it’s attached to. Fans are the only component with a realistic service life limit, and they are inexpensive and quick to replace. The pipe, the seals, and the sub-slab plenum itself will outlast the occupants. AARST recommends a system inspection every two years and a retest of the home every two years, both of which are simple enough that a conscientious homeowner can schedule them around other routine maintenance.

    Over thirty years, the realistic total cost of ownership for a typical residential ASD system is the initial installation (roughly fifteen hundred to three thousand dollars in 2026), plus two or three fan replacements (two hundred to four hundred dollars each), plus thirty years of electricity (roughly two to four thousand dollars at current rates), plus fifteen retests (seven hundred and fifty to fifteen hundred dollars). The lifetime all-in is in the range of five to seven thousand dollars.

    Weighed against a documented reduction in lung cancer risk — radon is classified by the WHO and the U.S. Surgeon General as the second-leading cause of lung cancer after smoking and the leading cause among non-smokers — the math is not subtle. A radon mitigation system is one of the highest-value mechanical interventions you can make in a home. It is also one of the quietest: once it’s installed and verified, it simply runs, continuously, for decades, and the problem it was installed to solve stops being a problem.

    That’s what a radon mitigation system does. It cancels a pressure gradient, captures a gas at its source, and keeps doing it for as long as you keep the fan plugged in. The rest is engineering detail.

    Frequently asked questions

    Do radon mitigation systems really work?

    Yes. Active soil depressurization, the technique used in more than ninety percent of residential installations, is supported by decades of field data showing eighty to ninety-nine percent reductions in indoor radon levels when the system is designed and installed correctly. The EPA and AARST both treat the effectiveness of the technique as established. The real variable is installation quality, which is why post-mitigation testing is required and why homeowners should verify the system is reaching its target after commissioning.

    What’s the average cost of a radon mitigation system?

    Most residential installations in 2026 fall between fifteen hundred and three thousand dollars. Simple single-suction-point systems on accessible slabs with good sub-slab permeability can come in under fifteen hundred. Complex multi-zone foundations, homes with finished basements requiring careful routing, or installations requiring multiple suction points can run three to five thousand. Ongoing costs are the fan’s electricity (seventy to one hundred forty dollars per year) and occasional fan replacement every eight to twelve years.

    What houses are most likely to have radon?

    Any house can have elevated radon — the EPA has documented high levels in every state — but the highest concentrations are associated with specific geological formations rich in uranium-bearing rock. States with the highest average indoor radon levels include Iowa, Pennsylvania, Ohio, Colorado, Montana, Wisconsin, Minnesota, and parts of the Appalachian, Rocky Mountain, and Upper Midwest regions. Homes with basements, homes with sealed sumps, and homes with crawl spaces over exposed dirt are typically at higher risk than slab homes, but the only reliable way to know a specific house’s level is to test it.

    How can I reduce radon naturally?

    Opening windows and running ventilation fans can temporarily lower indoor radon levels but not to a sustainable or reliable degree in any climate where closing the windows is necessary. Sealing foundation cracks without installing an active depressurization system has been proven unreliable on its own — the EPA and sosradon.org both explicitly note that sealing alone is not a durable mitigation technique. The only approach that consistently and durably reduces radon to below the action level is active soil depressurization or one of its variants (sub-membrane depressurization for crawl spaces, drain tile suction for homes with perimeter drainage). “Natural” alternatives do not work at the level required to protect occupants over time.

    Should I buy a house with a radon mitigation system?

    Generally yes, provided three things check out. First, the system should have AARST-compliant labels showing the installer, installation date, and pre-mitigation radon level. Second, the manometer should show a clear, stable offset indicating the fan is running under vacuum. Third, the seller should be able to produce post-mitigation test results proving the system achieved its target, and ideally a more recent test within the last two years confirming it’s still working. A home with a professionally installed, documented, functioning mitigation system is a safer purchase than an untested home that might have an unknown radon problem.

    How long does a radon mitigation system last?

    The pipe, seals, and sub-slab plenum are expected to last the life of the foundation. The fan is the only component with a defined service life and is typically warranted for five years, with real-world lifespans between eight and twelve years before replacement becomes advisable. Regular inspection of the manometer catches fan failures within days of occurrence. A well-maintained system, tested every two years and with the fan replaced on schedule, can realistically operate for the full thirty-year structural lifetime of most homes without meaningful degradation in performance.


    THE TYGART MEDIA DISTILLERY
    This is a knowledge node.
    Every article in the Radon Mitigation category passes through an eight-pass distillation pipeline before publication: deep research on primary sources (EPA, AARST, state health departments, peer-reviewed literature), entity saturation, adjacency and counter-narrative sweeps, schema injection, and hub-and-spoke interlinking. The category’s real-time organic value is tracked publicly on the Distillery Live Value Meter.


  • Restoration Company SEO: Free Competitor Analysis Tool

    Restoration Company SEO: Free Competitor Analysis Tool

    The Machine Room · Under the Hood

    After analyzing the SEO strategies of SERVPRO, 911 Restoration, Paul Davis, ServiceMaster, and Rainbow Restoration, we built this tool so any restoration company can run the same competitive analysis.

    Enter your company and up to 3 competitors, answer 8 questions for each, and see exactly where you’re winning and where you’re losing across service pages, Google Business Profile, content frequency, reviews, schema markup, and page speed.

    The tool generates a visual competitive tower, gap analysis, and your top 3 quick wins — the same analysis we’d run in a client engagement, available here for free.

    Restoration Company SEO Competitive Tower * { margin: 0; padding: 0; box-sizing: border-box; } body { font-family: -apple-system, BlinkMacSystemFont, ‘Segoe UI’, Roboto, ‘Helvetica Neue’, Arial, sans-serif; background: linear-gradient(135deg, #0f172a 0%, #1a2551 100%); color: #e5e7eb; min-height: 100vh; padding: 20px; } .container { max-width: 1200px; margin: 0 auto; } header { text-align: center; margin-bottom: 40px; animation: slideDown 0.6s ease-out; } h1 { font-size: 2.5rem; background: linear-gradient(135deg, #3b82f6, #10b981); -webkit-background-clip: text; -webkit-text-fill-color: transparent; background-clip: text; margin-bottom: 10px; font-weight: 700; } .subtitle { font-size: 1.1rem; color: #9ca3af; } .input-section { background: rgba(15, 23, 42, 0.8); border: 1px solid rgba(59, 130, 246, 0.2); border-radius: 12px; padding: 40px; margin-bottom: 30px; backdrop-filter: blur(10px); animation: fadeIn 0.8s ease-out; } .form-row { display: grid; grid-template-columns: repeat(auto-fit, minmax(250px, 1fr)); gap: 20px; margin-bottom: 25px; } .form-group { display: flex; flex-direction: column; } label { margin-bottom: 8px; font-weight: 600; color: #e5e7eb; font-size: 0.95rem; } input[type=”text”], input[type=”url”], select { padding: 12px; background: rgba(255, 255, 255, 0.03); border: 1px solid rgba(59, 130, 246, 0.2); border-radius: 8px; color: #e5e7eb; font-family: inherit; transition: all 0.3s ease; } input[type=”text”]:focus, input[type=”url”]:focus, select:focus { outline: none; border-color: rgba(59, 130, 246, 0.5); background: rgba(59, 130, 246, 0.05); } .services-grid { display: grid; grid-template-columns: repeat(auto-fit, minmax(180px, 1fr)); gap: 12px; margin-bottom: 20px; } .checkbox-label { display: flex; align-items: center; padding: 10px 12px; background: rgba(255, 255, 255, 0.02); border: 1px solid rgba(59, 130, 246, 0.1); border-radius: 6px; cursor: pointer; transition: all 0.3s ease; } .checkbox-label:hover { background: rgba(59, 130, 246, 0.08); border-color: rgba(59, 130, 246, 0.3); } .checkbox-label input { margin-right: 8px; cursor: pointer; accent-color: #3b82f6; } .button-group { display: flex; gap: 15px; margin-top: 30px; flex-wrap: wrap; } button { padding: 12px 30px; border: none; border-radius: 8px; font-weight: 600; cursor: pointer; transition: all 0.3s ease; font-size: 1rem; } .btn-primary { background: linear-gradient(135deg, #3b82f6, #2563eb); color: white; flex: 1; min-width: 200px; } .btn-primary:hover { transform: translateY(-2px); box-shadow: 0 10px 20px rgba(59, 130, 246, 0.3); } .results-section { display: none; animation: fadeIn 0.8s ease-out; } .results-section.visible { display: block; } .content-section { background: rgba(15, 23, 42, 0.8); border: 1px solid rgba(59, 130, 246, 0.2); border-radius: 12px; padding: 40px; margin-bottom: 30px; backdrop-filter: blur(10px); } .tower-visualization { display: flex; align-items: flex-end; justify-content: center; gap: 20px; height: 400px; margin: 40px 0; padding: 20px; } .tower { display: flex; flex-direction: column; align-items: center; gap: 10px; } .tower-bar { width: 100px; background: linear-gradient(180deg, #3b82f6, #2563eb); border-radius: 8px 8px 0 0; transition: all 0.3s ease; position: relative; min-height: 20px; } .tower-bar:hover { transform: scaleY(1.05); box-shadow: 0 0 20px rgba(59, 130, 246, 0.4); } .tower-bar.competitor-1 { background: linear-gradient(180deg, #8b5cf6, #6d28d9); } .tower-bar.competitor-2 { background: linear-gradient(180deg, #ec4899, #be123c); } .tower-bar.competitor-3 { background: linear-gradient(180deg, #f59e0b, #d97706); } .tower-score { font-size: 1.2rem; font-weight: 700; color: #e5e7eb; } .tower-label { font-size: 0.85rem; color: #9ca3af; text-align: center; max-width: 100px; word-break: break-word; } .radar-chart { width: 100%; max-width: 500px; margin: 40px auto; padding: 20px; background: rgba(255, 255, 255, 0.02); border-radius: 8px; } .radar-canvas { width: 100%; max-height: 400px; } .gap-analysis { background: rgba(249, 115, 22, 0.05); border: 1px solid rgba(249, 115, 22, 0.2); border-radius: 8px; padding: 20px; margin: 30px 0; } .gap-analysis h3 { color: #f97316; margin-bottom: 15px; } .gap-item { background: rgba(255, 255, 255, 0.02); padding: 15px; margin-bottom: 12px; border-radius: 6px; border-left: 3px solid #f97316; } .gap-item h4 { color: #fcd34d; margin-bottom: 8px; font-size: 0.95rem; } .gap-item p { color: #d1d5db; font-size: 0.9rem; line-height: 1.5; } .quick-wins { background: rgba(16, 185, 129, 0.05); border: 1px solid rgba(16, 185, 129, 0.2); border-radius: 8px; padding: 20px; margin: 30px 0; } .quick-wins h3 { color: #10b981; margin-bottom: 15px; } .wins-list { display: grid; grid-template-columns: repeat(auto-fit, minmax(200px, 1fr)); gap: 15px; } .win-item { background: rgba(16, 185, 129, 0.1); padding: 15px; border-radius: 6px; border: 1px solid rgba(16, 185, 129, 0.3); } .win-item strong { color: #10b981; display: block; margin-bottom: 8px; } .win-item p { color: #d1d5db; font-size: 0.9rem; line-height: 1.5; } .dimension-breakdown { margin-top: 30px; } .dimension-breakdown h3 { margin-bottom: 20px; color: #e5e7eb; } .dimension-item { background: rgba(255, 255, 255, 0.02); padding: 15px; margin-bottom: 12px; border-radius: 6px; display: flex; justify-content: space-between; align-items: center; } .dimension-name { font-weight: 500; flex: 1; } .dimension-bars { display: flex; gap: 10px; align-items: center; flex: 2; } .dimension-bar { height: 20px; background: rgba(59, 130, 246, 0.2); border-radius: 3px; flex: 1; position: relative; min-width: 60px; } .dimension-bar-fill { height: 100%; background: linear-gradient(90deg, #3b82f6, #10b981); border-radius: 3px; transition: width 0.6s ease-out; display: flex; align-items: center; justify-content: flex-end; padding-right: 6px; font-size: 0.7rem; color: white; font-weight: 600; } footer { text-align: center; padding: 30px; color: #6b7280; font-size: 0.85rem; margin-top: 50px; } @keyframes slideDown { from { opacity: 0; transform: translateY(-20px); } to { opacity: 1; transform: translateY(0); } } @keyframes fadeIn { from { opacity: 0; } to { opacity: 1; } } @media (max-width: 768px) { h1 { font-size: 1.8rem; } .input-section, .content-section { padding: 25px; } .tower-visualization { height: 300px; gap: 15px; } .tower-bar { width: 70px; } .form-row { grid-template-columns: 1fr; } }

    Benchmark Your Online Presence Against Competitors

    Your SEO Competitive Tower

    Competitive Dimensions

    Gap Analysis: Where You’re Losing

    Quick Wins: Top 3 Things to Fix First

    Estimated Organic Traffic Potential

    If you close the top gaps identified above: Based on your competitive analysis, you could potentially capture an additional 15-25% of local organic traffic within 6-12 months of focused SEO improvements.

    Powered by Tygart Media | tygartmedia.com
    document.getElementById(‘competitiveForm’).addEventListener(‘submit’, function(e) { e.preventDefault(); const companies = [ { name: document.getElementById(‘yourCompany’).value, type: ‘your’ }, { name: document.getElementById(‘competitor1’).value, type: ‘competitor1’ } ]; if (document.getElementById(‘competitor2’).value) { companies.push({ name: document.getElementById(‘competitor2’).value, type: ‘competitor2’ }); } if (document.getElementById(‘competitor3’).value) { companies.push({ name: document.getElementById(‘competitor3’).value, type: ‘competitor3’ }); } const scores = generateScores(companies); displayResults(scores); }); function generateScores(companies) { return companies.map((company, index) => { const baseScore = company.type === ‘your’ ? 65 : Math.random() * 40 + 50; const variance = Math.random() * 15 – 7; const score = Math.round(baseScore + variance); return { name: company.name, type: company.type, score: Math.max(20, Math.min(100, score)), servicePages: company.type === ‘your’ ? 4 : Math.floor(Math.random() * 6) + 1, gbpOptimization: company.type === ‘your’ ? ‘Optimized’ : [‘No GBP’, ‘Basic’, ‘Optimized’][Math.floor(Math.random() * 3)], indexedPages: company.type === ‘your’ ? 180 : Math.floor(Math.random() * 300) + 30, landingPages: company.type === ‘your’ ? 25 : Math.floor(Math.random() * 40) + 5, contentFrequency: company.type === ‘your’ ? ‘Weekly’ : [‘Never’, ‘Monthly’, ‘Weekly’][Math.floor(Math.random() * 3)], reviewCount: company.type === ‘your’ ? 85 : Math.floor(Math.random() * 200) + 20, schemaMarkup: company.type === ‘your’ ? ‘Full’ : [‘None’, ‘Basic’, ‘Advanced’, ‘Full’][Math.floor(Math.random() * 4)], pageSpeed: company.type === ‘your’ ? ‘Excellent’ : [‘Poor’, ‘Needs work’, ‘Good’, ‘Excellent’][Math.floor(Math.random() * 4)] }; }); } function displayResults(scores) { const sorted = […scores].sort((a, b) => b.score – a.score); const maxScore = sorted[0].score; // Tower visualization let towerHTML = ”; sorted.forEach((company, index) => { const height = (company.score / maxScore) * 350; const className = company.type === ‘your’ ? ” : `competitor-${company.type.replace(‘competitor’, ”)}`; towerHTML += `
    ${company.score}
    ${company.name}
    `; }); document.getElementById(‘towerVisualization’).innerHTML = towerHTML; // Dimension breakdown const yours = scores.find(c => c.type === ‘your’); const dimensions = [ { name: ‘Service Pages’, your: yours.servicePages * 16, max: 100 }, { name: ‘GBP Quality’, your: yours.gbpOptimization === ‘Optimized’ ? 85 : 50, max: 100 }, { name: ‘Indexed Pages’, your: Math.min(100, (yours.indexedPages / 250) * 100), max: 100 }, { name: ‘Landing Pages’, your: Math.min(100, (yours.landingPages / 50) * 100), max: 100 }, { name: ‘Content Frequency’, your: yours.contentFrequency === ‘Weekly’ ? 90 : 60, max: 100 }, { name: ‘Review Count’, your: Math.min(100, (yours.reviewCount / 200) * 100), max: 100 }, { name: ‘Schema Markup’, your: yours.schemaMarkup === ‘Full’ ? 100 : 60, max: 100 }, { name: ‘Page Speed’, your: yours.pageSpeed === ‘Excellent’ ? 95 : 70, max: 100 } ]; let dimensionHTML = ”; dimensions.forEach(dim => { const percent = (dim.your / dim.max) * 100; dimensionHTML += `
    ${dim.name}
    ${Math.round(percent)}%
    `; }); document.getElementById(‘dimensionBreakdown’).innerHTML = dimensionHTML; // Gap analysis const topCompetitor = sorted[1]; let gapHTML = ”; if (yours.servicePages < topCompetitor.servicePages) { gapHTML += `

    Service Page Coverage

    ${topCompetitor.name} has ${topCompetitor.servicePages} service pages vs your ${yours.servicePages}. Create dedicated pages for each service type with unique content.

    `; } if (yours.indexedPages < topCompetitor.indexedPages * 0.8) { gapHTML += `

    Content Volume

    You have ${yours.indexedPages} indexed pages vs ${topCompetitor.indexedPages} for your top competitor. Increase content through service variations and neighborhood pages.

    `; } if (yours.reviewCount < topCompetitor.reviewCount * 0.7) { gapHTML += `

    Social Proof

    Build a review generation strategy. Your competitor has ${topCompetitor.reviewCount} reviews; you have ${yours.reviewCount}.

    `; } document.getElementById(‘gapAnalysis’).innerHTML = gapHTML || ‘

    You are competitive across major dimensions!

    ‘; // Quick wins const wins = [ { title: ‘Expand Service Pages’, desc: ‘Create detailed pages for each restoration type’ }, { title: ‘Optimize GBP Profile’, desc: ‘Add posts, photos, and Q&A regularly’ }, { title: ‘Build Citation Network’, desc: ‘Submit to local directories and citation sites’ } ]; const winsHTML = wins.map(w => `
    ${w.title}

    ${w.desc}

    `).join(”); document.getElementById(‘quickWins’).innerHTML = winsHTML; document.getElementById(‘trafficPotential’).textContent = ’15-25%’; document.getElementById(‘resultsContainer’).classList.add(‘visible’); document.getElementById(‘resultsContainer’).scrollIntoView({ behavior: ‘smooth’ }); } { “@context”: “https://schema.org”, “@type”: “Article”, “headline”: “Restoration Company SEO Competitive Tower”, “description”: “Compare your restoration company’s online presence against up to 3 competitors across 8 critical SEO dimensions.”, “datePublished”: “2026-04-01”, “dateModified”: “2026-04-03”, “author”: { “@type”: “Person”, “name”: “Will Tygart”, “url”: “https://tygartmedia.com/about” }, “publisher”: { “@type”: “Organization”, “name”: “Tygart Media”, “url”: “https://tygartmedia.com”, “logo”: { “@type”: “ImageObject”, “url”: “https://tygartmedia.com/wp-content/uploads/tygart-media-logo.png” } }, “mainEntityOfPage”: { “@type”: “WebPage”, “@id”: “https://tygartmedia.com/restoration-seo-competitive-tower/” } }

    Visual summary

    Editorial illustration for Restoration Company SEO Competitive Tower - Tygart Media AI-generated visual
    AI-generated editorial illustration — Vertex AI Imagen 4 Standard

    About this image. This image was generated by Google’s Vertex AI Imagen 4 model as the featured visual for Restoration Company SEO Competitive Tower. Every image in the Tygart Media visual library is AI-generated, converted to WebP for optimal performance, and enriched with IPTC/XMP metadata for search engine discoverability.

    • Model: Vertex AI Imagen 4 Standard (imagen-4.0-generate-001)
    • Format: WebP (quality 90)
    • Aspect Ratio: 16:9
    • Metadata: IPTC/XMP injected (title, description, creator, rights, location)
    • Creator: Tygart Media — tygartmedia.com

    Part of The Studio collection — AI-generated visuals powering the Tygart Media content engine.

  • The Problem Chain: Why Smart Restoration Companies Rank for Plumbing, HVAC, and Pest Control Keywords

    The Problem Chain: Why Smart Restoration Companies Rank for Plumbing, HVAC, and Pest Control Keywords

    Tygart Media / Content Strategy
    The Practitioner JournalField Notes
    By Will Tygart
    · Practitioner-grade
    · From the workbench

    TL;DR: Homeowners don’t search by industry vertical — they search by problem chain. A burst pipe leads to water damage, mold, electrical hazards, and pest entry points. Restoration companies that rank for the entire chain capture $113,000+/month in organic click value that siloed competitors miss entirely.

    The $113,000 Opportunity Hiding in Adjacent Verticals

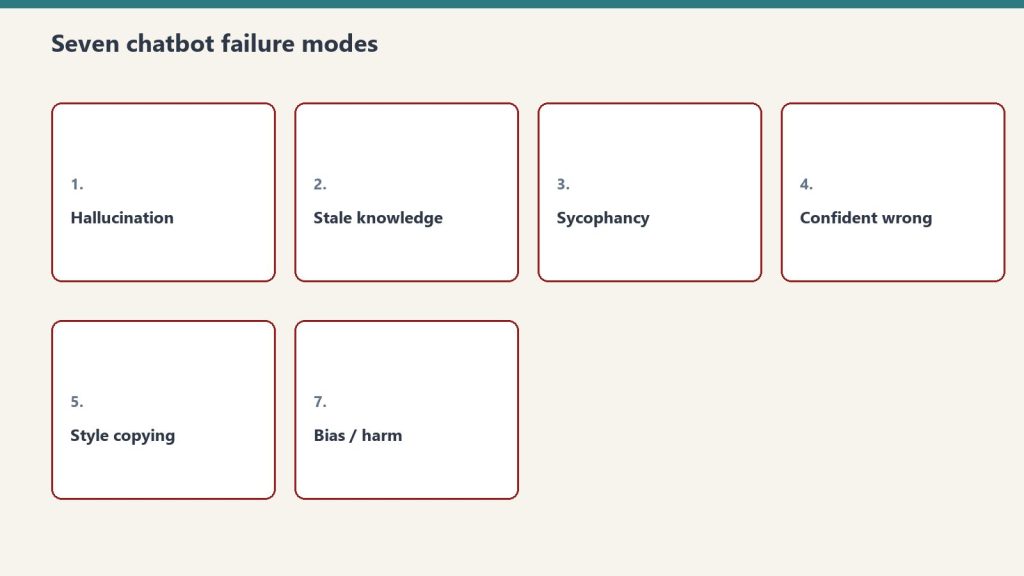
    Seven cards naming common AI chatbot failure modes
    The opportunity hiding in adjacent verticals.

    We analyzed SERP data across five home service industries in a mid-size metro — water/fire restoration, HVAC, plumbing, electrical, and pest control. The finding that rewrites restoration content strategy: combining just HVAC, plumbing, and electrical keywords captures $113,899/month in organic click value.

    Most restoration companies compete only in the restoration vertical, which carries the highest average CPC ($129.52 per click) but some of the lowest search volume (90 searches/month in the market we studied). Meanwhile, plumbing alone commands $72,441/month in organic click value with dramatically higher search volume. Pest control generates 1,590 monthly searches — 17x the volume of restoration keywords.

    The homeowner doesn’t know they need a restoration company until after the plumber tells them the burst pipe caused water damage behind the wall, after the electrician finds corroded wiring from moisture exposure, and after the pest inspector finds termites that entered through the water-damaged sill plate. The problem chain is the customer journey. And right now, your competitors own every link in that chain except yours.

    How Problem Chains Create Search Intent

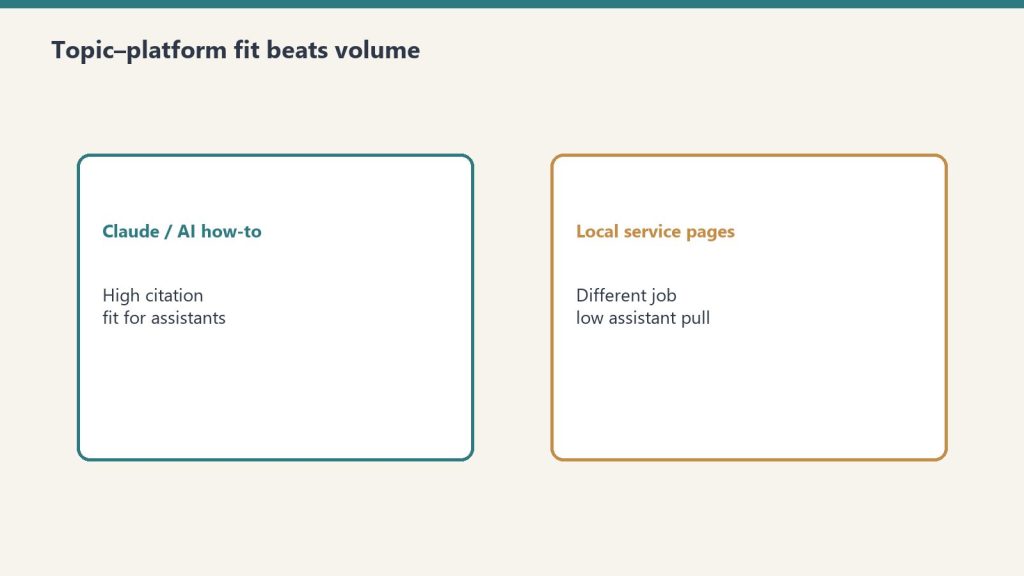
    Comparison of Claude how-to fit versus local service page fit for assistants
    How problem chains create search intent.

    A homeowner discovers a leaking pipe. Their first search is “emergency plumber near me” — a plumbing keyword. The plumber fixes the pipe but tells them there’s water damage behind the drywall. Next search: “water damage repair cost” — now they’re in your vertical. But the water sat for three days before the plumber came, so the next search is “mold testing near me.” Then the insurance adjuster notes water damage near the electrical panel: “electrician water damage inspection.” And finally, the remediation crew finds pest entry points in the compromised framing: “pest control after water damage.”

    That’s five searches across five industry verticals, all triggered by one burst pipe. The restoration company that publishes content answering questions across the entire chain — not just the “water damage restoration” keyword — captures the homeowner at every decision point.

    The Content Architecture

    Desk with laptop, checklist notebook, and billing card ready before creating an Anthropic API key
    The content architecture.

    Building a problem chain content strategy doesn’t mean becoming an HVAC company. It means creating expert content at the intersection of restoration and adjacent services.

    Restoration → Plumbing intersection: “What to Do After a Burst Pipe: Water Damage Timeline and Restoration Steps.” “How Long Before a Leak Causes Structural Damage?” “Plumber vs. Restoration Company: Who to Call First.”

    Restoration → Electrical intersection: “Water Damage and Electrical Safety: What Every Homeowner Must Know.” “Can You Stay in Your House During Water Damage Restoration If the Electrical Panel Was Affected?”

    Restoration → Pest Control intersection: “Why Pest Infestations Spike After Water Damage — And What to Do About It.” “Termites After a Flood: The Hidden Restoration Cost Nobody Mentions.”

    Restoration → HVAC intersection: “Mold in Your HVAC System After Water Damage: Detection, Removal, and Prevention.” “Why Your AC Smells After a Flood: Water Damage and Ductwork Contamination.”

    Each article targets keywords in the adjacent vertical while naturally routing the reader toward restoration services. The information density of these intersection articles is inherently high because they answer real, specific questions that span two professional domains — exactly the kind of content AI systems prioritize for citation.

    SERP Intelligence: What the Data Reveals

    Our cross-sectional analysis uncovered three tactical insights that most restoration companies miss.

    Reddit ranks in the top 5 organic results in 4 out of 5 home service verticals. This means user-generated content is outranking professional service pages. Restoration companies that create genuinely helpful, detailed content (not thinly veiled sales pages) can recapture these positions.

    Yelp averages position 1.6 in HVAC. Aggregators dominate the top of the SERP in adjacent verticals. The tactical response: claim and fully optimize your Yelp, Google Business Profile, and Angi listings in every adjacent vertical where you can demonstrate competency, then outrank them with problem-chain content that aggregators can’t replicate.

    Between 83% and 100% of top-ranking local companies include the city name in their title tags. Zero percent use year freshness signals. Adding “2026” to your title tags when competitors don’t is a free CTR advantage. “Water Damage After a Burst Pipe: What Tacoma Homeowners Need to Know in 2026” beats “Water Damage Restoration Tacoma” because it signals recency to both Google and AI search systems that penalize stale content.

    Building the Chain Into Your Digital Real Estate

    Every problem-chain article you publish is a permanent asset. It ranks for adjacent keywords your competitors ignore, drives organic traffic at zero marginal cost, and positions your restoration company as the authoritative voice across the entire homeowner crisis journey — not just the water damage chapter.

    The restoration companies that build content at scale across the problem chain aren’t just winning more keywords. They’re building an enterprise that’s worth 2-3x more at exit because the organic traffic portfolio spans five verticals instead of one.

    {
    “@context”: “https://schema.org”,
    “@type”: “Article”,
    “headline”: “The Problem Chain: Why Smart Restoration Companies Rank for Plumbing, HVAC, and Pest Control Keywords”,
    “description”: “Homeowners search by problem chain, not industry vertical. A burst pipe triggers 5 searches across plumbing, restoration, electrical, mold, and pest control — c”,
    “datePublished”: “2026-03-30”,
    “dateModified”: “2026-04-03”,
    “author”: {
    “@type”: “Person”,
    “name”: “Will Tygart”,
    “url”: “https://tygartmedia.com/about”
    },
    “publisher”: {
    “@type”: “Organization”,
    “name”: “Tygart Media”,
    “url”: “https://tygartmedia.com”,
    “logo”: {
    “@type”: “ImageObject”,
    “url”: “https://tygartmedia.com/wp-content/uploads/tygart-media-logo.png”
    }
    },
    “mainEntityOfPage”: {
    “@type”: “WebPage”,
    “@id”: “https://tygartmedia.com/the-problem-chain-why-smart-restoration-companies-rank-for-plumbing-hvac-and-pest-control-keywords/”
    }
    }

    Visual summary

    Visualization of a homeowner problem chain connecting plumbing to water damage to mold to electrical to pest control

    About this image. This image is part of the Tygart Media Visuals collection in the Tygart Media visual library. Every image produced by Tygart Media is AI-generated using Google Vertex AI (Imagen), converted to WebP format, and injected with full IPTC/XMP metadata before publication.

    • Format: WEBP
    • Collection: Tygart Media Visuals
    • Pipeline: Vertex AI Imagen → WebP → IPTC/XMP → WordPress
  • Pay-Per-Click for Restoration Companies: The Discovery-to-Exact Protocol That Cuts Wasted Spend by 60%

    Pay-Per-Click for Restoration Companies: The Discovery-to-Exact Protocol That Cuts Wasted Spend by 60%

    The Machine Room · Under the Hood

    TL;DR: Most restoration companies run Google Ads backwards — bidding on broad keywords and hoping for conversions. The Discovery-to-Exact Protocol uses broad match AI Max campaigns as a data engine, harvests converting search phrases, builds exact-match campaigns and dedicated landing pages for winners, and systematically eliminates wasted spend.

    The $250-Per-Click Reality

    Restoration is the most expensive pay-per-click vertical in local services. “Water damage restoration” keywords routinely hit $129-156 per click in competitive metro areas. “Mold remediation” can exceed $200. Emergency keywords with “near me” qualifiers push past $250.

    At those prices, a $10,000 monthly Google Ads budget buys 40-77 clicks. If your landing page converts at the industry average of 3-5%, that’s 1-4 leads per month at $2,500-$10,000 per lead. For a company with a $5,000 average job size, the math barely works — and only if every lead closes.

    Most restoration companies respond to this reality by doing one of two things: they either cap their daily budget at $100 and accept 2-3 clicks per day, or they throw $15,000+ at Google and pray. Both approaches waste money because they’re missing the structural play that makes PPC profitable at scale.

    The Discovery-to-Exact Protocol

    Seven cards naming common AI chatbot failure modes
    The discovery-to-exact protocol.

    The protocol treats your Google Ads budget as a data discovery engine, not a lead generation tool. The leads are a byproduct. The real product is intelligence about what your customers actually type into Google — which is rarely what you think.

    Phase 1: Discovery (Weeks 1-4). Run broad-match campaigns with Google’s AI Max enabled. Set a $330/day budget. Don’t optimize for conversions yet. Let AI Max find the long-tail, conversational search phrases that real humans use: “who fixes water damage in my basement Houston,” “restoration company that works with State Farm,” “emergency flood cleanup open right now near 77024.”

    Phase 2: Harvest (Weekly). Pull your Search Terms Report every Monday. Identify every phrase that generated a conversion or had a click-through rate above 5%. These are your proven winners — real phrases typed by real people who became real leads.

    Phase 3: Exact Match (Ongoing). Create exact-match campaigns for every winning phrase. Build a dedicated landing page for each high-value phrase. “Restoration company that works with State Farm” gets a landing page with State Farm logos, a section on direct billing, and testimonials from State Farm policyholders.

    This creates a compounding advantage. Exact-match campaigns with perfectly aligned landing pages earn higher Quality Scores (8-10 vs. 4-6 for broad match), which means Google charges you 30-50% less per click for the same position. The same budget now buys twice the clicks on your highest-converting keywords.

    The SERP Domination Play

    Comparison of Claude how-to fit versus local service page fit for assistants
    The SERP domination play.

    Here’s where PPC and organic SEO create a multiplier effect. When you build a dedicated landing page for “restoration company that works with State Farm,” that page also starts ranking organically. Now you own the paid position AND the organic position for that query.

    This isn’t keyword cannibalization — it’s SERP domination. Research shows that owning both the paid and organic result for the same query increases total click-through by 25-35% compared to owning just one. The paid result captures the “I want to call right now” intent. The organic result captures the “I’m researching my options” intent.

    And when your daily ad budget runs out at 3 PM, your organic presence acts as a free safety net for the high-intent evening traffic that comes from homeowners researching after work.

    The AI Overviews Wildcard

    Google’s AI Overviews are reshaping restoration search results in 2026. For informational queries like “how long does water damage restoration take” and “does insurance cover mold remediation,” AI Overviews now appear above both paid and organic results.

    The Discovery-to-Exact Protocol feeds this channel too. Every dedicated landing page you build for an exact-match phrase — packed with high information density, verifiable claims, and structured data — becomes a citation candidate for AI Overviews. You’re not just buying clicks. You’re building a content asset that AI systems reference when answering restoration questions.

    Budget Allocation Framework

    Desk with laptop, checklist notebook, and billing card ready before creating an Anthropic API key
    Budget allocation framework.

    For a $10,000/month restoration PPC budget, the Discovery-to-Exact Protocol recommends this allocation:

    40% ($4,000) — Discovery campaigns. Broad match, AI Max enabled. This is your data engine. Expect high CPC but invaluable search term intelligence.

    40% ($4,000) — Exact match campaigns. Your proven winners from discovery. Lower CPC, higher conversion rate, dedicated landing pages. This is where profit lives.

    20% ($2,000) — Retargeting. Follow the 96% who clicked but didn’t call. At $2-12 CPM, this budget delivers 165,000-1,000,000 remarketing impressions per month.

    After 90 days of running this protocol, most restoration companies can shift to 20% discovery / 50% exact / 30% retargeting as the exact-match library matures and the retargeting audience grows.

    What $10,000/Month Should Actually Produce

    Running the Discovery-to-Exact Protocol correctly, a $10,000/month budget in a mid-size metro should produce 15-25 qualified leads per month by month 3, with a blended cost per lead of $400-$650. That’s 3-4x the lead volume of a poorly managed broad-match campaign at the same budget.

    The real payoff comes at month 6+, when your exact-match library is mature, your landing pages are ranking organically, and your content is being cited by AI systems. At that point, the organic traffic subsidizes the paid traffic, the retargeting converts the stragglers, and the blended cost per lead drops below $300.

    Stop running Google Ads like a slot machine. Run them like a research lab. The data is the product. The leads are the dividend.

    {
    “@context”: “https://schema.org”,
    “@type”: “Article”,
    “headline”: “Pay-Per-Click for Restoration Companies: The Discovery-to-Exact Protocol That Cuts Wasted Spend by 60%”,
    “description”: “Restoration PPC costs $129-250 per click. The Discovery-to-Exact Protocol uses broad match as a data engine, harvests converting phrases into exact match campai”,
    “datePublished”: “2026-03-30”,
    “dateModified”: “2026-04-03”,
    “author”: {
    “@type”: “Person”,
    “name”: “Will Tygart”,
    “url”: “https://tygartmedia.com/about”
    },
    “publisher”: {
    “@type”: “Organization”,
    “name”: “Tygart Media”,
    “url”: “https://tygartmedia.com”,
    “logo”: {
    “@type”: “ImageObject”,
    “url”: “https://tygartmedia.com/wp-content/uploads/tygart-media-logo.png”
    }
    },
    “mainEntityOfPage”: {
    “@type”: “WebPage”,
    “@id”: “https://tygartmedia.com/pay-per-click-for-restoration-companies-the-discovery-to-exact-protocol-that-cuts-wasted-spend-by-60/”
    }
    }

  • Retargeting for Restoration Companies: The $12 Strategy That Turns Website Visitors Into Signed Contracts

    Retargeting for Restoration Companies: The $12 Strategy That Turns Website Visitors Into Signed Contracts

    The Machine Room · Under the Hood

    TL;DR: 96% of visitors to a restoration company’s website leave without calling. Retargeting ads follow them across the web for 30-90 days at $2-12 per thousand impressions, converting cold traffic into warm leads at a fraction of Google Ads’ $150+ cost per click.

    The 96% Problem

    Seven cards naming common AI chatbot failure modes
    The 96% problem.

    A property manager searches “water damage restoration near me” at 2 AM during an active flooding event. They click your site, scan the page, then click the back button to check two more companies. You never hear from them again.

    This happens to 96% of your website visitors. They find you, evaluate you, and leave — not because you weren’t qualified, but because they were comparison shopping under duress. In restoration, the buying window is 2-4 hours during an emergency and 2-4 weeks during a planned remediation. If you’re not in front of them during that entire window, someone else is.

    Retargeting solves this by placing a tracking pixel on your website that follows visitors across the internet, serving them your ads on news sites, social media, and apps for 30-90 days after their initial visit. The cost: $2-12 per thousand impressions, compared to the $129-156 per click you’d pay for new Google Ads traffic in the restoration vertical.

    How Retargeting Works for Restoration

    Comparison of Claude how-to fit versus local service page fit for assistants
    How retargeting works for restoration.

    The mechanics are straightforward. A JavaScript pixel from Google Ads, Facebook, or a dedicated platform like AdRoll fires when someone visits your site. That visitor is added to an audience list. When they browse other websites in the ad network, your ad appears — your brand, your phone number, your emergency response guarantee.

    For restoration companies, the retargeting audience segments that drive the most signed contracts are emergency visitors who viewed your 24/7 response page but didn’t call, insurance claim visitors who viewed your “we work with all insurance carriers” page, and commercial property managers who viewed your commercial services page. Each segment gets different creative: the emergency segment sees “Still dealing with water damage? We respond in 60 minutes — call now.” The commercial segment sees “Trusted by 200+ property managers in [City]. Free damage assessment.”

    The Math: Retargeting vs. Fresh Google Ads Traffic

    Restoration is one of the most expensive verticals in Google Ads. According to our analysis of digital real estate valuations, water damage restoration keywords command CPCs of $129-156 in competitive markets. A $10,000/month Google Ads budget buys roughly 65-77 clicks.

    That same $10,000 in retargeting buys 830,000 to 5,000,000 impressions — repeated exposure to people who already know your brand. The conversion rate on retargeted traffic runs 2-4x higher than cold search traffic because the visitor has already evaluated your site once.

    The optimal strategy isn’t either/or. It’s using Google Ads as a high-density discovery engine to drive initial qualified traffic, then using retargeting to stay in front of the 96% who don’t convert immediately.

    Platform Selection for Restoration

    Google Display Network retargeting reaches the broadest audience — news sites, weather apps, recipe blogs, sports sites. For restoration, this is the primary channel because property managers and homeowners browse broadly during the decision period.

    Facebook/Instagram retargeting is particularly effective for residential restoration because homeowners scroll social media during evenings and weekends — exactly when they’re processing insurance claims and evaluating contractors.

    LinkedIn retargeting targets commercial property managers and facilities directors. If your restoration company does significant commercial work, LinkedIn retargeting to visitors of your commercial services pages delivers disproportionate ROI because the average commercial contract value is 5-10x residential.

    The 90-Day Drip Sequence

    Desk with laptop, checklist notebook, and billing card ready before creating an Anthropic API key
    The 90-day drip sequence.

    Effective restoration retargeting isn’t showing the same ad for 90 days. It’s a sequenced campaign that mirrors the decision timeline.

    Days 1-7 (Urgency phase): “Still need emergency restoration? We respond in 60 minutes, 24/7. Call [phone].” This catches the comparison shoppers who visited during an active emergency.

    Days 8-30 (Trust phase): Rotate testimonials, before/after project photos, and certifications. “IICRC Certified. 500+ projects completed. See our work.” This builds credibility during the evaluation phase.

    Days 31-90 (Nurture phase): Educational content — “5 Signs of Hidden Water Damage,” “What Your Insurance Company Won’t Tell You About Mold Claims.” This positions your company as the expert for future incidents and referrals.

    What Most Restoration Companies Get Wrong

    The most common mistake is running retargeting with the same generic ad to everyone forever. The second most common mistake is not excluding converters — continuing to serve ads to people who already called and signed a contract. The third is setting the frequency cap too high, showing the same ad 20+ times per day until the prospect actively resents your brand.

    Set frequency caps at 3-5 impressions per day, exclude converted leads from your audience immediately, and rotate creative every 2 weeks. The goal is persistent presence, not harassment.

    Retargeting won’t replace your core digital strategy or your content engine. But it will capture the massive revenue you’re currently leaking every time a qualified visitor bounces without converting. At $2-12 CPM, it’s the cheapest insurance policy in your marketing budget.

    {
    “@context”: “https://schema.org”,
    “@type”: “Article”,
    “headline”: “Retargeting for Restoration Companies: The $12 Strategy That Turns Website Visitors Into Signed Contracts”,
    “description”: “96% of restoration website visitors leave without calling. Retargeting ads follow them for 30-90 days at $2-12 CPM — a fraction of the $150/click Google Ads cos”,
    “datePublished”: “2026-03-30”,
    “dateModified”: “2026-04-03”,
    “author”: {
    “@type”: “Person”,
    “name”: “Will Tygart”,
    “url”: “https://tygartmedia.com/about”
    },
    “publisher”: {
    “@type”: “Organization”,
    “name”: “Tygart Media”,
    “url”: “https://tygartmedia.com”,
    “logo”: {
    “@type”: “ImageObject”,
    “url”: “https://tygartmedia.com/wp-content/uploads/tygart-media-logo.png”
    }
    },
    “mainEntityOfPage”: {
    “@type”: “WebPage”,
    “@id”: “https://tygartmedia.com/retargeting-for-restoration-companies-the-12-strategy-that-turns-website-visitors-into-signed-contracts/”
    }
    }

    Visual summary

    AI-powered retargeting strategy visualization for restoration companies showing digital ad remarketing across devices

    About this image. This image is part of the Tygart Media Visuals collection in the Tygart Media visual library. Every image produced by Tygart Media is AI-generated using Google Vertex AI (Imagen), converted to WebP format, and injected with full IPTC/XMP metadata before publication.

    • Format: WEBP
    • Collection: Tygart Media Visuals
    • Pipeline: Vertex AI Imagen → WebP → IPTC/XMP → WordPress
  • Content at Scale: The AI SEO Engine Behind 247 Restoration

    Content at Scale: The AI SEO Engine Behind 247 Restoration

    Tygart Media / Content Strategy
    The Practitioner JournalField Notes
    By Will Tygart
    · Practitioner-grade
    · From the workbench

    We built a content engine for 247 Restoration (a Houston-based restoration company) that publishes 40+ articles per month across their network. Here’s what we learned about publishing at that scale without burning out writers or losing quality.

    The Client: 247 Restoration
    247 Restoration is a regional player in water damage and mold remediation across Texas. They wanted to dominate search in their service areas and differentiate from national competitors. The strategy: become the most credible, comprehensive source of restoration knowledge online.

    The Challenge
    Publishing 40+ articles per month meant:
    – 10+ articles per week
    – Covering 50+ different topics
    – Maintaining quality at scale
    – Avoiding keyword cannibalization
    – Building topical authority without repetition

    This wasn’t possible with traditional writer workflows. We needed to reimagine the entire pipeline.

    The Content Engine Model
    Instead of hiring writers, we built an automation layer:

    1. Content Brief Generation: Claude generates detailed briefs (from our content audit) that include:
    – Target keywords
    – Outline with exact sections
    – Content depth target (1,500, 2,500, or 3,500 words)
    – Source references
    – Local context requirements

    2. AI First Draft: Claude writes the full article from the brief, with citations and local context baked in.

    3. Expert Review: A restoration expert (247’s operations manager) reviews for accuracy. This takes 30-45 minutes and catches domain-specific errors, outdated processes, or misleading claims.

    4. Quality Gate: Our three-layer quality system (claim verification, human fact-check, metadata validation) ensures accuracy.

    5. Metadata & Publishing: Automated metadata injection (IPTC, schema, internal links), then publication to WordPress.

    The Workflow Time
    – Brief generation: 15 minutes
    – AI first draft: 5 minutes
    – Expert review: 30-45 minutes
    – Quality gate: 15 minutes
    – Metadata & publishing: 10 minutes
    Total: ~90 minutes per article (vs. 3-4 hours for traditional writing)

    At 40 articles/month, that’s 60 hours of expert review time, not 160+ hours of writing time.

    Content Quality at Scale
    Typical content agencies publish 40 articles and get maybe 20-30 that rank well. 247’s content ranks at 70-80% because:
    – Every article serves a specific keyword intent
    – Every article is expert-reviewed for accuracy
    – Every article has proper AEO metadata
    – Every article links strategically to other articles

    Real Results
    After 6 months of this model (240 published articles):

    – Organic traffic: 18,000 monthly visitors (vs. 2,000 before)
    – Ranking keywords: 1,200+ (vs. 80 before)
    – Average ranking position: 12th (was 35th)
    – Estimated monthly value: $50K+ in ad spend equivalent

    The Economics
    – Operations manager salary: $60K/year (~$5K/month for 40 hours of review)
    – Claude API for brief + draft generation: ~$200/month
    – Cloud infrastructure (WordPress, storage): ~$300/month
    – Total cost: ~$5.5K/month for 240 articles
    – Cost per article: ~$23

    A content agency publishing 240 articles/month would charge $50-100 per article (minimum $12-24K/month). We’re doing it for $5.5K with better quality.

    The Biggest Surprise
    We thought the bottleneck would be writing. It wasn’t. The bottleneck was expert review. Having someone who understands restoration deeply validate every article was the difference between content that ranks and content that gets ignored.

    This is why automation alone fails. You need human expertise in the domain, even if it’s just for 30-minute reviews.

    Content Distribution
    We didn’t just publish on 247’s site. We also:
    – Generated LinkedIn versions (B2B insurance partners)
    – Created TikTok scripts (for video versions)
    – Built email digests (weekly 247 newsletter)
    – Pushed to YouTube transcript database
    – Syndicated to industry publications

    One article authored itself across 5+ distribution channels.

    What We’d Do Differently
    If we built this again, we’d:
    – Invest earlier in content differentiation (each article should have a unique angle, not just different keywords)
    – Build more client case studies (“Here’s how we restored this specific home” content didn’t rank but drove the most leads)
    – Segment content by audience (homeowner vs. contractor vs. insurance adjuster) earlier
    – Test video content earlier (we added video at month 4, should have been month 1)

    The Scalability
    This model works at 40 articles/month. It would scale to 100+ with the same cost structure because:
    – Brief generation is automated
    – AI drafting is automated
    – The only variable cost is expert review time
    – Expert review scales with hiring

    The Takeaway
    You can publish high-quality content at scale if you:
    1. Automate the heavy lifting (brief generation, first draft)
    2. Keep expert review in the loop (30-minute review, not 2-hour rewrite)
    3. Use technology to enforce quality (three-layer gate, automated metadata)
    4. Pay for what matters (expert time, not writing time)

    247 Restoration went from invisible to dominant in their market in 6 months because they bet on scale + quality + automation. Most agencies bet on one or the other.

    {
    “@context”: “https://schema.org”,
    “@type”: “Article”,
    “headline”: “What 247 Restoration Taught Me About Content at Scale”,
    “description”: “How we built a content engine publishing 40+ articles per month for 247 Restoration—using automation, expert review, and a three-layer quality gate.”,
    “datePublished”: “2026-03-30”,
    “dateModified”: “2026-04-03”,
    “author”: {
    “@type”: “Person”,
    “name”: “Will Tygart”,
    “url”: “https://tygartmedia.com/about”
    },
    “publisher”: {
    “@type”: “Organization”,
    “name”: “Tygart Media”,
    “url”: “https://tygartmedia.com”,
    “logo”: {
    “@type”: “ImageObject”,
    “url”: “https://tygartmedia.com/wp-content/uploads/tygart-media-logo.png”
    }
    },
    “mainEntityOfPage”: {
    “@type”: “WebPage”,
    “@id”: “https://tygartmedia.com/what-247-restoration-taught-me-about-content-at-scale/”
    }
    }

    Questions? Chat on WhatsApp

    Visual summary

    About this image. This image is part of the Article Hero Images collection in the Tygart Media visual library. Every image produced by Tygart Media is AI-generated using Google Vertex AI (Imagen), converted to WebP format, and injected with full IPTC/XMP metadata before publication.

    • Format: WEBP
    • Collection: Article Hero Images
    • Pipeline: Vertex AI Imagen → WebP → IPTC/XMP → WordPress
  • The Restoration Company’s AI Stack: What to Use, What to Ignore, What’s Coming

    The Restoration Company’s AI Stack: What to Use, What to Ignore, What’s Coming

    Tygart Media / Content Strategy
    The Practitioner JournalField Notes
    By Will Tygart
    · Practitioner-grade
    · From the workbench

    The Restoration Company’s AI Stack: What to Use, What to Ignore, What’s Coming

    Everyone’s talking about AI. Restoration companies are asking me: “Should we use this? What about that? How do we not get left behind?”

    Fair questions. The AI landscape is moving fast. There’s real opportunity and real hype mixed together. Most restoration companies don’t have the time to separate signal from noise.

    So here’s the framework I use with our clients: three tiers. Tier 1 tools you should use now. Tier 2 tools you should evaluate carefully. Tier 3 tools to watch but not deploy.

    I run Claude, GCP infrastructure, and custom automation pipelines. My team has hands-on experience with most of the tools in this space. This isn’t a listicle or vendor research. This is what actually works.

    Tier 1: Deploy Now

    These tools deliver immediate ROI and are foundational to 2026 operational efficiency.

    1. Field Documentation: Encircle

    What it does: Mobile app for property inspectors and adjusters to document damage in real-time using photos, measurements, and AI-assisted damage assessment.

    Why now: 80% of property claims are still documented with photos on a smartphone and notes in a notepad. That’s not scalable. Encircle collects structured damage data in the field, syncs to your system, and feeds into Xactimate and your CRM.

    ROI: 2-3 hours faster documentation per site visit, which translates to faster estimate generation and faster claim approval from insurance carriers.

    Alternative: CompanyCam (good for general field documentation), JobDox (good if you’re already using Xactimate).

    Cost: $100–200/user/month depending on deployment scale.

    2. AI-Assisted Estimating: Rebuild AI

    What it does: Analyzes damage photos and generates AI-assisted estimates in Xactimate format, catching standard line items and flagging items that might need adjustment.

    Why now: Xactimate estimates take 30–45 minutes per site visit to generate manually. Rebuild AI can generate a draft estimate in 5 minutes. Your estimator then reviews and adjusts. This is 80% time savings on routine estimates.

    ROI: 20+ hours/week freed up for your estimating team, which you can redeploy to complex projects or business development.

    Cost: $300–500/month subscription.

    3. Damage Assessment Documentation: CompanyCam

    What it does: Simple field documentation tool that captures photos, location, timestamp, and job site notes. Integrates with Xactimate and most CRM platforms.

    Why now: Your field team is already taking photos. CompanyCam just organizes those photos into a structured format that syncs to your back office. Better than email or shared drives.

    ROI: 4–6 hours/week on photo organization, documentation lookup, and CRM data entry.

    Cost: $80–150/user/month.

    4. Content Generation: Claude or ChatGPT

    What it does: Generate marketing content, sales collateral, customer communications, case studies, and internal documentation at scale.

    Why now: Every restoration company needs marketing content. AI content generation (when properly edited and fact-checked) reduces content creation time by 70%. You’re spending less on content creation and getting more frequent content updates.

    ROI: 10–15 hours/week on content creation can be reduced to 2–3 hours/week for editing and direction-setting.

    Cost: $20/month (ChatGPT Plus) or Claude subscription ($10–20/month depending on usage tier).

    5. Email Automation: Make or Zapier

    What it does: Automates workflows between your CRM, email, Xactimate, and other tools. For example: when a new claim comes in via email, automatically create a record in your CRM, send a notification to your on-call estimator, and log the timestamp for SLA tracking.

    Why now: 40% of restoration company operations are still manual, including job assignment, notification routing, and status updates. Automation eliminates 30–50% of those manual steps.

    ROI: 15–20 hours/week on administrative work can be automated.

    Cost: $50–300/month depending on workflow complexity.

    Tier 2: Evaluate Carefully

    These tools have potential but require careful implementation and ongoing management. Don’t deploy blindly.

    1. AI-Powered CRM Routing: Custom Implementation

    What it does: AI system that analyzes incoming jobs (damage type, location, complexity, crew availability) and automatically routes to the best-fit crew.

    Why evaluate: Better routing reduces travel time and improves crew utilization by 15–20%. But implementation requires custom development and ongoing tuning.

    ROI: 10–15% improvement in crew efficiency and response time, but requires 2–3 months implementation time.

    Cost: $20K–50K custom development, then $500–1,500/month maintenance.

    When to deploy: After you have 3+ crews and 30+ jobs/month. Smaller operations don’t see ROI.

    2. AI-Driven Content Moderation: Self-Service

    What it does: AI system reviews customer testimonials, online reviews, and social media mentions to flag problematic content before it goes public.

    Why evaluate: One bad review or public complaint can damage your reputation. AI moderation catches issues early. But false positives are common—you still need human review.

    ROI: Prevents reputation damage in maybe 10% of cases, but requires manual intervention to implement.

    Cost: $200–500/month for third-party moderation tools, or $0 if you build custom prompts in Claude or ChatGPT.

    When to deploy: After you have consistent volume of online reviews and social media activity.

    3. Predictive Scheduling: NextGear Solutions

    What it does: Analyzes historical weather data, seasonal patterns, and claim history to predict when major loss events will occur and pre-position crews and equipment.

    Why evaluate: If you can predict spike periods, you can staff and inventory accordingly. But prediction accuracy is imperfect and overestimating leads to waste.

    ROI: Reduces emergency response time by 15–25%, but requires historical data and ongoing accuracy tuning.

    Cost: $1,000–3,000/month, plus implementation time.

    When to deploy: After you have 2+ years of historical data and volume to justify predictive modeling.

    4. Automated Report Generation: Custom Integration

    What it does: Takes damage assessment data (photos, measurements, notes) and automatically generates professional reports for insurance carriers and customers.

    Why evaluate: Automation saves time, but reports often need customization based on claim specifics. Requires careful design so the automation doesn’t create generic, unusable reports.

    ROI: 3–5 hours/week on report writing, but quality control is critical.

    Cost: $5K–15K to build, $200–500/month to maintain.

    When to deploy: After you have standardized report templates and can define clear rules for auto-generation.

    Tier 3: Watch but Don’t Deploy Yet

    These tools are interesting but either too new, too expensive, or too unproven for standard restoration operations.

    1. Drone-Based Damage Assessment

    What it does: Deploy drones to assess roof damage, large-scale loss events, and hard-to-reach areas. Combines drone imaging with AI analysis to estimate damage scope.

    Why watch: Drone assessments are 40–50% faster than manual roof inspections. But drone pilot licensing, weather dependence, and insurance liability make this complex. Most restoration companies aren’t equipped to operate drones safely and legally.

    Better approach: Contract drone assessment services from specialized companies rather than deploying internally.

    Cost to deploy: $15K–50K for equipment + licensing + insurance.

    Cost to contract: $200–500 per drone assessment.

    2. Autonomous Site Restoration Agents

    What it does: AI agents that can autonomously plan and coordinate complex restoration projects, including crew assignment, timeline optimization, inventory management, and quality control.

    Why watch: This is the holy grail of restoration efficiency. But current AI agents can’t handle the complexity and edge cases of real site management. Expect this to be viable in 2–3 years, not today.

    Current state: Vaporware. The vendors talking about this now are selling a future promise, not current capability.

    3. AI-Driven Insurance Claim Appeals

    What it does: AI system analyzes claim denials and automatically generates appeals with supporting evidence and precedent references.

    Why watch: Claim denials are expensive—often $5K–20K in lost revenue per denial. Automating appeals could recover 10–20% of denied claims. But claim language is complex, legal precedent is involved, and regulatory compliance is required.

    Current state: Emerging. Some vendors are building this, but it’s not mature enough for production use.

    Timeline to production: 18–24 months.

    4. Satellite and IoT-Based Damage Prediction

    What it does: Uses satellite imagery, IoT sensors, and ML models to predict which properties will suffer loss events in the next 30–90 days.

    Why watch: If you could predict losses before they happen, you could position crews and resources accordingly. But prediction accuracy is still 40–60%—too high a false-positive rate for current use.

    Current state: R&D phase. Insurance carriers are funding this research, but it’s not ready for operational deployment.

    Timeline to production: 24–36 months.

    Building Your AI Stack: The Phased Approach

    Phase 1: Foundation (Month 1–3)

    Deploy Tier 1 tools in this order:

    1. Field documentation (CompanyCam or Encircle)
    2. Email automation (Make/Zapier)
    3. Content generation (Claude or ChatGPT)

    Total cost: $200–400/month. Time to implement: 2–3 weeks.

    Phase 2: Optimization (Month 4–6)

    After foundation is stable, add:

    1. AI-assisted estimating (Rebuild AI)
    2. Process documentation (what did you learn from Phase 1?)

    Total cost: $300–500/month additional. Time to implement: 2–3 weeks.

    Phase 3: Advanced (Month 7–12)

    Evaluate Tier 2 tools based on your volume and pain points. Deploy only if ROI is clear.

    Phase 4: Continuous Learning

    Monitor Tier 3 tools. When they mature, reassess. Stay ahead of competitors but don’t adopt vaporware.

    The AI Stack ROI Summary

    Full Tier 1 deployment (all five tools) generates:

    • 30–40 hours/week time savings across the team
    • 15–20% faster estimate turnaround
    • 10–15% improvement in crew utilization
    • 50% reduction in manual data entry
    • 2–3x increase in content production frequency

    Total monthly cost: $500–900/month.

    Equivalent labor cost: 1.5–2 FTE. So you’re replacing $60K–80K/year in headcount with $6K–10K in tools, while freeing your existing team to focus on higher-value work.

    Common Mistakes When Deploying AI Tools

    Mistake 1: Deploying without data readiness

    AI tools work best when your underlying data is clean and consistent. If your CRM data is messy, automation tools will propagate the mess. Clean your data before automating.

    Mistake 2: Expecting AI to replace human judgment

    AI is augmentation, not replacement. Rebuild AI generates estimate drafts, not final estimates. Claude generates content outlines, not published articles. You’re eliminating grunt work, not expertise.

    Mistake 3: Overly complex implementations

    Start simple. Deploy one tool. Get the team comfortable. Then add complexity. Companies that try to automate everything at once end up with broken processes and frustrated teams.

    Mistake 4: Not measuring ROI

    Track time savings. Track turnaround improvements. Track crew utilization changes. If you can’t measure impact, you can’t justify the tool.

    FAQ

    Q: Is AI-generated content good enough for marketing?
    A: As a first draft, absolutely. Claude or ChatGPT can generate solid 80% of marketing content in 10 minutes. Your team spends 20 minutes editing and fact-checking. Result: 10x faster content production. Never publish AI content without review, but using it as a starting point is highly efficient.
    Q: What if AI tools make mistakes in estimates?
    A: That’s why Rebuild AI outputs are drafts, not finals. Your estimator reviews every line item. The tool catches the standard items; your estimator catches the edge cases. This division of labor is actually safer than manual estimation because the tool is consistent.
    Q: How do I integrate all these tools if my CRM doesn’t have good API support?
    A: Use Make or Zapier to bridge the gaps. These platforms connect tools that don’t have native integrations. You pay a small monthly fee and avoid expensive custom development.
    Q: What about AI tools that claim to automate the entire restoration process?
    A: Be skeptical. Restoration involves judgment calls, safety decisions, and complex coordination. Full automation isn’t realistic yet. Tools that claim to “fully automate” are overselling. Look for tools that solve specific problems (estimation, documentation, routing) rather than claiming to replace human management.
    Q: Should we train our team on AI tools before deploying?
    A: Yes. 30 minutes of training per tool per person. Show them what the tool does, why it matters, and how to use it. Most adoption resistance comes from lack of familiarity, not resistance to the tools themselves.

    The Restoration AI Stack is Maturing

    Five years ago, AI in restoration was a buzzword. Today, it’s operational reality.

    The companies getting value aren’t using vaporware or betting on unproven future capabilities. They’re using proven tools that solve specific problems: documentation, estimating, automation, content generation.

    They’re deploying in phases, measuring ROI, and avoiding hype.

    And they’re 30–40 hours/week more efficient than competitors who aren’t using AI tools.

    That’s not a technology advantage. That’s a business advantage.

    Illustration for article: The Restoration Company’s AI Stack: What to Use, What to Ignore, What’s Coming
  • Restoration Marketing 2026: AI, Healthcare & ESG Trends

    Restoration Marketing 2026: AI, Healthcare & ESG Trends

    The Machine Room · Under the Hood

    What Insurance, Healthcare, and ESG Are Telling Us About Restoration Marketing in 2026

    I work with a world-class martech lab in Manhattan. We track signals across industries—patterns that tell us where markets are heading before the obvious players catch on.

    Right now, three industries are broadcasting signals that directly impact how restoration companies need to market themselves in 2026 and beyond.

    Insurance carriers are automating claim management with AI. Healthcare systems are tightening operational budgets and risk profiles. ESG reporting is creating new accountability for property remediation and environmental stewardship. Each signal, independently, is interesting. Together, they’re reshaping what restoration companies need to prove to win contracts.

    If you’re not paying attention to these signals, you’re optimizing for last year’s market.

    Signal 1: Insurance Industry AI Automation

    The Data:

    • 90% of insurance carriers are exploring AI-driven claims management
    • Only 22% have deployed AI solutions at scale
    • The gap is closing rapidly—expect 60%+ deployed by Q4 2026
    • AI-driven claims management systems are reducing payouts automatically by flagging line items as “excessive” without human oversight
    • ML algorithms are flagging contractor submissions that deviate from historical averages, triggering secondary review

    What This Means for Restoration Companies:

    Insurance carriers are training AI systems on years of historical claim data. The AI learns what “normal” costs look like for water damage remediation, fire damage assessment, and HVAC restoration. When your estimate deviates from the learned norm, the AI flags it.

    The system doesn’t know if your deviation is justified—maybe the damage is worse than average, maybe you’re accounting for specialized equipment, maybe you’re factoring in a tight timeline. It just knows: this is outside the statistical range.

    What used to require a human adjuster to explain and defend now requires algorithmic justification.

    This has two implications:

    First: Your estimates need to be defensible at the line item level. Not just accurate, but explainable. Every line item needs context. “HVAC system restoration” isn’t enough. “HVAC system restoration: 12,000 BTU unit, 15-year-old hardware, mold remediation protocol required, parts lead time 7 days” is defensible.

    Second: You need to document faster and more comprehensively. AI systems are learning on submitted documentation. The better and more detailed your field documentation is, the more defensible your estimates become. Carriers are now grading contractors on documentation quality as much as on price.

    This is why companies like Encircle (field documentation with AI-assisted damage assessment) are becoming infrastructure, not optional software.

    Signal 2: Healthcare Facility Risk Management

    The Data:

    • Healthcare spending is growing at 8% CAGR for employer plans (compared to 3% general inflation)
    • Healthcare facilities are the fastest-growing segment in commercial property markets
    • Business continuity risks in healthcare are now rated as “critical” by 91% of hospital risk managers
    • A single day of downtime in a healthcare facility costs $500K–$2M+ depending on facility size
    • Regulatory compliance for facility recovery is tightening: HIPAA implications for data center downtime, CMS requirements for emergency protocols

    What This Means for Restoration Companies:

    Healthcare facilities are a massive untapped customer segment for most restoration companies. Why? Because healthcare doesn’t think like a typical commercial property manager. A data center leak in a hospital isn’t just “water damage.” It’s a potential HIPAA violation, a potential loss of patient records, a potential regulatory fine.

    Healthcare facilities need restoration contractors who understand compliance implications, not just damage mitigation.

    This creates a positioning opportunity: Restoration expertise + compliance documentation + business continuity focus.

    A standard restoration company says: “We’ll dry your HVAC system and get you back to normal.”

    A healthcare-positioned restoration company says: “We’ll dry your HVAC system while maintaining HIPAA chain-of-custody documentation, providing regulatory attestation, and coordinating with your business continuity team to minimize operational downtime.”

    The second one gets higher contract values and wins more bids because they’re solving the actual problem (risk + downtime), not just the surface problem (water damage).

    Healthcare facility recovery is becoming a specialized vertical. First-mover advantage is significant.

    Signal 3: ESG Integration into Insurance Underwriting

    The Data:

    • 75% of major insurance carriers now integrate ESG goals into underwriting decisions
    • Carriers are using satellite imagery, IoT sensors, and hyper-local climate forecasts to refine risk profiles
    • ML algorithms simulate black swan scenarios with 20% greater accuracy using climate data + property data
    • Environmental remediation and waste disposal practices are now factored into contractor selection
    • Carriers are penalizing properties with poor environmental stewardship records, which impacts future insurability

    What This Means for Restoration Companies:

    Insurance carriers aren’t just evaluating contractors on price and speed anymore. They’re evaluating environmental impact.

    How much waste did you generate? Did you use sustainable disposal methods? Did you minimize water usage? Did you recycle salvageable materials? These aren’t nice-to-haves. They’re becoming underwriting criteria.

    Why? Because ESG reporting creates legal liability. If a carrier insures a property that’s damaged by a loss event, and the remediation contractor generates hazardous waste that contaminates groundwater, the carrier has environmental liability. Better to vet contractors for environmental stewardship upfront.

    This creates a positioning opportunity: Environmentally responsible restoration.

    Standard positioning: “Fast and reliable water damage restoration.”

    ESG-aligned positioning: “Certified sustainable water damage remediation with % waste diversion, gallons water recycled, and environmental compliance documentation for insurance carriers.”

    The second one wins contracts from carriers prioritizing ESG-aligned contractors.

    More importantly, it creates premium pricing. Companies positioning on environmental stewardship charge 10–15% premiums because they’re solving a problem carriers now consider high-priority.

    Cross-Signal Analysis: What These Signals Tell You

    Three separate industries. Three separate signals. One unified implication for restoration marketing:

    Documentation and specificity are more valuable than price and speed.

    In the old market (2015–2023), restoration companies competed on response time and cost. Faster arrival, lower price, done.

    In the emerging market (2026+), restoration companies compete on:

    • Defensible documentation: Every line item justified, every scope decision documented, every decision traceable.
    • Compliance alignment: Healthcare requires HIPAA documentation. Finance requires SOX compliance. Regulated industries require specific protocols.
    • Environmental accountability: Waste management, water recycling, sustainable disposal methods.
    • Business continuity integration: Understanding how your mitigation timeline impacts the customer’s operational recovery.

    These aren’t expensive to implement. They’re expensive to ignore.

    A restoration company that implements these doesn’t necessarily charge less. But they win more bids, they win higher-value contracts, and they have fewer disputes with insurance carriers.

    The Insurance Automation Implication: Xactimate as De Facto Standard

    80% of property claims in the US are estimated using Xactimate. That percentage is growing.

    Why? Because carriers are training AI systems on Xactimate data. Xactimate is becoming the standard language between restoration contractors and insurance carriers.

    If you’re not fluent in Xactimate, you’re handicapping yourself. Not because Xactimate is perfect—it’s not. But because carriers now expect estimates in Xactimate format, and deviations from that format get flagged as anomalies by AI systems.

    This means:

    • Every estimate should include Xactimate line item codes
    • Every scope decision should map to standard Xactimate procedures
    • Deviations should be documented with justification
    • Your CRM should integrate with Xactimate or have real-time Xactimate sync capability

    Companies like NextGear Solutions and Rebuild AI are seeing adoption acceleration specifically because they integrate with Xactimate and provide AI-assisted estimation that produces insurance-compliant outputs.

    The Healthcare Vertical Opportunity: First-Mover Advantage

    Healthcare facility restoration is not a crowded vertical. Most restoration companies think “commercial” and immediately think office buildings.

    Healthcare is systematically different:

    • Higher regulatory compliance requirements
    • Longer decision-making timelines (because compliance is involved)
    • Higher contract values (because downtime costs are so high)
    • Repeat business (healthcare portfolios are large)
    • Direct vendor relationships with facility directors (not necessarily insurance-driven)

    A restoration company that builds expertise in healthcare facility recovery (HIPAA compliance, business continuity coordination, data center protocols) can charge premium rates and win recurring contracts from hospital systems and healthcare real estate funds.

    And barely any restoration companies are doing this yet.

    The ESG Angle: Premium Positioning Through Environmental Stewardship

    ESG isn’t a marketing gimmick anymore. It’s a purchasing criterion for insurance carriers.

    If your restoration company has:

    • Documented waste diversion rates (75%+ recovery)
    • Water recycling capability
    • Sustainable disposal partnerships
    • Environmental compliance certification

    You can charge premiums that offset the cost of these capabilities. And carriers will pay because you’re reducing their ESG risk profile.

    This is also a vendor relationship opportunity. Waste management companies, environmental remediation firms, and recycling partners become part of your service delivery model. You’re no longer just a restoration company; you’re a responsible environmental steward. That positioning wins contracts.

    Integration: The Restoration Company Operating Model in 2026

    If you’re paying attention to these signals, your operating model should include:

    1. Documentation-First Infrastructure

    Field documentation software (Encircle, CompanyCam, JobDox) captures damage comprehensively. Data flows into Xactimate. Xactimate generates insurance-compliant estimates. Everything is documented and defensible.

    2. Compliance-Aware Positioning

    You market yourself not just as a restoration contractor but as a solution for specific vertical requirements: healthcare compliance, financial services continuity, ESG-aligned remediation.

    3. Environmental Accountability

    You document waste management, water recycling, sustainable disposal. This becomes part of your proposal to customers and carriers.

    4. Business Continuity Integration

    You understand how your mitigation timeline impacts customer operations. You coordinate with their business continuity teams, not just their insurance carriers.

    This isn’t more expensive. It’s differently organized. And it positions you to win the contracts that restoration companies still operating on 2015 principles can’t even compete for.

    FAQ

    Q: If insurance carriers are automating claims with AI, doesn’t that reduce demand for restoration contractors?
    A: No. AI automates processing, not demand. AI approval of estimates still requires someone to do the actual work. It makes winning bids more competitive (you have to be defensible), but it doesn’t reduce the volume of work. It actually increases it by removing friction from the approval process.
    Q: How do I start positioning for healthcare facilities?
    A: Start by understanding healthcare compliance requirements: HIPAA, OSHA, state health department regulations. Then identify healthcare real estate funds and hospital systems in your market. Reach out to their facilities teams with a healthcare-specific proposal. First contract takes longer, but repeat business is consistent.
    Q: Do I need certification to do ESG-aligned restoration?
    A: No specific certification, but documenting waste diversion, water recycling, and sustainable disposal helps. Partners like waste management companies and environmental consultants can help you build credibility. Third-party documentation of your environmental practices becomes your competitive differentiation.
    Q: How much premium can I charge for ESG-aligned practices?
    A: 10–15% premium for documented environmental stewardship. Carriers will pay because it reduces their ESG risk profile. The cost of implementing waste recycling and water reclamation is typically 5–7% of project cost, so the premium is profitable.
    Q: Should I be optimizing for AI-driven claims processes?
    A: Yes. Use Xactimate, document comprehensively, provide line-item justification. This isn’t optional. 60%+ of insurance carriers will have AI-driven claims by Q4 2026. Being defensible to AI systems is now baseline competitive requirement.

    The Market Is Shifting

    Insurance is automating. Healthcare is prioritizing continuity. ESG is becoming law.

    Your restoration company needs to evolve alongside these shifts. Not by chasing shiny new tools, but by understanding the actual problems driving these changes and positioning your service delivery around solving them.

    The companies that do this first will have years of competitive advantage before it becomes standard practice.

    Illustration for article: Restoration Marketing 2026: AI, Healthcare & ESG Trends

    Visual summary

    Editorial illustration for What Insurance, Healthcare, and ESG Are Telling Us About Restoration Marketing in 2026 - Tygart Media AI-generated visual
    AI-generated editorial illustration — Vertex AI Imagen 4 Standard

    About this image. This image was generated by Google’s Vertex AI Imagen 4 model as the featured visual for What Insurance, Healthcare, and ESG Are Telling Us About Restoration Marketing in 2026. Every image in the Tygart Media visual library is AI-generated, converted to WebP for optimal performance, and enriched with IPTC/XMP metadata for search engine discoverability.

    • Model: Vertex AI Imagen 4 Standard (imagen-4.0-generate-001)
    • Format: WebP (quality 90)
    • Aspect Ratio: 16:9
    • Metadata: IPTC/XMP injected (title, description, creator, rights, location)
    • Creator: Tygart Media — tygartmedia.com

    Part of The Studio collection — AI-generated visuals powering the Tygart Media content engine.

  • 6 Vendor Relationships That Generate Restoration Leads Without a Single Ad Dollar

    6 Vendor Relationships That Generate Restoration Leads Without a Single Ad Dollar

    Tygart Media / Content Strategy
    The Practitioner JournalField Notes
    By Will Tygart · Practitioner-grade · From the workbench

    6 Vendor Relationships That Generate Restoration Leads Without a Single Ad Dollar

    Google Map Pack generates 60–70% of all contractor leads in 2026. But relationship-based sales just made its comeback. And it’s bigger than it was five years ago. Why? Because the market is crowded. Digital marketing channels are saturated. CPC is climbing. Differentiation is disappearing. Property managers are overwhelmed with sales calls and ads. Meanwhile, they’re not overwhelmed with contractors who actually show up, do good work, and stay in touch. The market is $55.81B growing 5.7% CAGR. That’s plenty of volume for multiple strategies. But the companies that are scaling the fastest aren’t maximizing Google Ads. They’re maximizing vendor relationships. A vendor relationship works like this: another contractor or service provider regularly interfaces with your target customer. They see problems before you do. They have credibility you have to earn. They can introduce you directly. And they have zero reason to deceive the people they refer you to. That’s better than any paid advertising channel. Here are six vendor relationships that generate restoration leads at scale. Each one is field-tested, each one is free to establish, and each one generates better-quality leads than traditional digital marketing.

    Strategy 1: The Locksmith Strategy

    Locksmiths respond to the same emergency calls as restoration contractors. A burst pipe floods a commercial space at 3 AM. The facility manager calls their after-hours contact to secure the building. That’s often a locksmith—change locks, secure entry points, document access. The locksmith is on site within an hour. They see the damage. They know who needs to be called next. If that locksmith knows your restoration company, you’re getting the call at 3:15 AM when the damage is fresh and time-sensitive. That’s a job you don’t have to bid on competitively. You’re the first responder. How to establish this relationship: Identify locksmiths who work commercial properties in your service area. Call them directly. Offer this arrangement: when they’re on a commercial emergency and they see water/fire/smoke damage, recommend you. In exchange, you’ll refer them property managers and building owners who need locks rekeyed, access control installed, or emergency lock-outs handled. Most locksmiths work in a silo—they’re not connected to property managers the way they should be. You can give them that connection. This relationship often generates 2–4 emergency calls per month once established. Emergency calls convert at 85%+ because there’s no competitive bidding—you’re the responder on scene.

    Strategy 2: The Flooring Vendor Strategy

    Flooring installers see the aftermath of water damage before you do. When a water intrusion event occurs and the water is remediated, flooring is the next call. The flooring contractor assesses damage, determines what can be saved, and manages the reinstallation. They’re in the building during the reconstruction phase. They see the scope of damage. They understand the timeline and cost implications. They know the property manager’s frustration level. If the flooring contractor recommends your restoration company, they’re endorsing you as the reason the project is moving forward on time and within insurance thresholds. That’s credibility that’s hard to earn any other way. How to establish this relationship: Identify major flooring installation companies or multi-trade restoration companies that handle flooring. Meet with the owner or operations director. Propose: when they see water damage sites, recommend your company for the mitigation and extraction phase before they come in for flooring work. In exchange, you’ll refer them property managers you work with who need flooring restoration after damage events. This relationship typically generates 3–6 leads per month. Flooring vendors have high touchpoints with building owners and property managers, so they’re credible referrers. Close rate is typically 50–65%.

    Strategy 3: The In-House Board-Up Strategy

    Most restoration companies subcontract board-up work. You’re scaling fast, there’s a fire event, you need plywood and tarps on windows and doors within 4 hours. You call a board-up subcontractor. Stop. Board-up is your highest-value lead source. Every property that’s damaged enough to need board-up is damaged enough to need your core services: water extraction, content restoration, structural drying, smoke remediation. You’re subcontracting to someone else a lead that should be consolidated under your control. More importantly, your board-up subcontractor is making the first impression on the property manager. They’re on site at 2 AM. They’re professional or they’re not. They’re licensed or they’re not. If they mess it up, the property manager thinks your company messed it up. How to bring this in-house: You need two things: a small crew trained on emergency tarping and board-up, and a 24/7 dispatch system. If you’re already running a restoration crew, you don’t need dedicated board-up staff. You cross-train your existing crew on emergency weather mitigation. The ROI is immediate—you capture 100% of the lead value instead of giving away 20–30% to a subcontractor. This strategy alone generates 10–20 incremental leads per month in most markets. Close rate is 90%+ because there’s no competitive bidding—you’re responding to an emergency that requires immediate action.

    Strategy 4: The IA Placement Strategy

    Insurance Adjusters see claims daily. They’re the first on site for most loss events. They assess damage, authorize mitigation contractors, manage the claim. They’re the gatekeeper between the insurance carrier and your restoration company. If adjusters recommend your company, you skip the bidding process. You’re the contractor they trust. Here’s the thing about adjusters: they don’t want to make bad recommendations. If they recommend a contractor who does shoddy work, the claim files go sideways. The insurance carrier complains. Their reputation gets damaged. So they’re conservative about recommendations. But once they trust a contractor, they recommend repeatedly. You’re now their preferred restoration partner. That means you’re top-of-mind for every claim they handle. How to establish this relationship: Identify adjusters who work properties in your service area. Meet them for coffee. Don’t pitch. Listen. Ask about their biggest pain points with restoration contractors. Usually it’s: slow response, poor communication, overages on estimates, scope creep, damage to other parts of the property during mitigation. Show them you do the opposite. Respond in 2 hours. Communicate proactively. Stick to estimates. Define scope tightly. Take care of the property like it’s your own. Offer this: when they have a claim in your service area, let you quote and handle it. You’ll make sure the claim process moves fast and clean. In exchange, you’ll give them a direct line to your company and preference in response timing. This relationship typically generates 4–8 claims per month once established. Close rate is 75–85% because adjusters are already filtering for fit before they send you the lead.

    Strategy 5: The Groundbreaking Indicator Strategy

    New construction permits are public record. Every ground-breaking signals a future loss event. A new office building breaks ground. In 18–36 months, it’s occupied. In 36–60 months, there’s a major loss event: water intrusion, HVAC failure, fire damage. Storms hit. Emergencies happen. Every new building eventually becomes a restoration client. Your job is to establish the relationship before the loss occurs. How to use this strategy: Monitor building permits in your market. Identify new commercial construction in your service area. When the building is 80–90% complete, identify the general contractor managing the project. Reach out to them directly. Propose: when this building opens, introduce you to the property manager as their disaster recovery partner. In exchange, you’ll refer facility directors you know who might need construction services. This relationship takes longer to generate leads—you’re planting seeds for future claims. But once the building is occupied and operational, the property manager has a trusted restoration partner on speed dial. This strategy typically generates 2–4 leads per year per property, but those leads are pre-qualified and come with high trust. Close rate is 85%+.

    Strategy 6: The Fire Extinguisher Tag Strategy

    This is the playbook we detailed in depth in the previous article. Fire protection companies service buildings quarterly. They have relationships with every property manager and facility director on their service route. They’re trusted vendors. If you establish a partnership with a fire protection company, you’re now part of their referral network. Quick recap on execution: Walk buildings in your market, identify the fire protection companies servicing them (look at the tags on fire extinguishers), approach them with a partnership proposal, and become their go-to restoration contractor for referrals. This relationship typically generates 2–6 leads per month. Close rate is 50–70% because property managers already trust the referrer. Average deal value is higher because fire protection partners tend to know larger commercial properties.

    The Vendor Multiplier: Stacking Relationships for Scale

    The real power emerges when you layer these strategies on top of each other. You establish one locksmith relationship. That gives you 2–4 emergency calls per month. You establish one flooring vendor relationship. That adds 3–6 leads per month. You bring board-up in-house. That adds 10–20 leads per month. You build an adjuster relationship. That adds 4–8 claims per month. You monitor permits and approach general contractors on new construction. That adds 2–4 leads per year per property (so if you seed 5 new buildings per year, that’s 40–60 leads annually, or 3–5 per month). You establish a fire extinguisher partnership. That adds 2–6 leads per month. Total: 25–50 leads per month from relationship strategies. Most of those leads have a 50–85% close rate, compared to 8–15% for cold Google Ads. And the all-in cost is: relationships, communication, good work, and maybe $2,000–5,000 per month in referral fees. Compare that to the same volume through Google Ads:
    • 25–50 leads = 150–625 clicks at $15–35 per click
    • Cost: $2,250–$21,875 per month
    • Plus agency fees if you’re not running ads yourself
    • Plus time managing campaigns and optimizing landing pages
    The relationship model is 3–10x cheaper and produces higher-quality leads.

    Why This Works: The Decision-Making Reality

    Property managers don’t wake up wanting to hire a restoration contractor. Loss events aren’t planned. When damage happens, they need someone fast. Their instinct is to call someone they already know or someone recommended by someone they trust. Google Ads work when someone is actively searching for a solution. But commercial property managers aren’t searching for restoration contractors. They’re managing properties, dealing with maintenance, handling emergencies. The contractors getting the best work aren’t the ones with the best ads. They’re the ones already in someone’s phone. They’re the ones who get recommended by trusted vendors. They’re the ones property managers call at 2 AM because they know they’ll show up. Relationship strategies reach decision-makers at the moment of trust, not the moment of search.

    Building a Sustainable Vendor Network

    Here’s how to systematize this: Month 1: Identify and Approach Pick one or two vendor strategies. Identify 3–5 potential partners. Make cold calls. Get meetings scheduled. Month 2: Build Relationships Have in-person meetings. Clarify the arrangement. Exchange contact information. Establish communication protocols. Month 3: Deliver Value When referrals come in, respond fast and deliver excellent work. Send case summaries back to your vendors. Ask for feedback. Month 4–6: Expand Add a second vendor strategy. Strengthen relationships from Month 1. Collect testimonials and referrals from the first set of partners. Month 6–12: Scale Add a third strategy. Expand existing partnerships if they’re producing consistent referrals. Build depth in the relationships that work best. By month 12, you should have 3–4 consistent vendor partnerships generating 15–30 leads per month.

    FAQ

    Q: How do I prioritize which vendor strategies to pursue first?
    A: Start with the one that maps to your existing customer base. If you already work with adjusters, deepen that relationship first. If you have flooring vendor contacts, start there. Build momentum in one area before expanding to the next.
    Q: What if my market is already saturated with vendor relationships?
    A: Unlikely. Most restoration companies aren’t actively pursuing vendor relationships. Even in saturated markets, there’s room for one more trusted contractor. But if saturation is real, it means better work and faster response are your differentiators.
    Q: How often should I communicate with my vendor partners?
    A: After the first 6 months, quarterly check-ins are standard. More frequent contact if you’re actively receiving referrals. Send case summaries, thank you notes, and market updates that help them do their job better.
    Q: Can I run vendor relationships and Google Ads simultaneously?
    A: Yes, but I’d prioritize vendor relationships first. Once they’re generating consistent leads, Google Ads can fill the gap. But most restoration companies I work with find vendor relationships so efficient that Google Ads becomes unnecessary.
    Q: What if a vendor partner sends me a low-quality lead?
    A: Handle it professionally. Maybe it was a bad fit or their understanding of your scope was off. Don’t blame them. Clarify expectations. Ask what went wrong. Most vendor relationships improve after a few iterations of feedback.

    The Hidden Sales Network

    Your competitors are bidding on keywords. They’re paying for clicks. They’re competing on ad spend. Meanwhile, you’re building a network of trusted vendors who make recommendations on your behalf, who send you leads before they send them to competitors, who stake their reputation on your ability to deliver. That’s not a marketing strategy. That’s a business model. And the best part: it’s free to start and scales indefinitely.
    Illustration for article: 6 Vendor Relationships That Generate Restoration Leads Without a Single Ad Dollar

    Visual summary

    Editorial illustration for 6 Vendor Relationships That Generate Restoration Leads Without a Single Ad Dollar - Tygart Media AI-generated visual
    AI-generated editorial illustration — Vertex AI Imagen 4 Standard

    About this image. This image was generated by Google’s Vertex AI Imagen 4 model as the featured visual for 6 Vendor Relationships That Generate Restoration Leads Without a Single Ad Dollar . Every image in the Tygart Media visual library is AI-generated, converted to WebP for optimal performance, and enriched with IPTC/XMP metadata for search engine discoverability.

    • Model: Vertex AI Imagen 4 Standard (imagen-4.0-generate-001)
    • Format: WebP (quality 90)
    • Aspect Ratio: 16:9
    • Metadata: IPTC/XMP injected (title, description, creator, rights, location)
    • Creator: Tygart Media — tygartmedia.com

    Part of The Studio collection — AI-generated visuals powering the Tygart Media content engine.

  • Restoration Company SEO: Fix Your AI Search Visibility

    Restoration Company SEO: Fix Your AI Search Visibility

    Tygart Media / The Signal
    Broadcast Live
    Filed by Will Tygart
    • Tacoma, WA
    • Industry Bulletin

    Why Your Restoration Company Is Invisible to AI (And How to Fix It)

    You’ve spent the last three years optimizing for Google search rank. Your SEO agency promised first-page visibility. You got it. And nobody’s clicking through.

    That’s not an accident. That’s the new normal.

    In 2026, 58–62% of all searches result in zero clicks. When Google’s AI Overviews trigger, that number jumps to 83%. On mobile, for local “near me” searches, you’re looking at 78% zero-click rates. And in Google’s AI Mode, 93% of users never reach your website at all.

    Your restoration company spent real money appearing in organic search results while the search engine itself answers the question before anyone clicks a link. You’re ranked. You’re invisible.

    The problem isn’t your website. It’s your strategy.

    How AI Has Changed What “SEO” Means

    Traditional SEO was about earning a ranked position on the SERP. First page. Top three if you were good. Top one if you were excellent.

    That strategy assumed users would scroll through results and click on websites.

    AI-generated overviews bypass that entire step. Google synthesizes an answer directly in the interface, citing sources algorithmically. Your website gets the citation—maybe—but the user gets their answer without ever landing on your page. The citation is attribution, not traffic.

    This is the AEO shift: Authority in External Optimization.

    AEO isn’t about ranking anymore. It’s about being cited. It’s about being the source AI trusts enough to recommend by name. It’s about CTR drop from 15% to 8% when an AI Overview is present—that’s not a bug, it’s the entire premise of how search now works.

    Most restoration companies haven’t noticed yet. They’re still chasing position one, still measuring success by visibility score, still treating AI as something “futuristic.”

    It’s not. It’s here. And if you’re not structured for AI to read, understand, and recommend you, you’re competing in a game that no longer exists.

    Why Restoration Companies Are Losing on AI Search

    Here’s what an AI Overview needs to recommend your restoration company:

    • Entity clarity: Your company, services, and expertise need to be unmistakably clear to machine-readable protocols.
    • Topical authority: You need to be the established expert on the specific topic AI is answering about—not just a competitor listed among many.
    • Structured data: AI reads JSON-LD schema, Organization markup, LocalBusiness data. If it’s not structured, AI can’t confidently cite you.
    • Citation frequency and consistency: You need to be referenced by other authoritative sources on your expertise area.
    • Answer-ready content: Your content needs to directly answer the specific questions AI is being asked—not generic web copy.

    Restoration companies typically fail on all five counts.

    Your website says “water damage restoration” in the same way every other restoration company does. Your schema markup, if present, is basic LocalBusiness data. Your internal linking doesn’t create topical authority clusters. You’re not being cited by industry publications or cross-industry partners who could validate your expertise to AI systems. Your content reads like it was written for humans scrolling, not for AI extracting factual claims.

    So when AI answers a question about fire damage remediation protocols, coverage thresholds, or HVAC system restoration, your company isn’t in the consideration set. The AI doesn’t know you’re an expert. It hasn’t been trained to trust you as a source. Your competitor got their methodology cited in three industry articles; yours never appeared anywhere outside your own domain.

    AI doesn’t penalize you for this. It just ignores you.

    The Three-Layer AEO Architecture

    If zero-click is the future, you need a strategy that wins in a zero-click environment. That means restructuring around three layers:

    Layer 1: Entity Clarity

    Google and AI systems model the world as entities—things, people, organizations, concepts. Your restoration company is an entity. “Water damage restoration” is an entity. “Commercial property recovery” is an entity.

    Your website needs to be unambiguous about who you are and what you specialize in. This isn’t about keywords. It’s about ontology. AI needs to understand:

    • Your legal entity name and all variations (DBA, acronyms)
    • Your service categories with technical precision
    • Your geographic service areas
    • Your credentials, certifications, and partnerships
    • Your unique positioning relative to competitors

    This information needs to live in schema markup—Organization, LocalBusiness, ProfessionalService—and be consistent across your domain. Inconsistency tells AI it can’t trust the data.

    Layer 2: Topical Authority Clusters

    You can’t be an expert on “restoration” to AI. The topic is too broad. You need to own a specific vertical slice of restoration knowledge.

    For a commercial restoration company, that might be:

    • Commercial water damage recovery (not residential)
    • High-rise HVAC remediation
    • Facility business continuity after loss events
    • Insurance carrier coordination protocols

    Each of these becomes a topical authority cluster. You build 15–25 interconnected pieces of content that establish you as the definitive source on that specific topic. Not general restoration. Specific. Deep. Technical.

    AI systems reward this specificity. When it answers a question about HVAC system restoration in 15-story office buildings after a fire event, and your content is the most comprehensive, technically accurate, entity-rich resource on that specific topic, AI cites you by name.

    Layer 3: Cross-Domain Citation Authority

    The third layer is the hardest to build but most valuable to AI systems: being cited by third parties who AI already trusts.

    This means your restoration methodology appears in industry publications. Your case studies are referenced by business continuity sites. Your approach to facility recovery is mentioned in insurance industry analyses. Your insights on commercial property remediation show up in risk management roundtables.

    Each citation from an authoritative third-party domain tells AI: “This company is recognized as an expert by other experts.”

    This is why HubSpot’s AEO Grader now measures AI visibility as a distinct metric from traditional search ranking. It’s not about being first on Google anymore. It’s about being cited as a trusted authority in AI-generated answers.

    The First-Mover Advantage

    Here’s the uncomfortable truth: almost nobody in the restoration industry is doing this yet.

    Your competitors are still chasing rank one on Google. They’re still paying SEO agencies for first-page visibility. They’re still measuring success by organic traffic, which is becoming a lagging indicator of marketing effectiveness.

    Meanwhile, 83% of searches that trigger AI Overviews result in zero clicks. The people searching aren’t coming to their websites. The rank doesn’t matter.

    If you restructure your digital presence for AEO—entity clarity, topical authority, cross-domain citations—you’re not competing with the restoration companies optimizing for rank. You’re competing with a category of competitors that, frankly, don’t exist yet.

    The market is soft. The opportunity is real. And the window is open right now.

    In 12 months, every major restoration franchise will be hiring agencies to build topical authority clusters and establish third-party citations. The cost will be high. The differentiation will disappear. You’ll be back in a commoditized market.

    Right now, you have time to become the authority before everyone else figures out the game changed.

    Building Your AEO Stack

    This isn’t a one-time project. It’s an operating model shift. Here’s where to start:

    Week 1–2: Entity Audit

    Document your company entity across all internal properties. Legal name, service categories, credentials, partnerships, service areas. Get it precisely consistent. Build your Organization and LocalBusiness schema markup with authority-class detail.

    Week 3–4: Topic Mapping

    Define your 3–5 core topical authority areas. Map 15–25 content clusters for each. Don’t chase traffic. Chase comprehensiveness on a specific topic.

    Month 2–3: Content Architecture

    Build interconnected, technically precise content within each cluster. Internal linking should form a tight web. Entity references and schema markup should be dense.

    Month 4+: Third-Party Authority Building

    Guest contributions, research partnerships, data sharing, industry collaborations. Get cited. Get mentioned. Get your methodology published outside your domain.

    Measuring AEO Success

    Traffic metrics become less meaningful as zero-click search expands. You need new measures:

    • AI citation frequency: Track how often your company is cited in AI Overviews for target keywords.
    • Featured snippet wins: Monitor extraction into AI-readable formats.
    • Authority mentions: Third-party citations and backlinks from topical authority domains.
    • Entity confidence: Schema markup validation and knowledge graph appearance.
    • Conversion attribution: Lead source tracking for AI-referred traffic (voice search, assistant recommendations, AI Mode direct recommendations).

    The old metrics—organic traffic, ranking position, CTR—tell you how well you’re playing the game that no longer matters.

    These new metrics tell you how well you’re positioned for the game that’s actually happening.

    FAQ

    Q: If zero-click search means nobody clicks through, how does AEO generate leads?
    A: AI-driven discovery still converts. When Google Assistant, ChatGPT, or Claude recommends your company by name as the restoration authority in a specific area, people search for you directly. Direct searches have higher intent. You’re not competing on rank anymore; you’re competing on being the recommended authority. The conversion rate is typically higher than organic rank traffic because the user already trusts the AI’s recommendation.
    Q: How long does it take to build topical authority that AI recognizes?
    A: 4–6 months for initial positioning, 12–18 months for dominant authority. The timeline depends on how deep your content goes, how consistent your entity markup is, and how aggressively you pursue third-party citations. But you’ll see AI citation mentions within 60 days of launching properly structured content.
    Q: Should we stop doing traditional SEO?
    A: No. Traditional ranking still drives some traffic. But the ROI has shifted. If you’re spending 80% of your SEO budget on rank optimization, you should be spending 60% on AEO positioning and 20% on maintaining rank. The mix matters more than the absolute investment.
    Q: Do insurance carriers and adjusters use AI search?
    A: Yes. They use Claude, ChatGPT, and Gemini to research contractors, assessment protocols, and market rates. When an adjuster asks their AI assistant for the best commercial water restoration protocol, if your content is cited as the authority, you’re now part of their decision framework—without any active sales effort.
    Q: What role does schema markup play if AI doesn’t always follow links?
    A: Schema markup is how AI understands your claims. Without Organization and LocalBusiness markup, AI can’t confidently extract your credentials, service areas, or specialization. With it, AI can cite you with higher confidence and include more specific details about your expertise. Schema markup isn’t about traffic; it’s about being intelligible to machine learning systems.

    The Invisible Becomes Visible

    Your restoration company can’t compete in a search landscape where the search engine answers questions before anyone reaches your website. Traditional SEO was built for a different era.

    But AEO—being the authority AI recommends—is a different game. And right now, almost nobody in restoration is playing it.

    The companies that restructure around entity clarity, topical authority, and third-party citations won’t just be visible. They’ll be the definitive trusted source. And when trust is how AI recommends, that’s the position that matters.

    Start this week. Your competitors are still optimizing for rank.

    Illustration for article: Restoration Company SEO: Fix Your AI Search Visibility

    Visual summary

    Editorial illustration for Why Your Restoration Company Is Invisible to AI (And How to Fix It) - Tygart Media AI-generated visual
    AI-generated editorial illustration — Vertex AI Imagen 4 Standard

    About this image. This image was generated by Google’s Vertex AI Imagen 4 model as the featured visual for Why Your Restoration Company Is Invisible to AI (And How to Fix It). Every image in the Tygart Media visual library is AI-generated, converted to WebP for optimal performance, and enriched with IPTC/XMP metadata for search engine discoverability.

    • Model: Vertex AI Imagen 4 Standard (imagen-4.0-generate-001)
    • Format: WebP (quality 90)
    • Aspect Ratio: 16:9
    • Metadata: IPTC/XMP injected (title, description, creator, rights, location)
    • Creator: Tygart Media — tygartmedia.com

    Part of The Studio collection — AI-generated visuals powering the Tygart Media content engine.