When we wrote about what a million fair visitors leave behind, the claim underneath the piece was that the fair lives on phone screens as much as on the fairgrounds. Claims like that deserve receipts. So we pulled the receipts: Google Trends, day by day, for the whole run of the 2026 Washington State Fair — what Washington searched, and when.
This is the first installment of The Fair, in Search: a case study in four parts, built entirely from the search record. And the record’s first surprise is the shape itself.
How to read the numbers: Google Trends reports a relative index, not raw counts. 100 is the single biggest day in the window; every other day is scored against it. These figures are Washington State searches for the exact term “Puyallup Fair,” pulled for August 24 – October 12, 2026. Comparisons inside this one pull are apples-to-apples. (Methods and limits at the end — they matter.)
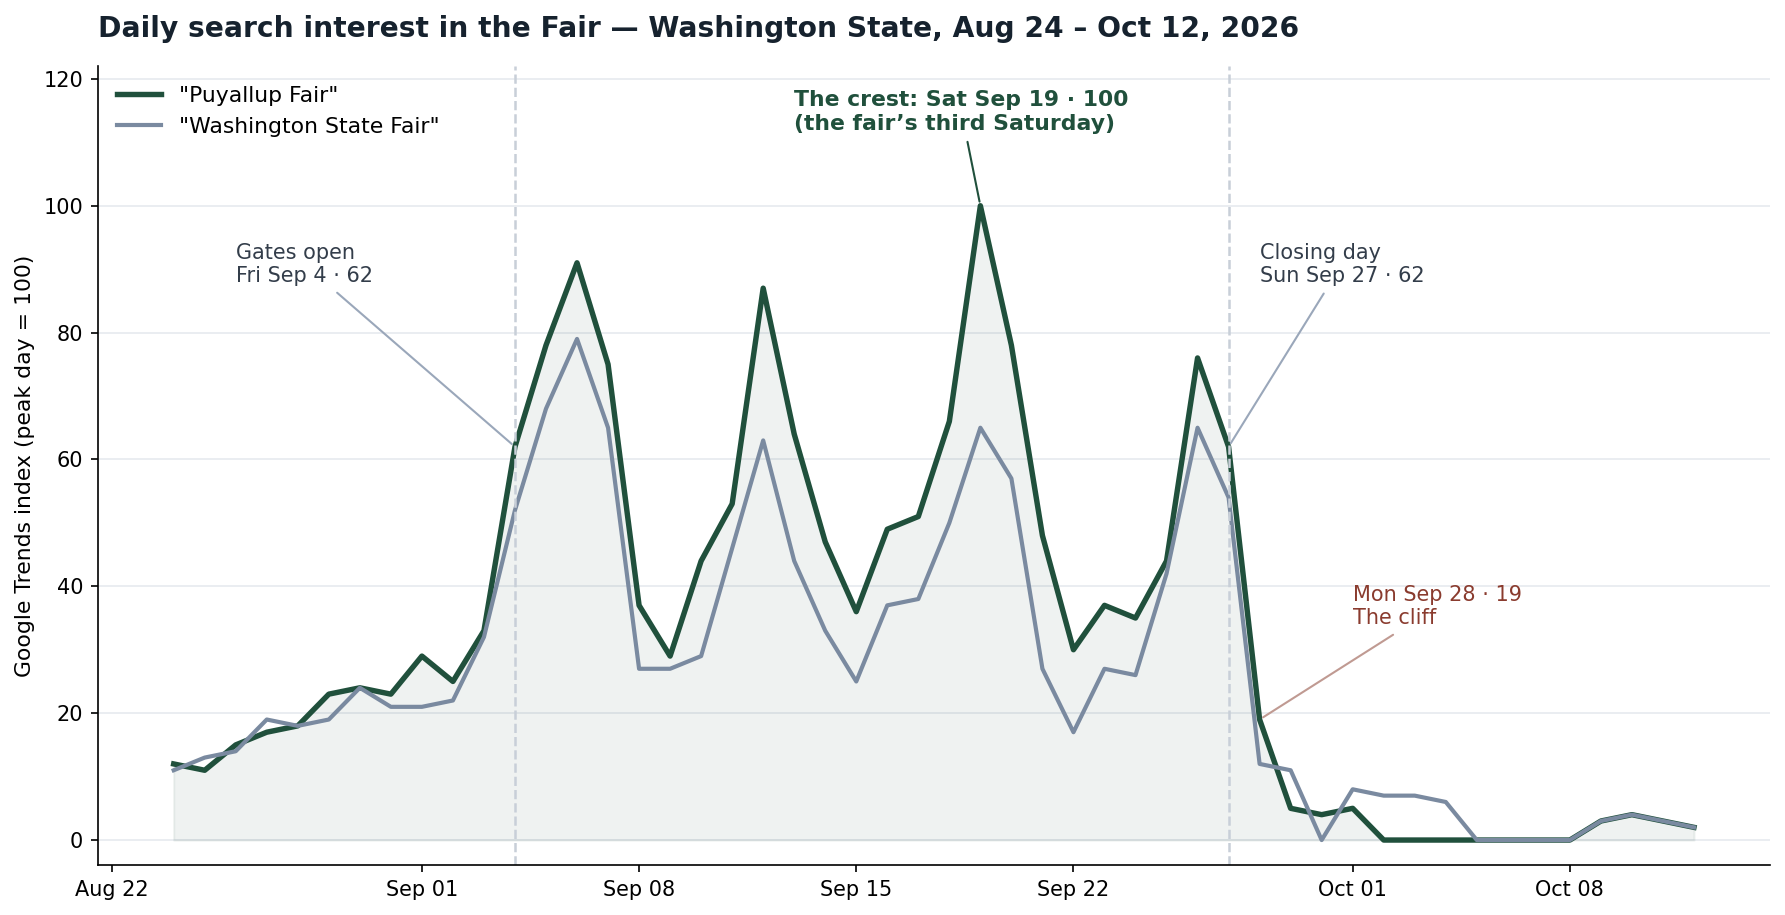
It is not a spike. It is a mesa.
Everyone pictures event attention as a spike: a surge at opening, a long decay. The fair’s search curve does something else. Weekly average interest during the run barely moves — 59.4 in week one, 55.3 in week two, 56.3 in week three, and 60.7 across the closing stretch. For twenty-four days, the fair is simply on: a plateau of attention at roughly triple the pre-fair baseline (the late-August average was 20.9), with the lowest single day of the entire run — a rainy-season Wednesday, September 9, at 29 — still sitting above that baseline.
A plateau changes the planning math. A spike rewards whoever shouts loudest on day one. A mesa rewards whoever is still findable, still accurate, still interesting on day seventeen.
The teeth: Saturdays, ascending
Riding on the plateau is a weekly rhythm with a clear beat. Across the fair’s run, weekend days averaged 79.5; weekdays averaged 46.4. The five biggest search days of the fair were all Saturdays and Sundays.
And the Saturdays climb. First Saturday, September 5: 78. Second, September 12: 87. Third, September 19: 100 — the single biggest search day of the entire fair. The closing Saturday, September 26, comes back to 76. The crest of the fair is not its opening. It is the third weekend — after two weeks of photos, scones, concert clips, and coworkers saying you have to go. Search interest in the fair is built by the fair: word of mouth, made visible.
Last year rhymes. In 2025’s search record, the peak day for “Puyallup Fair” was also a Saturday in the middle of the run — September 13 — not opening day. (Year-to-year levels can’t be compared directly; each pull is scaled to its own peak. But the shape repeating is the finding.) One year is an anecdote. Two is the start of a pattern worth planning around.
Two names, two curves
The fair has two names, and they behave differently. “Washington State Fair” — the official name — peaked early, at 79 on Sunday, September 6, opening weekend, and averaged 44.3 across the run. “Puyallup Fair” — the name people here actually use — averaged 57.5 and owned the crest. The formal name is how the fair is announced; the hometown name is how it is searched for once people are deciding to go. That split deserves its own installment, and it will get one.
The cliff
Then the fair ends, and the curve does the most honest thing in this whole dataset. Closing day, Sunday, September 27: 62 — still strong. Monday, September 28: 19. Tuesday: 5. By October 2: 0. The two weeks after closing average 3.0. There is no long tail, no nostalgic afterglow in search. The audience does not drift away from the fair; it is gone, the morning after, almost to zero.
That cliff is the most useful number in this series for a local business. It means the conversion window is the run itself — the reviews, the signups, the second invitation have to be captured while the mesa holds, because the day after closing there is no residual attention to harvest. October’s work, which the afterglow piece described, starts from an audience you kept, not one you can still reach.
What the shape tells a Puyallup business
- Plan for the third Saturday, not just opening day. The biggest search day of the fair is mid-run. Staffing, inventory, hours, and your best offer should peak when the curve does — September 19, not September 4.
- Weekends are the teeth. Search runs about 70% hotter on fair weekends than fair weekdays. If your public information is wrong anywhere, it is wrongest in effect on a Saturday.
- The mesa forgives a slow start. Interest holds level for three-plus weeks. A business that fixes its profile, photos, or hours in week two still catches most of the run. A spike would punish that; a mesa doesn’t.
- Capture during, because after is zero. The cliff is total. Whatever the fair is going to give you — reviews, names, regulars — it gives during the twenty-four days, or not at all.
Next in this series: the intent map — what those million visitors actually searched for, week by week, from parking to scones. The mesa is the shape. What flows across it is the story.
Methods: Google Trends daily data, geo = Washington State, pulled October 23, 2026 for the window August 24 – October 12, 2026; terms are exact search terms “Puyallup Fair” and “Washington State Fair.” Trends values are a relative index (peak = 100), not search counts. Separate pulls rescale to their own peaks, so the 2025 comparison is shape-only, and a separate June 2026 pull we ran was discarded for exactly that reason — levels from different pulls cannot be compared. Fair dates: September 4–27, 2026 (thefair.com). This is part one of “The Fair, in Search,” a Tygart Media case study; the companion piece is “The Fair Is Over. What Does a Million Visitors Leave Behind?”
Get The Signal
What we actually ran, what it measured, and what it means for a restoration shop — every week, including the flops.
Leave a Reply