Tag: Local SEO

  • Google Business Profile Optimization Sprint ($199)

    Google Business Profile Optimization Sprint ($199)

    Tygart Media / Content Strategy
    The Practitioner JournalField Notes
    By Will Tygart
    · Practitioner-grade
    · From the workbench

    What Is a GBP Optimization Sprint?
    A concentrated build-out of your Google Business Profile — the most underutilized local SEO asset most businesses have. Categories, services, attributes, description, weekly post schedule, photo strategy, and Q&A seeding configured correctly in one sprint. A fully optimized GBP improves local pack visibility, map rankings, and AI-generated local answer citations simultaneously.

    Most Google Business Profiles are 40% complete. One category selected. No services listed. No attributes configured. A description written in 2019. No posts in six months. No answered Q&A. This is common — and it’s a significant missed opportunity, because Google’s local pack algorithm weights GBP completeness directly.

    The GBP Optimization Sprint completes everything in one focused pass and sets up a sustainable weekly post cadence so the profile doesn’t go stale again.

    What the Sprint Covers

    • Category optimization — Primary and up to 9 secondary categories selected for maximum local pack coverage
    • Services listing — All services added with descriptions optimized for local search queries
    • Attribute configuration — All applicable attributes (payment methods, accessibility, certifications, amenities) enabled
    • Business description — 750-character keyword-rich description rewritten for local SEO
    • Q&A seeding — 5 high-value questions added and answered (reduces junk Q&A and signals completeness)
    • Photo strategy — Recommended photo types and naming convention for ongoing photo uploads
    • 4-week post calendar — First month of GBP posts written and scheduled (one per week)
    • NAP audit — Name, Address, Phone verification against your website and key directories

    Pricing

    Package Includes Price
    Sprint Full optimization, no posts $199
    Sprint + Posts Full optimization + 4-week post calendar written and scheduled $299
    Sprint + Posts + Schema Everything + LocalBusiness schema on your WordPress homepage $399

    Get Your Google Business Profile Fully Optimized

    Share your GBP URL (or business name and city) and your website URL. We’ll audit the current state and confirm scope within 1 business day.

    → will@tygartmedia.com

    Email only. No commitment to reply. Turnaround quoted within 1 business day.

    Frequently Asked Questions

    Do you need access to our Google Business Profile account?

    Yes — we need manager access to your GBP to make changes. You add us as a manager, we complete the sprint, and you remove access afterward if preferred.

    How quickly will GBP optimization improve local rankings?

    GBP changes are indexed quickly — most category and attribute updates reflect in local pack results within 1–2 weeks. Post activity and completeness improvements compound over 60–90 days.

    Does this work for service-area businesses without a storefront?

    Yes. Service-area businesses (no public address) are fully supported. We configure the service area correctly and hide the address per Google’s guidelines for SABs.


    Last updated: April 2026

  • Real Estate WordPress Checklist: 7 Post-Publish SEO Steps

    Real Estate WordPress Checklist: 7 Post-Publish SEO Steps


    Tygart Media — Real Estate Content Strategy

    The Real Estate Agent WordPress Post-Publish Checklist: 7 Steps Every Listing and Blog Post Needs

    By Tygart Media Updated: April 12, 2026
    Why real estate content needs a post-publish checklist: Real estate agents invest significant time in neighborhood guides, market reports, and buyer/seller process content. The optimization layer that determines whether a buyer finds that content — title tag, meta description, local entity references, schema, FAQ section — is almost never applied after publication. The 7-step post-publish checklist applies these signals to existing articles without rewriting content, converting published articles into optimized assets that rank for local buyer and seller queries.

    The 7-Step Real Estate WordPress Post-Publish Checklist

    1. Rewrite the title tag for buyer-stage search intent — Match how buyers actually phrase their search. “Oakwood Heights Neighborhood Guide” → “Living in Oakwood Heights: Schools, Market Conditions & What Buyers Need to Know.” Lead with the neighborhood name, include the most-searched aspect (schools or market), and stay within 50–60 characters. For market reports: “[Neighborhood] Real Estate Market Update: Q1 2026 Conditions for Buyers and Sellers.”
    2. Write a meta description that converts neighborhood searches to clicks — Delete the auto-generated excerpt. Write 140–155 characters specific to what a buyer searching that neighborhood actually wants: “Thinking about Oakwood Heights? Get school ratings, current median prices ($487K Q1 2026), commute times, and what locals love most. Talk to a local agent.” This is copy that converts — and it signals to Google that the article serves a buyer’s actual intent.
    3. Add named local entity references to the content — Inject 3–5 named geographic and institutional entities: the specific school names and district, the highway or transit reference, the MLS board for any market data, and the HOA name if applicable. If the article mentions “good schools,” rewrite to name the schools. If it mentions “easy freeway access,” name the freeway. Entity specificity is what separates genuine local expertise from generic real estate content.
    4. Add a neighborhood FAQ section with FAQPage schema — Write 6–8 questions targeting the buyer research phase for that specific neighborhood: “What schools serve [neighborhood]?”, “What is the median home price in [neighborhood]?”, “Is [neighborhood] a good investment?”, “How is the commute from [neighborhood] to downtown?” Add FAQPage JSON-LD schema alongside the visible FAQ section — both are required for People Also Ask eligibility and AI Overview citation.
    5. Add LocalBusiness schema connecting the article to the agent entity — Inject Article schema with the agent as author (with name, real estate license number if published, and brokerage affiliation) and LocalBusiness schema connecting the content to the agent’s geographic service area. This machine-readable entity connection is what AI systems use to associate neighborhood expertise with a specific local agent — turning a content citation into agent brand recognition.
    6. Set a visible Last Updated date with dateModified schema — Add “Last updated: [quarter, year]” near the article top, especially for market data content. Update the dateModified field in Article JSON-LD schema to match the actual content update date. Buyers and sellers actively check content freshness for market data — a 2023 market report seen in 2026 destroys credibility. Quarterly updates to the data section, with a visible date update, maintain the article’s authority and ranking freshness signals.
    7. Add internal links to and from neighborhood and service pages — Link from the neighborhood guide to your home valuation page (“Curious what your Oakwood Heights home is worth?”), your buyer consultation page, and any related neighborhood or market report. Then update those destination pages to link back to the neighborhood guide. Bidirectional internal linking establishes topical depth, guides buyers through the journey from research to contact, and passes authority between your highest-traffic content and your conversion pages.
    These 7 steps applied to your 10 highest-traffic neighborhood guides and market reports is the scope of WordPress content optimization for real estate agents through SiteBoost for real estate. Every step pushed live via WordPress REST API — your content unchanged, optimization infrastructure added.

    Frequently Asked Questions

    Which of the 7 steps has the highest impact for real estate agent content?

    Step 3 (named local entity injection) and step 4 (FAQPage schema) produce the fastest measurable results for real estate content. Named school district entities, specific transit references, and MLS board citations create the geographic entity depth that distinguishes genuine local expertise from generic content — the primary signal Google uses for local real estate rankings. FAQPage schema enables People Also Ask placement within 2–4 weeks for neighborhood-specific buyer questions. Step 1 (title tag rewrite) has the highest impact on click-through rate from existing search impressions — changing “Neighborhood Guide” to a buyer-intent title immediately improves organic CTR.

    Should real estate agents optimize all their articles or just the most important ones?

    Prioritize by neighborhood importance and existing traffic. Start with your primary farm neighborhoods — the areas where you do the most business and have the deepest knowledge. These guides have the highest ROI because you can write the most specific, authoritative content. Apply all 7 steps to these high-priority guides first. Then systematically work through secondary neighborhoods and market reports. New content published after the checklist is established should have all 7 steps applied at publication rather than retroactively — establishing the optimization habit at the point of creation.

    Does real estate content optimization require coding or developer access?

    No coding or developer access is required. Title tags and meta descriptions update through post fields or SEO plugin fields. Entity references and FAQ sections are text additions to existing content. FAQPage, LocalBusiness, and Article JSON-LD schema blocks are injected as HTML blocks in post content. The WordPress REST API handles all of these changes directly — no theme modifications, no plugin configuration, and no server access needed. The only setup requirement is a WordPress Application Password for REST API authentication, which any agent can generate from their WordPress admin panel in about 30 seconds.

    Sources: SLT Creative, “The Complete Step by Step Guide to Real Estate SEO” (February 2026); Digital Agent Club, “Real Estate Digital Marketing 2026” (November 2025); W3Era, “Real Estate SEO Guide for Agents & Brokers 2026”; Marketing LTB, “10 Best Real Estate SEO Agencies in 2026”
  • Real Estate Neighborhood Guide SEO: How to Outrank Zillow

    Real Estate Neighborhood Guide SEO: How to Outrank Zillow


    Tygart Media — Real Estate Content Strategy

    The Neighborhood Guide Formula That Beats Zillow in Local Search

    By Tygart Media Updated: April 12, 2026
    Why neighborhood guides are the agent’s unfair advantage: Zillow has a neighborhood page for every zip code in the country. What Zillow cannot have is genuine local knowledge — the specific school attendance boundaries, the commute reality from a particular subdivision, the difference in HOA rules between two adjacent communities, the coffee shop that became a neighborhood anchor, the planned development that will change the character of the area. An agent who writes neighborhood guides from this knowledge builds content that national portals fundamentally cannot replicate.

    The Five Elements of a Neighborhood Guide That Ranks and Converts

    1. Named School District and School Entities

    School district information is the most searched real estate entity after price. According to DMR Media’s 2026 real estate keyword strategy, “[School District] real estate” and “best school districts in [area]” are among the highest-intent, lowest-competition keywords available to local agents. A neighborhood guide that names the specific elementary school, middle school, and high school serving the neighborhood — not just “good schools” — creates the named entity anchors that Google uses to determine whether a real estate article represents genuine local expertise. Zillow’s neighborhood page says “good schools.” Your guide names Lincoln Elementary, Jefferson Middle, and Washington High.

    2. Commute Corridor and Transit References

    Buyers considering a neighborhood research commute viability before almost anything else. A neighborhood guide that references the specific highway corridor (I-90, US-41, SR-520), the transit line or bus route, the park-and-ride location, and realistic commute times to the major employment centers in the region provides information that is both genuinely useful and highly entity-specific. These geographic entity references signal local authority to both Google and AI systems evaluating whether real estate content represents authentic market knowledge.

    3. Current Market Context With MLS References

    A neighborhood guide without current market data is a tourism article, not a real estate resource. Include: current median sale price, average days on market, list-to-sale price ratio, months of supply, and whether the neighborhood is in a buyer’s or seller’s market. Reference the MLS board (NWMLS, MRED, BRIGHT, etc.) as the data source. Update this data quarterly — the visible Last Updated date and dateModified schema signal content currency to both buyers and Google’s quality evaluators.

    4. FAQPage Schema Targeting Neighborhood-Specific Questions

    Every neighborhood guide should have a FAQ section targeting the questions buyers ask when evaluating that specific neighborhood: “What schools serve [neighborhood]?”, “Is [neighborhood] a good investment?”, “What is the commute from [neighborhood] to [downtown]?”, “Is [neighborhood] walkable?”, “What is the HOA in [neighborhood]?” With FAQPage JSON-LD schema, these Q&A pairs are eligible for People Also Ask placements — appearing above organic results when buyers search these neighborhood-specific queries.

    5. Speakable Blocks for AI Citation

    According to Digital Agent Club’s 2026 real estate digital marketing analysis, one agent who added schema and 15 conversational FAQs to their top 20 neighborhood pages started appearing in AI summaries and picked up three extra buyer consultations in the first month. The mechanism: buyers increasingly ask AI assistants “what is [neighborhood] like?” before they search Google. A neighborhood guide with speakable blocks — direct answers to “what is [neighborhood] known for?” and “what are the schools like in [neighborhood]?” — earns AI citations at the moment of neighborhood evaluation.

    What makes a real estate neighborhood guide rank above Zillow’s neighborhood pages?
    Real estate neighborhood guides rank above Zillow for hyper-local queries when they contain: named school entities (specific elementary, middle, and high school names and district), geographic entity references (highway corridors, transit lines, named local landmarks), current market data with MLS board attribution (median price, days on market, inventory), FAQPage schema targeting neighborhood-specific buyer questions, and speakable blocks for AI citation. These named entity signals are the specific local knowledge that national portals cannot replicate at scale — and they are exactly what Google and AI systems use to distinguish authentic local expertise from generic directory content.
    Named school district entities, commute corridor references, FAQPage schema, and speakable blocks are the four GEO optimization layers in WordPress content optimization for real estate agents through SiteBoost. Applied to your existing neighborhood guides to give them the entity depth to win the hyper-local queries Zillow can’t match.

    Frequently Asked Questions

    How long should a real estate neighborhood guide be?

    Long enough to be genuinely useful — typically 800–1,200 words — but never padded. The five elements (school entities, commute data, market context, FAQ section, and local amenity references) provide the content depth needed without requiring padding. A 900-word guide that answers specific questions with named entities and current market data outperforms a 2,000-word guide that says “great neighborhood for families” twelve times. Structure matters more than word count: definition box, section headings, market data table, and FAQ section with schema is the framework.

    How often should neighborhood guides be updated?

    Market data section quarterly at minimum — median prices, days on market, and market condition (buyer’s vs. seller’s) change enough that annual updates are insufficient for credibility. School enrollment information annually. The visible Last Updated date matters: a neighborhood guide showing “Last updated: Q1 2026” with a quarterly market data refresh signals editorial stewardship that earns both buyer trust and Google trust. School district boundaries and HOA information should be verified annually — these change less frequently but carry high stakes for buyers relying on the information.

    Should real estate agents write neighborhood guides for every area they serve?

    One genuinely authoritative guide per neighborhood you actively farm beats thin coverage of every zip code in your service area. The quality standard: could you write 600+ words of genuinely specific, locally accurate content about this neighborhood, including named schools, specific commute corridors, current market data, and what makes this neighborhood distinctly different from adjacent areas? If yes, write the guide. Thin neighborhood guides with no named entities and no market data actively hurt your site’s overall quality signals — and are outranked by Zillow’s generic pages anyway.

    Sources: DMR Media, “Real Estate Keywords: A Strategic Guide for Agents 2026”; Digital Agent Club, “Real Estate Digital Marketing 2026” (November 2025); SLT Creative, “The Complete Step by Step Guide to Real Estate SEO” (February 2026); HousingWire, “The Ultimate Guide to Real Estate SEO for Agents in 2026” (January 2026)
  • Local SEO for Restoration Companies: Beat Aggregators

    Local SEO for Restoration Companies: Beat Aggregators

    Tygart Media — Restoration Content Strategy

    Local SEO for Restoration Companies: The Content Strategy That Beats the Big Aggregators

    By Tygart Media Updated: April 12, 2026
    The aggregator problem: HomeAdvisor, Angi, Thumbtack, and Yelp dominate generic restoration searches — “water damage restoration near me,” “restoration company [city].” These platforms have domain authority that independent contractors cannot match on generic terms. The content strategy that beats them is the same one that beats Zillow in real estate: hyper-local content that aggregators cannot replicate because they don’t know your market the way you do.

    Why Aggregators Can’t Own the Local Queries That Convert Best

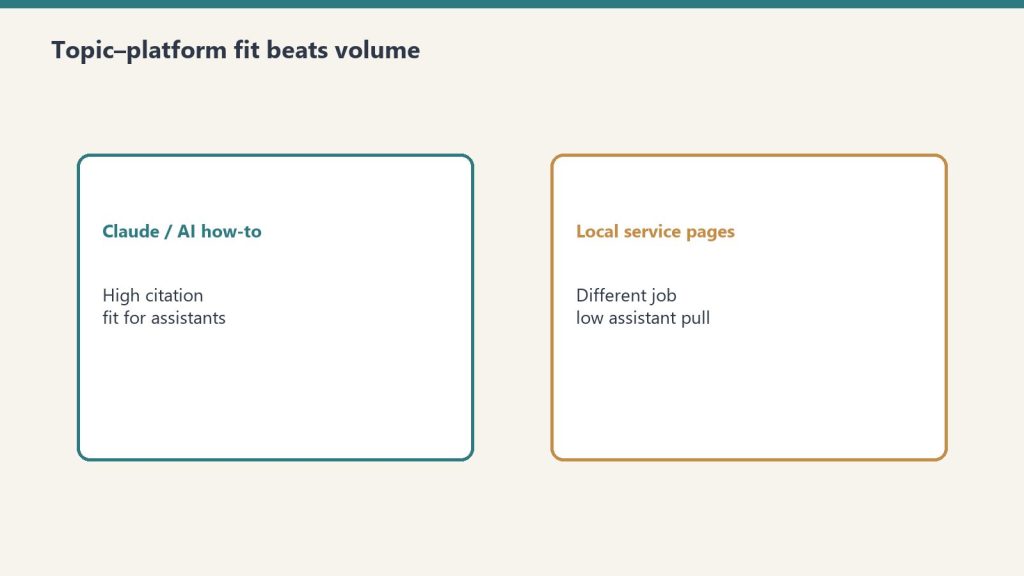
    Comparison of Claude how-to fit versus local service page fit for assistants
    Why aggregators can’t own the local queries that convert best.

    Aggregator platforms rank for generic, high-volume terms. They cannot rank for hyper-local, service-specific queries that require genuine local knowledge. “Water damage restoration companies near me” — HomeAdvisor wins that. “What to do if my basement floods in [specific neighborhood]” or “sewage backup cleanup contractor [specific zip code]” — these are queries where a local contractor’s content can win, and they convert at higher rates because they’re more specific.

    The restoration companies that build topical authority through hyper-local content — neighborhood-specific service area pages, local weather and flood risk content, municipality-specific permit and code content — create a content moat that aggregators cannot replicate because they lack the local knowledge to write it convincingly.

    How can restoration companies compete with HomeAdvisor and Angi in local search? Restoration companies compete with HomeAdvisor and Angi by targeting hyper-local queries that aggregators cannot rank for: neighborhood-specific service content (“basement flood cleanup in [neighborhood name]”), municipality-specific permit and code references for restoration work, local weather and infrastructure risk content (“why [city] homes are susceptible to sump pump failure”), and service-specific long-tail queries with local modifiers. Aggregators dominate generic terms; local contractors own hyper-local and process-specific queries that require genuine market knowledge.

    Three Content Types That Beat Aggregators Consistently

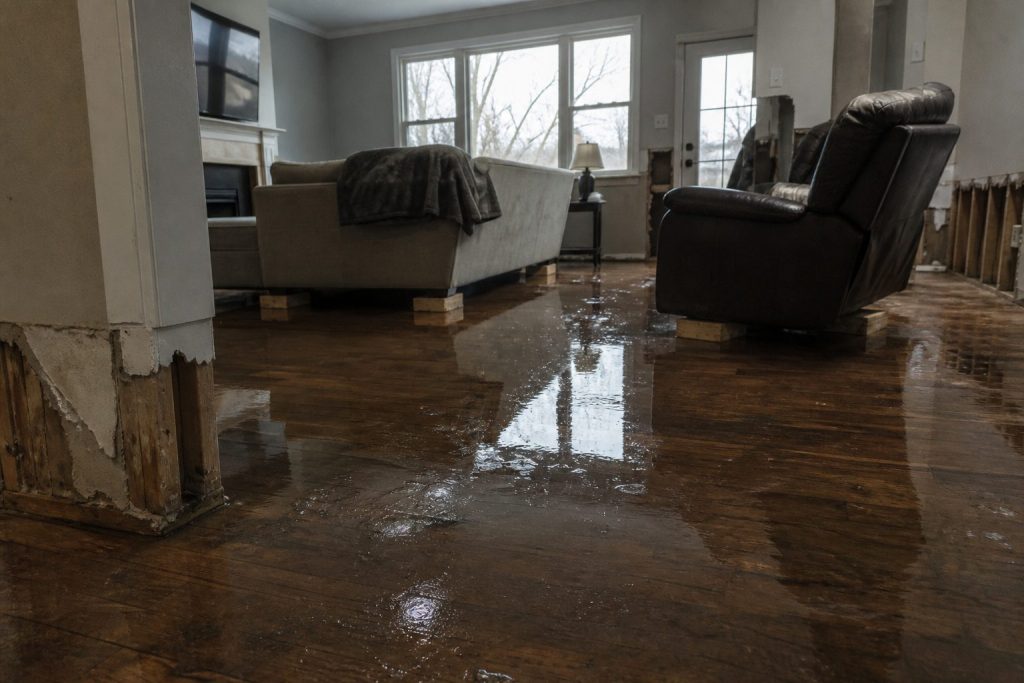
    Flooded residential living room with standing water on hardwood after a water loss
    Three content types that beat aggregators consistently.

    1. Neighborhood-Specific Service Content

    A dedicated article or page for each primary service area neighborhood — not just a city — with specific local references: the age and construction type of housing stock in that area (older homes with clay tile sewer laterals vs newer homes with PVC), common water damage causes specific to the geography (proximity to a flood plain, sump pump dependency in areas with high water tables), and local infrastructure that affects restoration timelines (permit requirements for drywall removal, local inspection protocols). HomeAdvisor has a landing page for your city. You can have a genuinely informative article for every neighborhood you serve.

    2. Local Risk and Prevention Content

    Weather events, aging infrastructure, and local building characteristics create specific restoration risk patterns that vary by market. An article titled “Why [City] Homes Get Basement Flooding After Spring Rain” — referencing local topography, the combined sewer system that causes backup events in specific zip codes, and the age of housing stock in affected neighborhoods — is content that only a contractor who actually works that market can write authoritatively. This is E-E-A-T through genuine local experience, and it’s exactly what AI systems recognize as locally authoritative content.

    3. Process Content With Local Code References

    Restoration permit requirements, local inspection protocols, and municipality-specific code provisions vary by jurisdiction. An article explaining “Do You Need a Permit for Water Damage Restoration in [City]?” — with the actual answer for your market, the permit threshold (square footage of drywall removal, extent of structural work), and the typical inspection timeline — is content that serves homeowners, builds local authority, and is completely outside what a national aggregator can provide.

    The Entity Set for Local Restoration Authority

    Desk with laptop, checklist notebook, and billing card ready before creating an Anthropic API key
    The entity set for local restoration authority.

    Beyond IICRC and RIA, local restoration authority requires geographic entity injection: named neighborhoods and service area communities, local watershed and drainage authority references where applicable, municipality names, specific local weather events that create restoration demand, and named local building code authorities. These geographic entities are the signals Google and AI systems use to determine whether a restoration contractor truly serves and understands a local market versus claiming a service area on a directory profile.

    Geographic entity injection and local content structuring are part of the GEO layer in WordPress content optimization for restoration companies through SiteBoost — applied to your existing service area and neighborhood content to build the local topical authority that aggregators can’t match.

    Related on Tygart Media: blog SEO · Twin Cities water damage SEO · property damage SEO.

    Frequently Asked Questions

    How many service area pages should a restoration company have?

    A dedicated page for each primary service city or neighborhood you actively serve and have genuine local knowledge about. The quality standard is: could you write 300+ words of genuinely specific, locally-relevant content about restoration work in this area? If yes, the page is worth creating. Generic “We serve [city]” pages with no local-specific content do not build topical authority and may actually dilute your overall site quality signals. Depth per location beats breadth of thin location pages.

    What local entities matter most for restoration company SEO?

    Named neighborhoods and communities within your service area, local watershed and drainage authority names (relevant for flood and backup content), municipality names paired with specific services, local housing stock characteristics (age, construction type, common infrastructure issues), and references to local weather patterns or infrastructure events that create restoration demand. Geographic specificity — naming specific streets, neighborhoods, or local landmarks — is the entity signal that separates genuine local expertise from claimed service area coverage.

    How does local content help restoration companies compete in AI search?

    AI systems evaluating restoration content for hyper-local queries — “basement flood cleanup [neighborhood]” or “sewage backup contractor [zip code]” — favor content with genuine geographic entity depth over generic service descriptions. A restoration company article that references specific local geography, housing stock characteristics, and infrastructure context is treated as locally authoritative by AI systems in a way that a national aggregator’s generic city page cannot match. Local entity injection is both a Google local SEO signal and an AI citation signal for geographically-specific restoration queries.

    Sources: Aziel Digital, “Water Damage SEO Secrets: How Restoration Companies Rank #1” (2026); Blueprint Digital, “Water Damage Restoration SEO” (2026); Whitespark Local Search Ranking Factors (2025); The RMG, “Local SEO for Restoration Companies” (2025)
  • Real Estate SEO: WordPress & AI Optimization for Agents

    Real Estate SEO: WordPress & AI Optimization for Agents

    SiteBoost — Vertical Series

    SiteBoost for Real Estate: WordPress SEO, AEO & AI Optimization for Agents, Brokerages & Property Companies

    By Tygart Media — This page is built using the same SEO, AEO, and GEO techniques applied through SiteBoost. The hyper-local entity injection, schema structure, and speakable blocks you see here are exactly what the service delivers to your real estate WordPress content.

    Real Estate WordPress Content Optimization: The process of applying SEO, AEO (Answer Engine Optimization), and GEO (Generative Engine Optimization) to a real estate agent or brokerage’s existing WordPress blog posts — injecting hyper-local market entities, neighborhood-specific data references, and buyer/seller question schema so the agent ranks in Google, wins People Also Ask placements for property queries, and gets cited by ChatGPT and Perplexity when buyers ask neighborhood and market questions that previously sent leads to Zillow and Realtor.com.

    The Zillow Problem: You Know the Market. They Get the Lead.

    The fundamental real estate SEO paradox:
    Zillow, Realtor.com, and Redfin built their domain authority by publishing the hyper-local market content that agents were too busy to write. Now those portals charge agents $20–$100+ per lead for buyers who found the listing on a portal built from the agent’s own market. A well-optimized WordPress blog — neighborhood guides, market reports, buyer process content — is how agents win those leads back directly, at zero cost per click.

    Real estate SEO delivered an estimated 1,389% ROI in 2025, with agents typically breaking even after just ten months of consistent optimization. The keyword “real estate agent near me” carries a $100 CPC on Google Ads. Every buyer who finds you through your WordPress blog instead of a paid ad is a $100+ savings — and every buyer who finds you instead of Zillow is a lead that doesn’t cost a referral fee.

    How can real estate agents compete with Zillow and Realtor.com in search?
    Real estate agents compete with national portals by targeting hyper-local content that portal algorithms can’t personalize: neighborhood-specific buyer guides (“What is it like to live in [neighborhood]?”), school district breakdowns, micro-market condition reports, and process-oriented content (“How long does escrow take in [state]?”). National portals rank for generic search terms. Local agents can own the long-tail, hyper-local queries that convert buyers already committed to a specific area — queries portals can’t serve as well as someone who actually sells there.

    The Four Real Estate Content Types SiteBoost Optimizes

    Neighborhood Guides

    Hyper-Local Authority Content

    The highest-converting real estate content type. SiteBoost injects neighborhood entities — school district names, HOA references, commute corridors, local amenities — and adds FAQPage schema targeting “what is [neighborhood] like?” queries that send buyers to portals instead of you.

    Market Reports

    Data-Driven Authority

    Monthly or quarterly market update posts with median price, days on market, absorption rate, and inventory references. SiteBoost structures these for AI citation — when buyers ask ChatGPT about market conditions in your area, your content becomes the sourced answer.

    Buyer & Seller Guides

    Process Content

    Step-by-step guides to buying or selling in your market. SiteBoost adds HowTo schema, FAQPage targeting process questions (“How long does closing take?”, “What does due diligence mean?”), and speakable blocks for voice search and AI Overview capture.

    Comparative Market Analysis

    Decision-Stage Content

    Content comparing neighborhoods, price ranges, or property types. SiteBoost adds RealEstateListing and LocalBusiness schema, comparison table formatting for featured snippet capture, and entity injection for the specific geographic entities Google uses to evaluate local authority.

    The Real Estate Entity Set That Wins Local Authority

    What named entities should real estate WordPress content include for local SEO and AI citation?
    Real estate content optimized for local authority and AI citation should reference: named school districts and specific school names (the single most searched real estate entity after price), MLS board affiliations (NAR — National Association of Realtors, state and local association memberships), transaction terminology (escrow, title insurance, due diligence period, earnest money deposit, contingency, appraisal gap), market data terminology (median sale price, days on market, months of supply, absorption rate, list-to-sale ratio), and financing references (conforming loan limits, FHA loan thresholds, VA loan eligibility, debt-to-income ratio). Geographic precision — naming specific neighborhoods, zip codes, school attendance zones, and commute corridors — is the most powerful entity signal for local real estate SEO.

    Hypothetical Before & After: A Real Estate WordPress Neighborhood Guide

    This illustrates what SiteBoost applies to a typical real estate neighborhood guide — the highest-value content type for agents, and almost universally underoptimized:

    Before SiteBoost
    Title: “Living in Oakwood Heights — What You Need to Know”

    Meta: Empty — auto-generated from first paragraph

    Word count: 480 words

    Local entities: Neighborhood name mentioned 6x — no school district names, no commute corridor, no HOA reference, no median price range

    FAQ section: None

    Schema: None

    AI visibility: Zero — when buyers ask ChatGPT “what is Oakwood Heights like?”, Zillow’s neighborhood page gets cited, not yours

    After SiteBoost
    Title: “Living in Oakwood Heights: Schools, Market Conditions & What Buyers Need to Know”

    Meta: “Thinking about Oakwood Heights? Get school district ratings, current median prices, commute times, and what residents love most about this neighborhood.” (158 chars)

    Word count: 950 words (definition block + FAQ added)

    Local entities: Named elementary, middle, and high school; school district; specific highway and transit references; HOA structure note; median price range with MLS data context; named local amenities

    FAQ section: 7 questions — “What schools serve Oakwood Heights?”, “Is Oakwood Heights a good investment?”, “What is the median home price?”, “How long does it take to commute downtown?” — all PAA targets

    Schema: FAQPage + LocalBusiness JSON-LD injected

    AI visibility: 2 speakable blocks targeting “what is Oakwood Heights like?” and “are the schools good in Oakwood Heights?”

    The AI Opportunity: Buyers Ask ChatGPT Before They Call an Agent

    Real estate buyers and sellers now begin their search in AI assistants. “What neighborhoods are best for families near downtown Austin?” “How competitive is the Denver real estate market right now?” “What does it mean if a house has been on the market for 60 days?” These questions are being asked of ChatGPT, Perplexity, and Google AI Overviews — and the agents whose WordPress content provides the most structured, entity-rich, direct-answer responses are the ones getting cited as authoritative sources.

    According to AEO research data, prospects who discover agents through AI-cited content convert 60% faster than those arriving through traditional search — they arrive pre-qualified and pre-trusting, having already consumed your expertise through an AI answer.

    SiteBoost Pilot for Real Estate: What You Get

    Deliverable Details
    Site Connection & Audit WordPress REST API connection, full content inventory, neighborhood content gap map, schema coverage report, hyper-local entity gap analysis, Before Baseline Report
    10 Post Optimizations Full SEO + AEO + GEO on 10 highest-opportunity articles — neighborhood entity injection, school district references, FAQPage + LocalBusiness schema, speakable blocks, market data context
    60-Day Impact Report Before vs. after: rankings for local queries, PAA placements, AI citation visibility, lead-stage keyword movement
    Content priority strategy Neighborhood guides first — highest local authority value, hardest for portals to replicate, most likely to surface in AI responses about specific areas
    Price $597 pilot — $767 value

    Interested in the SiteBoost Pilot for Your Real Estate Site?

    We onboard sites personally. Email Will with your site URL and he’ll follow up within one business day.

    → Email Will — Start the Pilot

    Email only. No sales call required. No commitment to reply.

    Frequently Asked Questions: SiteBoost for Real Estate

    How does SiteBoost help real estate agents compete with Zillow and Realtor.com?

    National portals dominate generic real estate searches but cannot replicate the hyper-local expertise of an agent who actually sells in a neighborhood. SiteBoost optimizes the content type portals can’t match: neighborhood guides with named schools, specific commute corridors, HOA structures, and micro-market conditions. These hyper-local articles, properly optimized with FAQPage schema and geographic entity injection, rank for the long-tail searches buyers use when they’re committed to a specific area — the highest-converting real estate queries, and the ones where a local agent beats a national portal every time.

    What real estate schema markup does SiteBoost inject?

    For real estate WordPress content, SiteBoost injects FAQPage schema targeting buyer and seller process questions, LocalBusiness schema connecting content to the agent or brokerage entity, and HowTo schema for process-oriented content (how to make an offer, how to negotiate inspection repairs, how to understand a title commitment). For neighborhood and location content, geographic entity markup is injected to connect the article to specific named places Google’s knowledge graph recognizes — school districts, city boundaries, transit corridors.

    How does AEO optimization help real estate agents win People Also Ask placements?

    People Also Ask for real estate searches is dominated by process and local questions: “What is earnest money?”, “How long does closing take?”, “What schools serve [neighborhood]?”, “Is [city] a buyer’s or seller’s market?” A FAQPage schema block with 6–8 of these questions, structured with direct 40–60 word answers, positions your article for PAA placements that appear above organic listings. These placements are particularly valuable in real estate because they’re triggered by the exact questions buyers ask during active home search — capturing attention at the highest-intent moment.

    Should real estate agents optimize blog posts or listing pages first?

    Blog posts — specifically neighborhood guides and buyer/seller process content. Listing pages have short lifespans (the listing sells) and are largely commoditized across IDX feeds. Blog posts compound indefinitely. A neighborhood guide written and optimized today continues driving organic traffic and AI citations for years, regardless of what’s currently listed. SiteBoost focuses exclusively on evergreen WordPress post content — not IDX listing pages, which fall outside our scope.

    Can SiteBoost help with real estate content for specific cities and neighborhoods?

    Yes — geographic entity injection is one of SiteBoost’s core GEO optimization techniques. For each neighborhood guide or market report, we inject the specific named entities that establish local authority: school district names, named schools, transit lines, highway corridors, HOA names where relevant, and local landmark references. This geographic specificity is the primary signal Google and AI systems use to determine whether a real estate article represents genuine local expertise or generic content.

    What real estate WordPress sites does SiteBoost work with?

    SiteBoost works with any self-hosted WordPress installation used for real estate blogging: agent personal sites, brokerage websites, team sites, and property investment blogs. We work with any WordPress theme or page builder — IDX plugin configurations are not affected. The only requirement is that WordPress REST API is enabled, which it is by default. Zillow Premier Agent websites, Realtor.com profiles, and hosted MLS sites are not WordPress and therefore not compatible.

  • Types of Radon Mitigation Systems: A Complete Home Guide

    Types of Radon Mitigation Systems: A Complete Home Guide

    The Distillery
    — Brew № 1 · Radon Mitigation

    There is no single radon mitigation system. There are six primary system types, each designed for specific foundation conditions — and most homes with elevated radon require one primary method plus supplemental sealing. Knowing which system type applies to your home’s foundation eliminates confusion about what a contractor is proposing and whether the approach matches your situation.

    1. Active Sub-Slab Depressurization (ASD)

    Active Sub-Slab Depressurization is the most widely installed radon mitigation system in the United States. It is the standard approach for slab-on-grade homes and basement homes with concrete slab floors.

    How ASD Works

    A suction pipe penetrates the concrete slab, connecting to the aggregate or soil layer beneath. A continuously running electric fan draws air (and with it, radon) from beneath the slab, routing it through PVC pipe to discharge above the roofline. This creates negative pressure in the sub-slab zone relative to the home’s interior — preventing radon from finding pathways through cracks, joints, and penetrations into the living space.

    ASD Applications

    • Slab-on-grade homes (full footprint slab, no basement)
    • Basement homes with concrete slab floors
    • Homes with both a basement and upper-level slab additions
    • Garage slabs connected to the main living area slab

    ASD Governing Standard

    AARST-ANSI SGM-SF (Standard of Practice for Mitigation of Radon in Schools and Large Buildings, adapted for single-family) governs ASD installation requirements including diagnostic testing, pipe sizing, fan placement, and performance verification.

    2. Active Sub-Membrane Depressurization (ASMD)

    Active Sub-Membrane Depressurization is the crawl space equivalent of ASD. Instead of drilling through concrete, the system creates negative pressure beneath a vapor barrier (membrane) installed over the crawl space soil.

    How ASMD Works

    A heavy-duty polyethylene vapor barrier (minimum 6-mil; professional installations use 10–20 mil) is installed across the entire crawl space floor, lapped up foundation walls, and sealed at all edges and penetrations. A suction pipe penetrates the barrier and connects to the soil or aggregate below via a perforated collection mat. The fan draws soil gas from beneath the barrier, routing it above the roofline through the same type of PVC pipe system used in ASD.

    ASMD Requirements

    • Foundation vents must be sealed — open vents allow outdoor air into the crawl space, defeating the sub-membrane vacuum
    • Barrier seams must be lapped (minimum 12″ overlap) and taped
    • Multiple suction points are often needed — crawl spaces typically require 2–4 collection points versus the 1–2 typical in ASD installations
    • AARST-ANSI RMS-LB governs ASMD installation standards

    3. Drain-Tile Depressurization

    Many basement homes — particularly those built after 1980 — were constructed with a drain-tile system: a perforated pipe network running around the interior or exterior perimeter of the foundation, at or below the footing level, designed to channel groundwater to a sump pit. This drain tile can serve as a highly effective radon collection network.

    How Drain-Tile Depressurization Works

    When a sump pit is present and the drain tile is functional, the mitigator creates suction at the sump pit — either by sealing the pit with an airtight lid and connecting a fan, or by installing a dedicated suction pipe into the drain tile network. Because the drain tile runs around the full foundation perimeter, a single suction point at the sump can create negative pressure across a very large area — often the entire foundation footprint without any slab drilling.

    Advantages Over Standard ASD

    • No slab drilling required (the drain tile network is already in place)
    • Often achieves better sub-foundation coverage than a single slab core hole
    • Sump pit is already present — lid modification is the primary work
    • Lower installation cost when drain tile is accessible

    Limitations

    • Requires a confirmed functional drain-tile system — older or poorly maintained tile may be silted or blocked
    • Not present in all homes — many older homes and slab-on-grade construction have no drain tile
    • May need to be supplemented with slab suction point(s) if tile coverage is incomplete

    4. Block-Wall Depressurization

    Concrete masonry unit (CMU) block foundation walls have hollow cores that communicate directly with the soil — a significant secondary radon entry pathway in older homes. Block-wall depressurization addresses this specifically.

    How Block-Wall Depressurization Works

    Small holes (2″–3″ diameter) are drilled through the interior face of the CMU block wall, typically just above the slab level, at 6–8 foot intervals around the affected perimeter. PVC pipe connects these holes, manifolding into the main ASD fan system or a dedicated fan. The fan draws radon from inside the block core cavities before it can migrate through mortar joints and wall cracks into the basement air.

    When Block-Wall Depressurization Is Needed

    • Post-mitigation testing still shows levels above 4.0 pCi/L after standard ASD is installed
    • Visual inspection reveals significant efflorescence, spalling, or moisture infiltration through block walls (indicating active soil gas pathways)
    • Home is pre-1975 CMU construction with no poured concrete wall facing

    Block-wall depressurization is almost always an add-on to ASD, not a standalone system. Cost: $300–$600 in additional materials and labor when added to an existing ASD installation.

    5. Heat Recovery Ventilator (HRV) or Energy Recovery Ventilator (ERV)

    HRV and ERV systems are whole-house mechanical ventilation systems that exchange stale indoor air with fresh outdoor air while recovering heat (HRV) or both heat and moisture (ERV). They are sometimes used as a radon reduction strategy — primarily in situations where other methods are impractical or as a supplemental approach.

    How HRV/ERV Reduces Radon

    By continuously introducing fresh outdoor air into the home, HRV/ERV dilutes indoor radon concentrations. They also reduce the negative pressure differential that draws radon into the home from the soil, because they balance indoor and outdoor pressure rather than allowing the home to depressurize relative to the soil.

    Limitations as Radon Mitigation

    • Less reliable reduction than ASD/ASMD — radon dilution depends on outdoor air exchange rate, and results vary significantly by climate and home tightness
    • Higher operating cost — HRV/ERV units consume 100–400 watts versus 20–90 watts for a radon fan
    • Does not address the root cause (radon entry from soil) — only dilutes after entry
    • Not accepted as primary mitigation in all state radon programs
    • Best suited as supplemental to ASD in homes where additional air quality improvement is also desired

    EPA and AARST consider ASD/ASMD the preferred primary mitigation method. HRV/ERV may be appropriate as supplemental mitigation or in unusual foundation situations where ASD is genuinely impractical.

    6. Natural Ventilation Enhancement

    Natural ventilation — opening windows, operating exhaust fans, increasing air exchange — can temporarily reduce radon concentrations. It is not a mitigation system and is not recommended by EPA or AARST as a radon control strategy for several reasons:

    • Effective only while windows are open — unpractical in most U.S. climates for the majority of the year
    • Increases heating and cooling costs significantly
    • Can create negative pressure that worsens radon entry
    • Provides no permanent solution

    Natural ventilation may be used as a short-term measure while a permanent system is being installed, but it is not a substitute for ASD, ASMD, or other mechanical systems.

    Choosing the Right System: Decision Guide

    Foundation Type Primary System Common Add-On
    Slab-on-grade ASD Sealing (cracks, joints)
    Basement — poured concrete ASD Drain-tile depressurization if sump present
    Basement — CMU block walls ASD Block-wall depressurization
    Crawl space — vented ASMD (with encapsulation) Foundation vent sealing
    Crawl space — encapsulated ASMD Additional suction points if needed
    New construction (RRNC) Passive pipe (fan-ready) Fan activation if post-construction test elevated
    Combination foundation ASD + ASMD (separate systems or manifolded) Sealing at transition zones

    Frequently Asked Questions

    What is the most common type of radon mitigation system?

    Active Sub-Slab Depressurization (ASD) is the most commonly installed radon mitigation system in the U.S. It applies to slab-on-grade and basement homes — the two most prevalent residential foundation types. For crawl space homes, Active Sub-Membrane Depressurization (ASMD) is the standard.

    Can one system work for multiple foundation types in the same home?

    Yes, but it typically requires separate or manifolded systems. A home with a basement and a slab-on-grade addition, for example, may need ASD suction points in both zones, connected to a single fan via manifold pipe — or two separate fans if the zones are not contiguous. An experienced mitigator will design for the full footprint, not just the primary foundation type.

    Does the type of radon system affect the cost?

    Yes, significantly. A standard single-point ASD in a poured concrete basement is the least expensive ($800–$1,500). Adding drain-tile depressurization at the sump typically adds $100–$300. Block-wall depressurization adds $300–$600. ASMD with full crawl space encapsulation can run $2,500–$5,000+ depending on crawl space size and membrane quality.

    What type of radon system works in a home with no basement and no crawl space?

    Slab-on-grade homes use ASD — a suction pipe drilled through the concrete slab connects to the aggregate beneath. Interior routing typically runs through a garage wall or utility closet to the attic. Exterior routing is an alternative when interior access is limited. The challenge in slab homes is pipe routing to above the roofline without a basement or crawl space to work through — but it is fully achievable in almost all cases.

    What is the difference between ASD and ASMD?

    Both use a fan to create negative pressure below the home’s floor system. ASD drills through a concrete slab and draws suction from the sub-slab aggregate or soil. ASMD installs a vapor barrier over the crawl space soil and draws suction from beneath the barrier — no concrete is present to drill through. The fan, pipe, and discharge components are identical; only the suction connection method differs.

  • Your SEO Work Is Subsidizing Your Google Ads (Here’s the Mechanism)

    Your SEO Work Is Subsidizing Your Google Ads (Here’s the Mechanism)

    Tygart Media / Content Strategy
    The Practitioner JournalField Notes
    By Will Tygart · Practitioner-grade · From the workbench

    There’s a common misconception among local service businesses that SEO and Google Ads are completely separate efforts. Google keeps the organic results and the paid results in separate legal buckets — advertisers can’t pay to influence organic rankings, and organic performance doesn’t directly move ad spend.

    But that’s not the full picture. There’s a mechanism called Quality Score, and it sits squarely at the intersection of SEO work and what you actually pay per click. Understanding it changes how you think about both investments.

    What Quality Score Is and Why It Controls Your Ad Costs

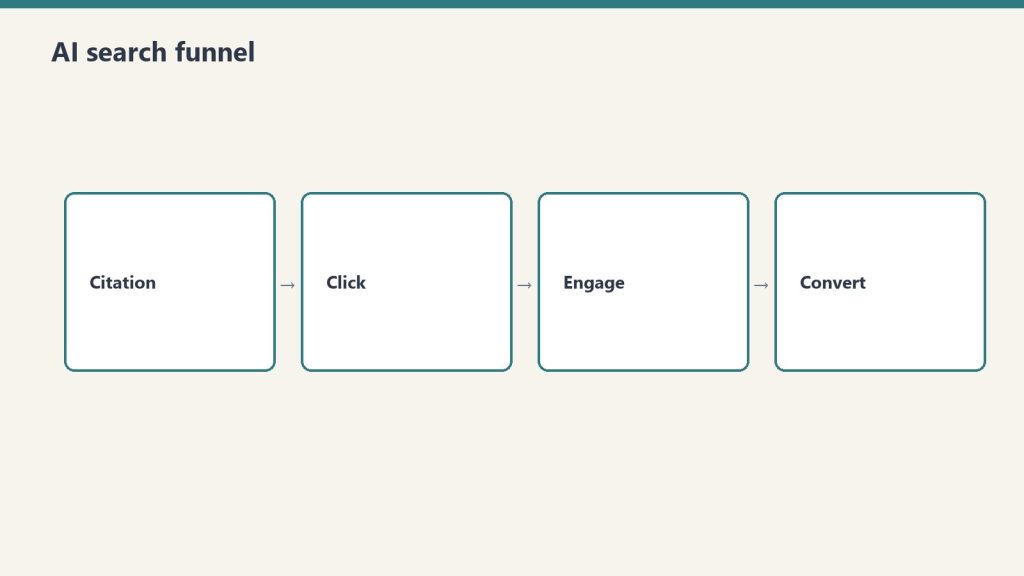
    Four-stage funnel: citation, click, engage, convert
    What Quality Score is and why it controls ad costs.

    Every time your Google ad competes in an auction, Google calculates an Ad Rank for your ad. Ad Rank determines where your ad appears and how much you pay. The formula is roughly: Ad Rank = Your Bid × Quality Score.

    Quality Score is rated on a scale of 1 to 10 and is built from three components:

    • Expected click-through rate — how likely people are to click your ad based on historical performance
    • Ad relevance — how closely your ad matches the intent behind the search
    • Landing page experience — how relevant, useful, and fast your landing page is for people who click

    The cost impact of this score is not subtle. A Quality Score of 10 earns a 50% discount on your cost per click compared to the average score of 5. A Quality Score of 1 costs 400% more per click than that same average. That means two businesses bidding the same amount on the same keyword can pay wildly different prices — entirely based on the quality of their pages and ads.

    Where SEO Directly Feeds Quality Score

    Comparison of Claude how-to fit versus local service page fit for assistants
    Where SEO directly feeds Quality Score.

    The landing page experience component is where SEO work and ad costs converge. Google evaluates your landing page for the same things it evaluates any page for organic ranking: content relevance, page speed, mobile usability, and how well the page answers the intent behind the search.

    Pages that rank well organically tend to score higher as ad landing pages — not coincidentally, but because the underlying signals are the same. A fast, well-structured, keyword-relevant page that Google trusts enough to rank organically is also a page Google rates highly for landing page experience in the ad auction.

    The inverse is also true. If your landing page is slow, thin, or mismatched to the search intent of the keyword you’re bidding on, your Quality Score suffers — and you pay more for every click, regardless of your bid.

    What This Looks Like in Real Numbers

    Consider two plumbers bidding $3.00 on “emergency plumber near me.”

    Plumber A has a well-optimized landing page — fast load time, clear service description, strong reviews visible on the page, location-specific content. Quality Score: 8. Their effective CPC after Google’s discount: roughly $1.89.

    Plumber B has a slow homepage with generic content and no location-specific information. Quality Score: 3. Their effective CPC with Google’s penalty: roughly $5.00 — and their ad may not even show as often.

    Same keyword. Same bid. One is paying more than 2.5x as much per click, and getting worse placement to boot.

    Google Business Profile: The Local Layer

    For local service businesses, Google Business Profile adds another dimension. GBP doesn’t directly lower your Search Ad costs — but it governs your visibility in the Local Pack and Google Maps, which appear above or alongside paid results for most local searches.

    A strong, active GBP with recent reviews, accurate categories, and consistent NAP information (name, address, phone number matching your website) reinforces Google’s confidence in your business as a legitimate local entity. That confidence flows into how Google evaluates your overall web presence — which feeds back into the quality signals that affect your ad performance.

    More practically: a business with strong local organic visibility and a dominant Local Pack presence often needs to bid less aggressively on branded and local terms because they’re already capturing clicks organically. The paid budget stretches further because it’s not doing all the work alone.

    The Practical Implication for Local Service Businesses

    If you’re running Google Ads and your SEO is weak, you are paying a penalty on every click — every day, invisibly, without any line item on your invoice that says “bad website tax.” It just shows up as a higher CPC and a lower return on ad spend.

    Conversely, every dollar spent improving your landing pages — making them faster, more relevant, more locally specific, better structured — is a dollar that reduces your ad costs going forward. SEO investment isn’t just playing the long organic game. It’s actively subsidizing your paid performance in the near term through Quality Score.

    For local service businesses running Google Ads, the highest-leverage move is often not increasing ad spend — it’s improving the pages the ads point to. The bid savings alone frequently exceed the cost of the optimization work.

    Three Things to Audit Right Now

    Desk with laptop, checklist notebook, and billing card ready before creating an Anthropic API key
    Three things to audit right now for Ads + SEO alignment.
    1. Check your Quality Scores. In Google Ads, go to Campaigns → Keywords and add the Quality Score column. Any keyword at 5 or below is costing you extra money on every click. Identify the worst offenders.
    2. Match landing pages to ad intent. Every ad group should point to a page that directly matches what the ad promises. Sending traffic to your homepage from a specific service keyword is one of the most common Quality Score killers.
    3. Audit page speed on mobile. Google’s landing page experience evaluation weights mobile performance heavily. A page that loads in 4+ seconds on mobile is dragging your Quality Score down regardless of how good the content is.

    Does SEO directly affect Google Ads performance?

    Not directly through rankings, but yes through Quality Score. The landing page experience component of Quality Score rewards the same things SEO rewards — fast, relevant, well-structured pages. Pages that rank well organically tend to score higher as ad landing pages, which lowers your cost per click.

    What is Quality Score and why does it matter?

    Quality Score is Google’s 1-10 rating of your ad’s expected click-through rate, ad relevance, and landing page experience. It directly affects how much you pay per click — a score of 10 earns a 50% CPC discount, while a score of 1 costs 400% more than average. Two businesses with the same bid can pay drastically different prices based on Quality Score alone.

    Does Google Business Profile affect Google Ads costs?

    Not directly for standard Search Ads. But a strong GBP builds local organic visibility and entity trust that reinforces the quality signals Google uses to evaluate your overall web presence. For Local Search Ads specifically, GBP data is used directly for ad placement in the Local Pack.

    What’s the fastest way to improve Quality Score for a local service business?

    Match your landing pages to the specific intent of each ad group — don’t send all traffic to your homepage. Improve mobile page speed. Add location-specific content that matches what people in your service area are searching for. These three changes address all three Quality Score components simultaneously.

    Is it better to increase ad budget or improve landing pages?

    For most local service businesses with Quality Scores below 7, improving landing pages delivers better ROI than increasing budget. Every Quality Score point improvement reduces your CPC, meaning the same budget buys more clicks — and those clicks convert better because the page is more relevant.

    Related on Tygart Media: Discovery-to-Exact keyword intelligence protocol · SEO vs social impressions · information density.

  • From $0 to $31,000: The Upper Restoration SEO Story

    From $0 to $31,000: The Upper Restoration SEO Story

    Tygart Media / Content Strategy
    The Practitioner JournalField Notes
    By Will Tygart
    · Practitioner-grade
    · From the workbench

    The easiest way to explain what a content program actually does for a restoration company is to show one.

    Upper Restoration serves New York City and Long Island — Nassau and Suffolk counties. Competitive market, established players, the full range of water damage, fire, mold, and storm work. When we started working together, their SpyFu profile looked like most restoration contractors: effectively zero organic search presence, no meaningful keyword rankings, no measurable traffic from search.

    Today their monthly SEO value — the estimated cost to replicate their organic traffic through paid search — sits above $31,000 per month. That number is verified, tracked, and continues to move.

    This is what happened, in the order it happened, and why each step mattered.

    Step One: The Baseline Audit

    Comparison of Claude how-to fit versus local service page fit for assistants
    Step one — the baseline audit.

    Before a single article was written, we ran a complete site audit. Not a surface-level crawl — a structured inventory of every post, every page, every category and tag, every piece of metadata. What existed, what was missing, what was broken, what was thin.

    The audit answers the foundational question: what does Google currently think this site is about? In Upper Restoration’s case, the answer was: not much. Thin content, minimal taxonomy, no internal link architecture, no schema markup. The domain existed but carried no topical authority signal in any specific category.

    This is the starting line for almost every restoration contractor we work with. The audit doesn’t reveal a problem — it reveals the opportunity. A site with no established authority can build it faster than a site with entrenched wrong signals, because there’s nothing to undo.

    Step Two: Architecture Before Content

    The temptation after an audit is to start publishing immediately. The right move is to design the architecture first.

    For Upper Restoration, that meant establishing the category structure: Water Damage, Fire Restoration, Mold Remediation, Storm Damage, Commercial Restoration, Insurance Claims. Every piece of content would live inside one of these buckets. The buckets would become the topical pillars Google associates with the domain.

    It meant identifying the hub pages — one pillar article per service category, written to be the most comprehensive resource on that topic in their market. Every supporting article would link back to the relevant hub. The hubs would link out to supporting articles. The internal link graph would make the site’s topical organization explicit and navigable.

    It meant mapping the service areas: every neighborhood in New York City, every town across Nassau and Suffolk with meaningful search volume for restoration services. Each would get its own page. The geographic coverage would signal to Google exactly where this company operates and for which locations it deserves to rank.

    This work takes time before it produces any visible results. It’s also what separates a content program that compounds over time from one that generates a temporary traffic bump and then plateaus.

    Step Three: The Content Sprint

    Desk with laptop, checklist notebook, and billing card ready before creating an Anthropic API key
    Step three — the content sprint.

    With the architecture established, the content sprint began. The goal: achieve topical authority in the core service categories as quickly as possible by covering every meaningful query a restoration customer in Upper Restoration’s market might search.

    Not generic coverage — hyper-local, hyper-specific coverage. Water damage restoration in Flushing. Mold remediation in Hempstead. Fire damage cleanup in Babylon. Each piece of content targeting the specific geographic and service intersection where a real customer with a real problem would be searching.

    The volume matters for a specific reason: Google’s topical authority model rewards comprehensive coverage. A site with one excellent article about water damage restoration ranks below a site with one hundred well-structured articles about water damage restoration in every neighborhood of its service area, because the latter site demonstrates deeper expertise. The sprint isn’t about quantity for its own sake — it’s about covering the topic space completely enough that Google has no reason to prefer a competitor with thinner coverage.

    Every article was optimized before publishing: title tag, meta description, slug, heading structure, schema markup, internal links to the relevant hub page. Not as an afterthought — as part of the production process.

    Step Four: Schema and Structured Data

    Schema markup is the metadata layer that tells Google what type each piece of content is and how to categorize it. Article schema for editorial content. LocalBusiness schema on the homepage and service pages. FAQ schema on content that answers specific questions. BreadcrumbList schema to signal the site’s navigational hierarchy.

    The impact of schema is less visible than rankings but measurable in search result appearance: FAQ dropdowns, star ratings, rich snippets, knowledge panel information. These take up more real estate in search results and convert at higher rates than standard blue links, because they answer the user’s question before the click.

    More importantly, schema accelerates Google’s ability to categorize the site correctly. Without it, Google infers content type from the raw text. With it, you’re providing structured data that removes ambiguity. For a restoration contractor trying to establish authority in multiple service categories simultaneously, removing ambiguity is significant.

    Step Five: The Measurement Layer

    Four-stage funnel: citation, click, engage, convert
    Step five — the measurement layer.

    SEO without measurement is guesswork. The measurement layer for Upper Restoration runs through SpyFu for organic value tracking and DataForSEO for keyword-level ranking data across the specific locations and queries that matter.

    SpyFu’s monthly SEO value metric is the headline number — it’s what shows the overall trajectory and what makes the clearest case to a client that the program is working. But the keyword-level data underneath it tells the more granular story: which service categories are ranking, which locations are performing, which queries have moved to page one, which still have room to climb.

    The measurement layer also drives the ongoing program. When keyword data shows a cluster gaining traction, you add more content in that cluster. When a hub page is ranking but not converting, you look at the content structure and the call to action. When a service area is generating impressions but not clicks, you look at the title tag and meta description. The program is a feedback loop, not a one-time campaign.

    What $31,000 in SEO Value Actually Means

    The SpyFu number is an estimate of traffic value, not revenue. A site with $31,000 in monthly SEO value is generating organic traffic that would cost $31,000 per month to replicate through Google Ads. The actual revenue generated depends on conversion rates, average job values, close rates — variables that differ for every company.

    What the number does tell you, clearly and verifiably, is that the content program has built genuine search presence. Keywords are ranking. Pages are generating clicks. The site exists, from Google’s perspective, in a way it didn’t before.

    For Upper Restoration, that presence is geographically concentrated in exactly the markets where they operate, for exactly the services they provide, targeting exactly the search queries that produce calls. The traffic is not vanity traffic — it’s potential customers with active problems looking for someone to call.

    The program that produced this result started from $0. It required an audit, an architecture phase, a content sprint, schema implementation, and an ongoing measurement and iteration cycle. It did not require a large agency, a significant paid media budget, or anything other than a structured approach to building topical authority in a specific market.

    That’s the story. The starting line for any restoration contractor who wants to tell a similar one is a baseline audit — understanding exactly where $0 is before building toward something different.


    Tygart Media builds content programs for restoration contractors. Every engagement starts with a SpyFu and DataForSEO baseline audit of your market — so the starting line is documented and the trajectory is measurable from day one.

    {
    “@context”: “https://schema.org”,
    “@type”: “Article”,
    “headline”: “From $0 to $31,000: The Upper Restoration SEO Story”,
    “description”: “Upper Restoration went from zero search presence to $31,000 in monthly SEO value. Here is exactly what happened, in what order, and why each step mattered.”,
    “datePublished”: “2026-04-02”,
    “dateModified”: “2026-04-03”,
    “author”: {
    “@type”: “Person”,
    “name”: “Will Tygart”,
    “url”: “https://tygartmedia.com/about”
    },
    “publisher”: {
    “@type”: “Organization”,
    “name”: “Tygart Media”,
    “url”: “https://tygartmedia.com”,
    “logo”: {
    “@type”: “ImageObject”,
    “url”: “https://tygartmedia.com/wp-content/uploads/tygart-media-logo.png”
    }
    },
    “mainEntityOfPage”: {
    “@type”: “WebPage”,
    “@id”: “https://tygartmedia.com/upper-restoration-seo-case-study/”
    }
    }

    Visual summary

    Editorial illustration for From $0 to $31,000: The Upper Restoration SEO Story - Tygart Media AI-generated visual
    AI-generated editorial illustration — Vertex AI Imagen 4 Standard

    About this image. This image was generated by Google’s Vertex AI Imagen 4 model as the featured visual for From $0 to $31,000: The Upper Restoration SEO Story . Every image in the Tygart Media visual library is AI-generated, converted to WebP for optimal performance, and enriched with IPTC/XMP metadata for search engine discoverability.

    • Model: Vertex AI Imagen 4 Standard (imagen-4.0-generate-001)
    • Format: WebP (quality 90)
    • Aspect Ratio: 16:9
    • Metadata: IPTC/XMP injected (title, description, creator, rights, location)
    • Creator: Tygart Media — tygartmedia.com

    Part of The Studio collection — AI-generated visuals powering the Tygart Media content engine.

  • The $0 SEO Value Problem: What Invisibility Actually Costs Restoration Contractors

    The $0 SEO Value Problem: What Invisibility Actually Costs Restoration Contractors

    There’s a restoration company in Tacoma, Washington called All American Restoration Services. Four and a half stars. Thirty-seven Google reviews. Full mitigation and rebuild capability. Locally owned, with the kind of reputation that takes years to earn.

    Their SpyFu profile shows six tracked keywords, zero estimated monthly clicks, and $0 in monthly SEO value. DataForSEO has no data on them at all — they don’t register.

    They are, from a search engine’s perspective, completely invisible.

    This is not unusual. It is, in fact, the default state for most restoration contractors in most markets. And the cost of that invisibility is not abstract.

    What $0 SEO Value Actually Means in Dollars

    Comparison of Claude how-to fit versus local service page fit for assistants
    What zero SEO value actually means in dollars.

    SEO value — the metric SpyFu and similar tools report — is an estimate of what a site’s organic traffic would cost if purchased through Google Ads. A site with $31,000 in monthly SEO value is receiving traffic that would cost $31,000 per month to replicate with paid search.

    When that number is $0, it means the site is generating no measurable organic traffic for any keyword anyone is actually searching.

    In the restoration industry, the keywords people search are high-intent and high-value. Someone searching “water damage restoration Tacoma” is not browsing. They have standing water in their house. They are going to call someone in the next fifteen minutes. The average water damage restoration job runs $3,836. Significant losses start at $15,000. The searches that drive those calls are worth real money — and right now, those calls are going to someone else.

    The math is uncomfortable. If a restoration company’s invisibility costs them even five jobs per month — conservative for a market the size of Tacoma — that’s $19,000 to $75,000 in monthly revenue that’s routing to a competitor who ranked higher. Not because that competitor does better work. Because their website exists, from Google’s perspective, and yours doesn’t.

    Why Good Restoration Companies End Up Invisible

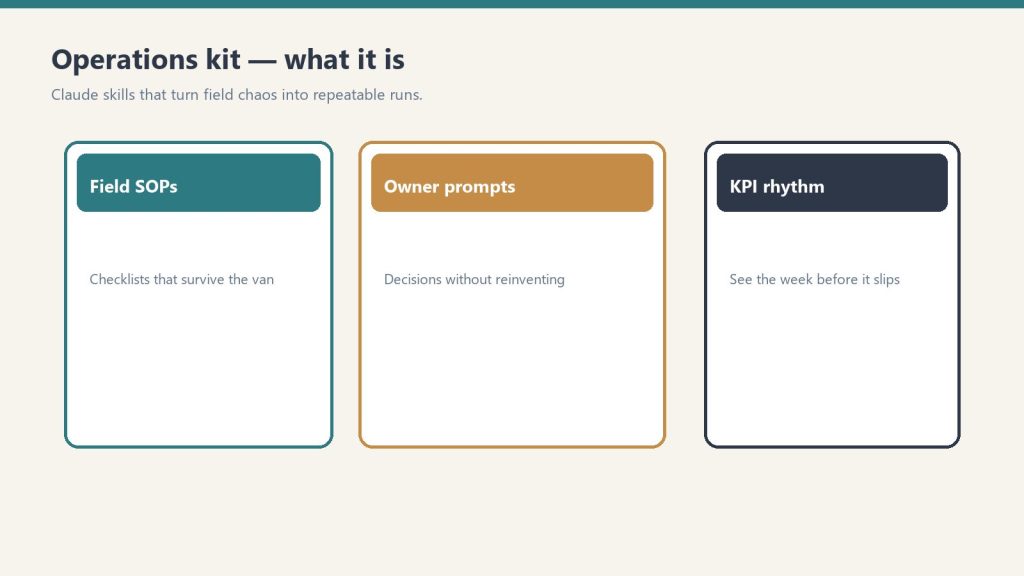
    Three cards for field SOPs, owner prompts, and KPI rhythm in an operations kit
    Why good restoration companies end up invisible.

    All American Restoration is not an anomaly. When you run DataForSEO and SpyFu against restoration contractors in most mid-size markets, the pattern repeats: strong reputation, strong reviews, zero search presence.

    It happens for a predictable set of reasons.

    Restoration companies grow on referrals. Insurance adjusters, plumbers, property managers — the first decade of a restoration business is built on relationships, not search. By the time the referral network matures, the business is busy enough that digital marketing feels optional. The website becomes a brochure, not an acquisition channel.

    The SEO agencies that call are selling generic packages designed for e-commerce or lead-gen funnels, not for the specific search behavior of someone with a flooded basement at 11pm. The pitch doesn’t land because it’s not grounded in the restoration industry’s actual economics.

    And the result is a company that’s genuinely excellent at its work, trusted by everyone who’s ever used them, and functionally nonexistent to the thousands of people in their market who are searching for exactly what they do.

    The Relative Improvement Problem

    Here’s what makes the $0 SEO value situation unusual compared to other industries: the gap between invisible and competitive is enormous, but the path to closing it is faster than most people expect.

    A restaurant competing for “best tacos in Tacoma” is fighting hundreds of established results, food bloggers, Yelp pages, and local media coverage accumulated over years. The field is crowded and the domain authority gap is steep.

    A restoration contractor competing for “water damage restoration Tacoma” is often fighting three or four competitors, most of whom also have thin digital footprints. The bar is low. Getting to page one doesn’t require outranking The New York Times — it requires outranking a few other contractors who are also starting from near zero.

    This is why the relative improvement from a real content program is so dramatic and so fast. Upper Restoration went from $0 to over $31,000 in monthly SEO value. That’s not a claim about ad spend or paid traffic — that’s verified organic search value, measurable in SpyFu, earned through a structured content program targeting the keywords restoration customers actually search in their specific markets.

    What Closing the Gap Looks Like

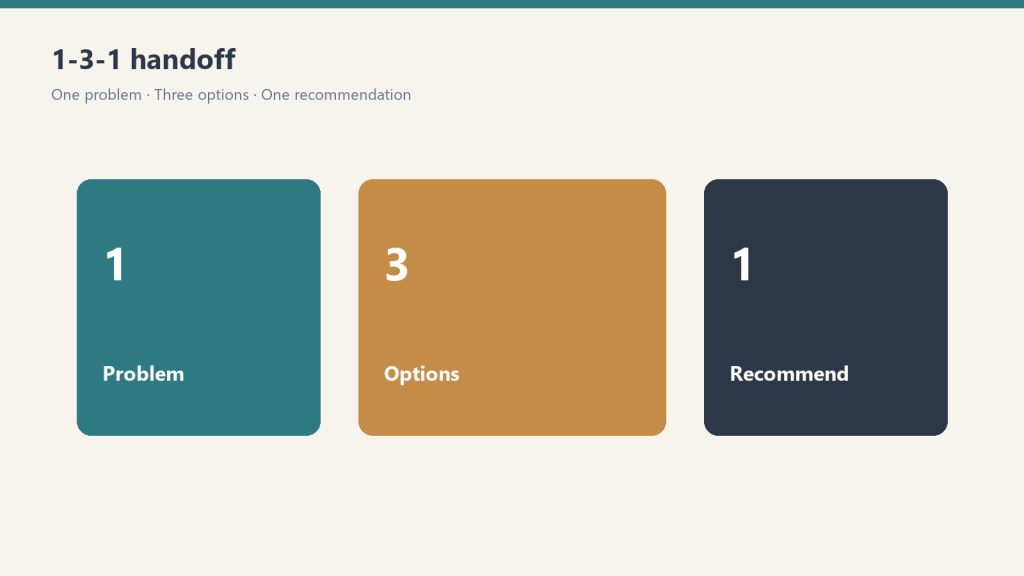
    Three panels showing one problem, three options, one recommendation
    What closing the gap looks like.

    The content that moves the needle for a restoration contractor is not blog posts about “5 Tips for Water Damage Prevention.” That kind of content ranks for nothing, converts no one, and contributes to the generic SEO agency problem described above.

    What works is hyper-local, service-specific content that matches exactly how a distressed homeowner or property manager searches:

    • Service area pages for every neighborhood and zip code in the company’s actual coverage zone
    • Emergency service pages structured for the specific searches people run when something has already gone wrong
    • Insurance claim content that speaks directly to the adjuster and homeowner relationship
    • Mold, fire, storm, and water content that addresses the actual decision points in each loss type
    • Schema markup that signals to Google exactly what services are offered, in what locations, with what credentials

    The volume matters too. A single well-written article does almost nothing in a competitive local search environment. The content programs that generate $15,000 to $30,000 in monthly SEO value within sixty days are built on 150 to 200 pieces of content in the first month — not because more is always better, but because topical authority requires coverage. Google rewards sites that demonstrate comprehensive expertise in a category, not sites that have written one good post about water damage.

    The SpyFu Dashboard Conversation

    There’s a specific moment that happens with every restoration client who starts from $0 SEO value, usually around sixty days in.

    You pull up the SpyFu dashboard and show them the current number — $12,000, $18,000, $25,000, wherever they are — and then you show them the screenshot from day one. The one that says $0.

    The conversation changes at that point. They’re no longer thinking about whether SEO works. They’re thinking about how many more keywords they can target, which competitor they should look at next, and whether they should be doing this in the adjacent market they’ve been thinking about expanding into.

    That’s the actual product. Not the content, not the rankings — the clarity. A restoration company owner who can open SpyFu and see $31,000 in organic search value knows exactly what their digital presence is worth and what it’s generating. The $0 problem isn’t just a marketing problem. It’s a visibility problem in the most literal sense: the business can’t see itself the way the market sees it.

    All American Restoration does excellent work. Their reviews say so. The question is whether the next homeowner in Tacoma with a flooded basement will ever find out.


    Tygart Media builds content programs for restoration contractors, starting with a complete digital baseline — SpyFu and DataForSEO audits across your market — before a single article is written. If your company shows $0 in SEO value, that’s not a criticism. It’s the starting line.

    {
    “@context”: “https://schema.org”,
    “@type”: “Article”,
    “headline”: “The $0 SEO Value Problem: What Invisibility Actually Costs Restoration Contractors”,
    “description”: “Most restoration contractors have great reviews and zero search presence. Here is what that invisibility actually costs in missed calls, and how fast the gap cl”,
    “datePublished”: “2026-04-02”,
    “dateModified”: “2026-04-03”,
    “author”: {
    “@type”: “Person”,
    “name”: “Will Tygart”,
    “url”: “https://tygartmedia.com/about”
    },
    “publisher”: {
    “@type”: “Organization”,
    “name”: “Tygart Media”,
    “url”: “https://tygartmedia.com”,
    “logo”: {
    “@type”: “ImageObject”,
    “url”: “https://tygartmedia.com/wp-content/uploads/tygart-media-logo.png”
    }
    },
    “mainEntityOfPage”: {
    “@type”: “WebPage”,
    “@id”: “https://tygartmedia.com/zero-seo-value-restoration-contractors/”
    }
    }

    Questions? Chat on WhatsApp

    Visual summary

    Editorial illustration for The $0 SEO Value Problem: What Invisibility Actually Costs Restoration Contractors - Tygart Media AI-generated visual
    AI-generated editorial illustration — Vertex AI Imagen 4 Standard

    About this image. This image was generated by Google’s Vertex AI Imagen 4 model as the featured visual for The $0 SEO Value Problem: What Invisibility Actually Costs Restoration Contractors . Every image in the Tygart Media visual library is AI-generated, converted to WebP for optimal performance, and enriched with IPTC/XMP metadata for search engine discoverability.

    • Model: Vertex AI Imagen 4 Standard (imagen-4.0-generate-001)
    • Format: WebP (quality 90)
    • Aspect Ratio: 16:9
    • Metadata: IPTC/XMP injected (title, description, creator, rights, location)
    • Creator: Tygart Media — tygartmedia.com

    Part of The Studio collection — AI-generated visuals powering the Tygart Media content engine.

  • The State of Restoration Franchise SEO in 2026: Who’s Winning, Who’s Losing, and Why

    The State of Restoration Franchise SEO in 2026: Who’s Winning, Who’s Losing, and Why

    The Machine Room · Under the Hood

    I wrote five articles in one day. Here’s why.

    On March 28, 2026, I sat down with SpyFu data pulled that morning and realized something most of the restoration industry hasn’t seen yet: they’re all experiencing the same catastrophic decline at the same time. This isn’t a case of individual franchise websites being poorly optimized. This is an industry-wide pattern that reveals everything about where restoration franchise SEO is headed.

    I spent that day analyzing SERVPRO, Paul Davis, Rainbow Restores, ServiceMaster, and 911 Restoration across every dimension of competitive SEO intelligence we track. The result was five separate playbooks—one for each franchise. But those five articles tell one much bigger story.

    This is that story.

    ## The Competitive Landscape: Five Franchises, One Reality Check

    Let me start with where they all stand right now, as of March 30, 2026:

    | Company | Domain | Keywords | Monthly Clicks | SEO Value | Peak Value | Peak Keywords | Domain Strength | Monthly PPC |
    |—|—|—|—|—|—|—|—|—|
    | SERVPRO | servpro.com | 178,900 | 151,700 | $5,825,000 | $7,684,585 | 286,900 | 62 | $1,944,000 |
    | Paul Davis | pauldavis.com | 22,190 | 13,590 | $952,800 | $4,525,425 | 97,480 | 54 | $206,100 |
    | Rainbow Restores | rainbowrestores.com | 33,700 | 25,500 | $495,500 | $3,354,009 | 109,000 | 52 | $320,000 |
    | 911 Restoration | 911restoration.com | 816 | 617 | $22,700 | $407,500 | 4,466 | 40 | $132,100 |
    | ServiceMaster | servicemaster.com | 1,742 | 4,435 | $39,300 | $334,384 | 20,696 | 42 | $7,039 |

    This table is deceptively simple. It contains the entire story of what went wrong in restoration franchise SEO in the last six months.

    ## The Q4 2025 Cliff: What Actually Happened

    Here’s what should terrify every restoration brand right now:

    – **SERVPRO**: Lost 108,000 keywords between October 2025 and March 2026. Their peak was 286,900 keywords in October. Today they’re at 178,900. That’s a 38% decline in four months.
    – **Paul Davis**: Fell from 49,500 keywords in October to 22,190 today. A 55% crater.
    – **Rainbow Restores**: Dropped from 57,700 to 33,700. Still significant, but the recovery trajectory is different.
    – **911 Restoration**: Lost another 1,600 keywords, bringing them to 816 total. They’ve lost 94% of their peak visibility.
    – **ServiceMaster**: Continued its decade-long irrelevance with minimal movement.

    This didn’t happen because these companies suddenly made bad SEO decisions. This happened because Google changed something fundamental in how it ranks restoration and emergency services content between October and December 2025.

    The data points to one of several possibilities:

    1. **Algorithm Update (Most Likely)**: Google released changes to E-E-A-T validation, location signals, or trust factors that disproportionately hit franchise networks. The Oct-Dec window included at least two confirmed updates.

    2. **Search Generative Experience (SGE) Impact**: As SGE matures, Google is directly synthesizing answers that bypass clicks to individual sites. Franchises with dispersed content across local pages (rather than consolidated authority) are getting worse SGE treatment.

    3. **Authority Consolidation**: The algorithm may have shifted toward favoring domain-level authority over page-level authority, punishing franchises that rely on local service pages when the parent domain isn’t sufficiently strong.

    4. **Review Signal Reweighting**: With Google tightening review validity checks, franchises with weak or manipulated review signals (common in franchise networks) took hits.

    The real answer is probably all four working together. But here’s the critical insight: **every restoration franchise except the already-dead ServiceMaster lost visibility at the same time.** That’s not a coincidence. That’s a market signal.

    ## The Tier System: Who’s Actually Winning

    What emerges from the data is a clear three-tier system:

    ### Tier 1: Untouchable Dominance

    **SERVPRO remains the category king**, but here’s the thing—they’re bleeding. Despite losing 108,000 keywords, they still own 178,900. They still command $5.8M in monthly SEO value. They still capture 151,700 monthly clicks organically.

    The gap between SERVPRO and everyone else is absurd. Paul Davis—the clear #2 player—captures only 22,190 keywords to SERVPRO’s 178,900. That’s an 8:1 ratio.

    But dominance can hide decline. SERVPRO was at $7.68M monthly value just six years ago. If they continue this trajectory (losing ~27K keywords per month), they’ll be in Tier 2 within three years.

    ### Tier 2: The Competitive Battleground

    **Paul Davis and Rainbow Restores** live in a completely different world from SERVPRO, but they’re actively competing with each other.

    Paul Davis has **22,190 keywords and $952,800 monthly SEO value**. They were growing through 2025 and then hit the cliff hard with everyone else. But here’s their advantage: they rank for extremely high-value terms. Their value-per-keyword is $42.94—the highest of any competitor in this space.

    Rainbow Restores has **33,700 keywords and $495,500 monthly SEO value**. They’re a domain migration success story. They moved from their original domain (which had 109,000 keywords and $3.35M value) and have rebuilt to 33,700 keywords on the new domain. They’re approaching their current domain’s natural peak, which suggests room for growth.

    Between these two, the opportunity is real. Paul Davis has momentum and authority but lost it in Q4. Rainbow has growth trajectory and recent migration advantages. The winner in 2026 between these two will be whoever invests in modern SEO first.

    ### Tier 3: Starting Over or Walking Away

    **911 Restoration and ServiceMaster** are fundamentally different problems.

    ServiceMaster is a legacy brand in complete digital collapse. They rank for 1,742 keywords, generate 4,435 monthly clicks, and command only $39,300 in SEO value. Their domain strength is 42. They peaked at $334K monthly value in February 2020—six years ago. This isn’t a recovery situation. This is a brand that’s digitally abandoned its restoration line.

    911 Restoration is worse because they’re still trying. They spend $132,100/month on PPC while holding only 816 keywords and $22,700 in SEO value. They’re in the worst position of any competitor: visible enough to know they’re broken, not successful enough to stop hemorrhaging money.

    ## The Value-Per-Keyword Insight: Why High Value Doesn’t Mean Winning

    Here’s where competitive analysis gets interesting. Let me calculate value per keyword for each franchise:

    – **Paul Davis: $42.94/keyword**
    – **SERVPRO: $32.56/keyword**
    – **ServiceMaster: $22.56/keyword**
    – **911 Restoration: $27.82/keyword**
    – **Rainbow Restores: $14.70/keyword**

    Paul Davis wins this metric by a massive margin. They’re ranking for restoration terms that are worth significantly more than competitors. This suggests better content targeting, local authority, and possibly a geographic mix that includes higher-value markets.

    SERVPRO is close behind at $32.56/keyword, which makes sense—they dominate the market and rank for premium terms.

    But here’s the catch: **high value per keyword doesn’t predict growth.** Rainbow Restores has the lowest value per keyword ($14.70), but they’re the recovery story here. They survived a domain migration and are building back. Paul Davis has the highest value per keyword but lost 55% of their visibility in Q4.

    This is the fundamental lesson: **keyword count and value are backward-looking metrics.** They tell you what the market awarded you historically, not what you’re capturing going forward.

    ## The $31M PPC Problem: The Real Story of Organic Failure

    Now for the genuinely damning number: **these five franchises are spending $2.606M per month on Google Ads.**

    That’s $31.27 million per year on paid search.

    Let me break down the monthly PPC spend:
    – SERVPRO: $1,944,000
    – Paul Davis: $206,100
    – Rainbow Restores: $320,000
    – 911 Restoration: $132,100
    – ServiceMaster: $7,039

    What’s fascinating is the timing. In October 2025, as organic keywords started tanking, **Paul Davis, Rainbow Restores, and 911 Restoration all spiked their PPC spending simultaneously.** This wasn’t random budget allocation. This was panic.

    November 2025 PPC spend for these three franchises:
    – Paul Davis hit $665K (peak spend)
    – Rainbow Restores hit $583K
    – 911 Restoration hit $370K

    They knew organic was failing before it was obvious in the data. And they responded with paid spend increases that ranged from 45% to 180% above baseline.

    SERVPRO, sitting at $2M+ monthly PPC, clearly made a different decision: lean further into paid. They have the cash to do it. The smaller competitors didn’t, which is why you see their current PPC at more moderate levels.

    The obvious question: **If they’re spending $31M/year on paid search, why wouldn’t they invest 10% of that ($3.1M/year) in fixing organic?**

    The answer is structural. Franchises are fundamentally decentralized. Local franchisees see the top-line organic collapse (because it’s syndicated across their local pages), panic about visibility, and demand quick fixes. PPC delivers immediate impressions. Organic takes three to six months.

    In a downturn, panic money flows to the short-term solution, not the right solution.

    ## What Actually Changed: The Diagnosis

    I analyzed these five franchises in-depth because I needed to understand what Q4 2025 actually broke. Here’s what the individual playbooks revealed:

    **SERVPRO** relies on a massive network of individual location pages with weak local authority. When Google tightened its E-E-A-T validation for local services, those pages took hits. The parent domain is strong (62 domain strength), but not strong enough to carry 280+ local variations without architectural improvements.

    **Paul Davis** had brilliant local SEO strategy—strong local authority pages, good schema implementation, solid review signals. But their strategy was vulnerable to any shift in how Google weights parent domain authority vs. local page authority. When the Q4 update hit, their advantage disappeared.

    **Rainbow Restores** suffered the domain migration legacy—they lost all ranking momentum when they moved domains, and they’re still rebuilding authority. The newer domain is growing, but it’s a long climb.

    **911 Restoration** has fundamental domain authority problems. 816 keywords on a domain with only 40 authority points is catastrophic. They can’t rank for anything meaningful because the domain itself isn’t trusted.

    **ServiceMaster** is eight years into a slow-motion bankruptcy of their digital presence. There’s nothing to analyze—they’ve simply abandoned digital.

    ## What Modern Restoration SEO Looks Like in 2026

    If I were running SEO for any of these franchises right now, here’s what I’d do:

    **1. Domain Architecture Overhaul**
    Stop treating location pages as disposable. Build local authority that actually compounds. Use canonicals strategically. Consolidate authority signals to fewer, stronger pages rather than spreading authority across hundreds of weak pages.

    **2. AI-Augmented Content Strategy**
    Restoration keywords are incredibly specific. “Water damage restoration Alexandria VA” is different from “water damage restoration Phoenix AZ” in intent, local competition, and required expertise. Use AI to generate actually useful, locally-relevant content at scale without the SEO-spam quality.

    **3. Structured Data Mastery**
    Service schema, FAQ schema, Organization schema—implement these at the parent domain level, not just at local pages. When Google looks at your domain, it should understand instantly what you do, where you operate, and why you’re trustworthy.

    **4. Geographic Expansion Through Intent**
    Paul Davis’s high value-per-keyword suggests they’re better at geo-targeting high-value markets. Intentionally target expensive geographic markets first. Use Google Ads data to identify which markets have the highest customer acquisition cost, then dominate organic in those markets.

    **5. Review Signal Validity**
    Google’s tightening review checks. Stop chasing review volume. Build processes that generate genuine reviews from actual customers. This takes longer, but it’s the only strategy that survives algorithm updates.

    **6. E-E-A-T at Scale**
    For franchises, E-E-A-T is particularly challenging because you need to demonstrate expertise across hundreds of locations. Create a parent domain authority system where franchisees contribute verified expertise, local results, case studies, and certifications that roll up to a central authority hub.

    ## What This Series Actually Demonstrates

    I wrote five separate playbooks because each franchise has a different problem:

    – **SERVPRO**: Scale is your asset and your liability. You need architectural fixes that only the largest franchises can implement.
    – **Paul Davis**: You had the right strategy for 2024-2025. You need to evolve faster than the algorithm changes.
    – **Rainbow Restores**: You’re the comeback story. Your new domain is building momentum. Don’t waste it.
    – **911 Restoration**: You’re fighting domain authority problems that will take 18 months minimum to fix. Start now.
    – **ServiceMaster**: You’re in liquidation mode for your digital presence. Different problem.

    But there’s a meta-lesson in having this data and this analysis available to franchises: **the restoration industry SEO landscape is wider open in March 2026 than it’s been in six years.**

    SERVPRO is losing keywords. Paul Davis lost momentum. Rainbow is rebuilding. 911 and ServiceMaster aren’t real competitors anymore.

    Any restoration franchise that invests in modern SEO infrastructure right now—real content strategy, proper domain architecture, AI-augmented scale, and rigorous E-E-A-T—will capture market share that was SERVPRO’s last year.

    This is the historic window. It closes when one of the Tier 2 players figures out what actually changed in Q4 2025 and executes a real recovery.

    ## The Individual Playbooks

    Each of these five franchises gets its own deep-dive analysis:

    – **[SERVPRO SEO Playbook](/servpro-seo-playbook/)** – Scale, authority dilution, and how to fix an 800,000+ page domain.
    – **[Paul Davis SEO Playbook](/paul-davis-seo-playbook/)** – Local authority strategy, value maximization, and adapting to algorithm shifts.
    – **[Rainbow Restores SEO Playbook](/rainbow-restoration-seo-playbook/)** – Domain migration recovery, rebuilding authority, and growth strategy.
    – **[911 Restoration SEO Playbook](/911-restoration-seo-playbook/)** – Foundation building, domain authority recovery, and realistic timelines.
    – **[ServiceMaster SEO Playbook](/servicemaster-seo-playbook/)** – Legacy strategy, digital retreat, and whether recovery is possible.

    Read the one that applies to your franchise. Or read all five. The comparative analysis is where the real insight lives.

    ## The Data-Driven Difference

    This entire series—five detailed playbooks plus this comparative analysis—was built in one day because it’s what we do at Tygart Media.

    We pull data from multiple sources (SpyFu, Google, internal analysis frameworks). We synthesize patterns that competitors miss because they’re looking at their own domain instead of the entire category. We translate technical SEO findings into business strategy.

    We build AI-augmented content systems that let franchises operate at scale without sacrificing quality. We implement the structural improvements that survive algorithm updates. We turn data into competitive advantage.

    If you’re a restoration franchise and you’re reading this, you already know your organic visibility took a hit in Q4 2025. You probably already know your PPC costs are climbing. You might not know why, or what to do about it.

    We’ve mapped both. And we know how to fix it.

    ## FAQ: What This Data Really Means

    **Q: Did Google definitely change something in Q4 2025?**
    A: The simultaneous keyword loss across five major competitors in the same niche is statistically improbable without a triggering event. Confirmed algorithm updates in that window make this nearly certain. The question isn’t whether Google changed something—it’s what specifically changed, and that varies by domain architecture and content strategy.

    **Q: Is SERVPRO actually in trouble?**
    A: SERVPRO is losing market share relative to their peak, but they’re still dominant. However, if the trend continues, they’ll be in serious trouble within two years. For now, they’re managing decline with increased PPC spend. Long-term, that strategy gets expensive.

    **Q: Can Paul Davis recover to their 2024 performance levels?**
    A: Possibly, but only if they correctly identify what the Q4 update hit and adapt their strategy accordingly. Their high value-per-keyword suggests they’re targeting the right terms. The issue is domain authority and architecture, not keyword selection.

    **Q: How long will it take 911 Restoration to recover?**
    A: Domain authority recovery is slow. At their current trajectory, rebuilding to 5,000 keywords would take 3-4 years of sustained, correct optimization. The real timeline depends on their willingness to invest and whether they fix the fundamental architecture problems.

    **Q: Why spend $31M on PPC instead of fixing organic?**
    A: Because franchises operate with local franchisee decision-making, and local franchisees want immediate results. Organic takes time. But the math is clear: if you’re spending $31M on paid, you should be investing $3-5M on fixing organic. ROI on organic is higher long-term, but executives get fired for short-term failures.

    ## What Happens Next

    In six months, we’ll pull this data again. One of three things will have happened:

    1. **Recovery**: One of the Tier 2 players (Paul Davis or Rainbow) will have figured out the Q4 update and recovered visibility. They’ll start capturing SERVPRO’s market share.

    2. **Consolidation**: SERVPRO will have stabilized their decline through increased paid spend and minor organic improvements. They’ll remain dominant but more vulnerable.

    3. **Fragmentation**: The market stays dispersed. No single competitor dominates enough to own the category. Franchises with better marketing budgets than SEO strategies (like the status quo) keep winning.

    I’m betting on #1. The market is too opportunity-rich for it to stay broken this long.

    —

    ## Conclusion

    The restoration franchise SEO landscape is broken. That’s actually the good news, because broken systems create opportunity.

    SERVPRO is bleeding keywords. Paul Davis lost momentum. Rainbow is rebuilding. 911 is struggling. ServiceMaster is irrelevant.

    For any franchise willing to invest in real SEO infrastructure—the technical foundation, content strategy, AI-augmented scale, and data-driven execution—this is the moment to attack.

    The window doesn’t stay open long.

    Read the individual playbooks. Pick your category. Start executing. The data will tell you whether you’re moving in the right direction.

    We built this analysis in a day. If you want help building the execution strategy, let’s talk.

    —

    Will Tygart
    Tygart Media

    The Complete Restoration Franchise SEO Playbook Series

    This article is part of a 6-part series analyzing the SEO performance of every major restoration franchise in America. Read the full series:

    {
    “@context”: “https://schema.org”,
    “@type”: “Article”,
    “headline”: “The State of Restoration Franchise SEO in 2026: Whos Winning, Whos Losing, and Why”,
    “description”: “Five franchises. One algorithm update. A $31M/year PPC spend that tells the real story. Here’s what the data reveals about restoration SEO in 2026.”,
    “datePublished”: “2026-03-30”,
    “dateModified”: “2026-04-03”,
    “author”: {
    “@type”: “Person”,
    “name”: “Will Tygart”,
    “url”: “https://tygartmedia.com/about”
    },
    “publisher”: {
    “@type”: “Organization”,
    “name”: “Tygart Media”,
    “url”: “https://tygartmedia.com”,
    “logo”: {
    “@type”: “ImageObject”,
    “url”: “https://tygartmedia.com/wp-content/uploads/tygart-media-logo.png”
    }
    },
    “mainEntityOfPage”: {
    “@type”: “WebPage”,
    “@id”: “https://tygartmedia.com/state-of-restoration-franchise-seo-2026/”
    }
    }