The Question Every Agency Is Asking
If you run a content operation that serves multiple brands, you’ve probably looked at Google Flow and thought: could this actually replace part of our design pipeline? The image generation is impressive. The iteration feature — where you refine an image through successive prompts — is genuinely useful. But the question that matters for agency work isn’t “can it make pretty pictures.” It’s: can it maintain brand consistency across a production run?
We spent a morning running controlled experiments to find out. The results reshape how we think about AI image generation for client work.
What We Tested
We created a fictional coffee brand (“Summit Brew Coffee Company”) with a distinctive mountain-and-coffee-cup logo in black and gold. Then we pushed Flow’s iteration system through three scenarios that mirror real agency workflows:
Scenario 1: Brand persistence across applications. We took the logo from flat design → product mockup → merchandise collection → outdoor lifestyle shoot. Seven total iterations, each changing the context dramatically while asking the model to maintain the brand.
Scenario 2: Element burn-in. We deliberately introduced a red baseball cap, iterated with it for three consecutive generations, then tried to remove it. This simulates the common problem of “I showed the client a concept with X, they don’t want X anymore, but the AI keeps putting X back in.”
Scenario 3: Chain isolation. We started a completely separate iteration chain from a different logo variant within the same project. Does history from Chain A bleed into Chain B?
The Three Findings That Change Our Workflow
1. Brand Fidelity Is Surprisingly High — 9/10 Across 7 Iterations
The Summit Brew mountain icon, typography, and gold/black color scheme maintained recognizable consistency from flat logo all the way through to an outdoor campsite product shoot. Minor proportion drift in the icon (maybe 10%), but the brand was immediately identifiable in every single output. For mockup and concept work, this is production-ready fidelity.
2. Nothing Burns In Before 3 Iterations — Probably Closer to 5-8
The baseball cap was cleanly removable after appearing in three consecutive iterations. Both the cap and a coffee mug were stripped out with a single well-crafted removal prompt. This is huge for agency work — it means you can explore directions with clients, change your mind, and the AI will cooperate. The key is using explicit positive framing (“show ONLY the bag”) alongside negative instructions (“no hat, no cap”).
3. Iteration Chains Are Completely Isolated
This is the most operationally significant finding. Chain B had zero contamination from Chain A. No red caps, no coffee mugs, no campsite. The logo style from Chain B’s source image was preserved perfectly. Each image in your project grid has its own independent memory. The project is just an organizational container.
The Operational Playbook We’re Now Using
Based on these findings, here’s the workflow we’ve adopted for client brand asset production:
Step 1: Generate your anchor asset. Create the logo or hero image. Generate 4 variants, pick the best one.
Step 2: Keep chains short. 3-5 iterations maximum per chain. At this depth, everything remains controllable.
Step 3: Branch for each application. Logo → product mockup is one chain. Logo → social media banner is a new chain. Logo → billboard is a new chain. The isolation means each application gets a clean start with no baggage.
Step 4: Use Ingredients for cross-chain consistency. Flow’s @ referencing system lets you lock a brand asset as a reusable Ingredient. This is your AI brand guide — reference it in every new chain to maintain identity.
Step 5: Never fight the model past 5 iterations. If artifacts are persisting despite removal prompts, don’t iterate further. Save your best output, start a fresh chain from it, and you’ll have a clean slate.
What This Means for Agency Economics
Image generation in Flow is free (0 credits for Nano Banana 2). The iteration system is fast (20-30 seconds per batch of 4). And the brand consistency is high enough for mockup, concept, and internal review work. This doesn’t replace a senior designer for final deliverables, but it compresses the concepting and iteration phase from hours to minutes.
For agencies managing 10+ brands, the combination of chain isolation and Ingredient locking means you can run parallel brand pipelines without any risk of cross-contamination. That’s a workflow that didn’t exist six months ago.
The full technical white paper with detailed methodology is available upon request.
{
“@context”: “https://schema.org”,
“@type”: “Article”,
“headline”: “We Tested Google Flow for Brand Asset Production — Heres What Actually Works”,
“description”: “We ran controlled experiments on Google Flow’s iteration system to answer the question every agency needs answered: can AI maintain brand consistency acro”,
“datePublished”: “2026-04-03”,
“dateModified”: “2026-04-03”,
“author”: {
“@type”: “Person”,
“name”: “Will Tygart”,
“url”: “https://tygartmedia.com/about”
},
“publisher”: {
“@type”: “Organization”,
“name”: “Tygart Media”,
“url”: “https://tygartmedia.com”,
“logo”: {
“@type”: “ImageObject”,
“url”: “https://tygartmedia.com/wp-content/uploads/tygart-media-logo.png”
}
},
“mainEntityOfPage”: {
“@type”: “WebPage”,
“@id”: “https://tygartmedia.com/google-flow-brand-asset-production-testing/”
}
}


![Private Jet Charter Photos — Luxury Aviation Visual Guide [2026]](https://tygartmedia.com/wp-content/uploads/2026/03/private-jet-tarmac-sunset.webp)


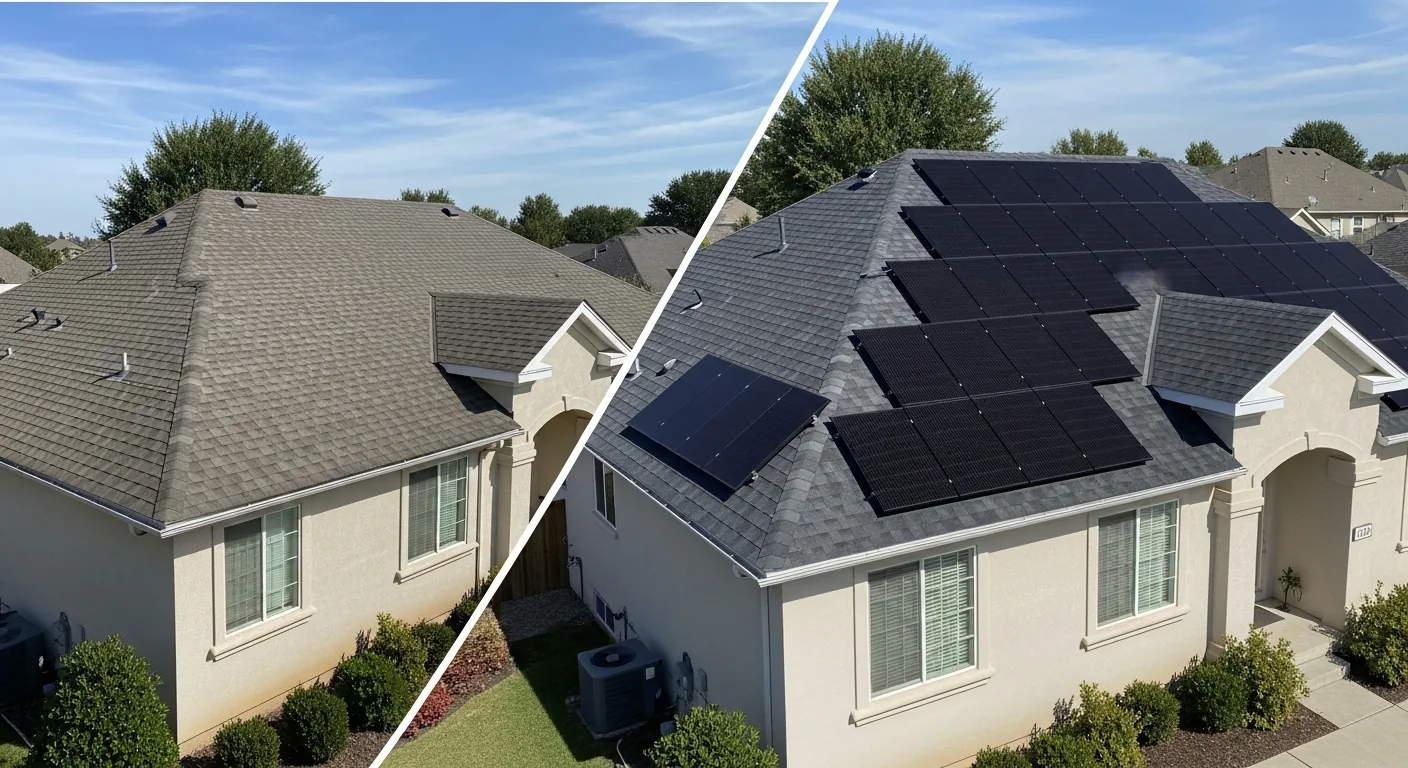
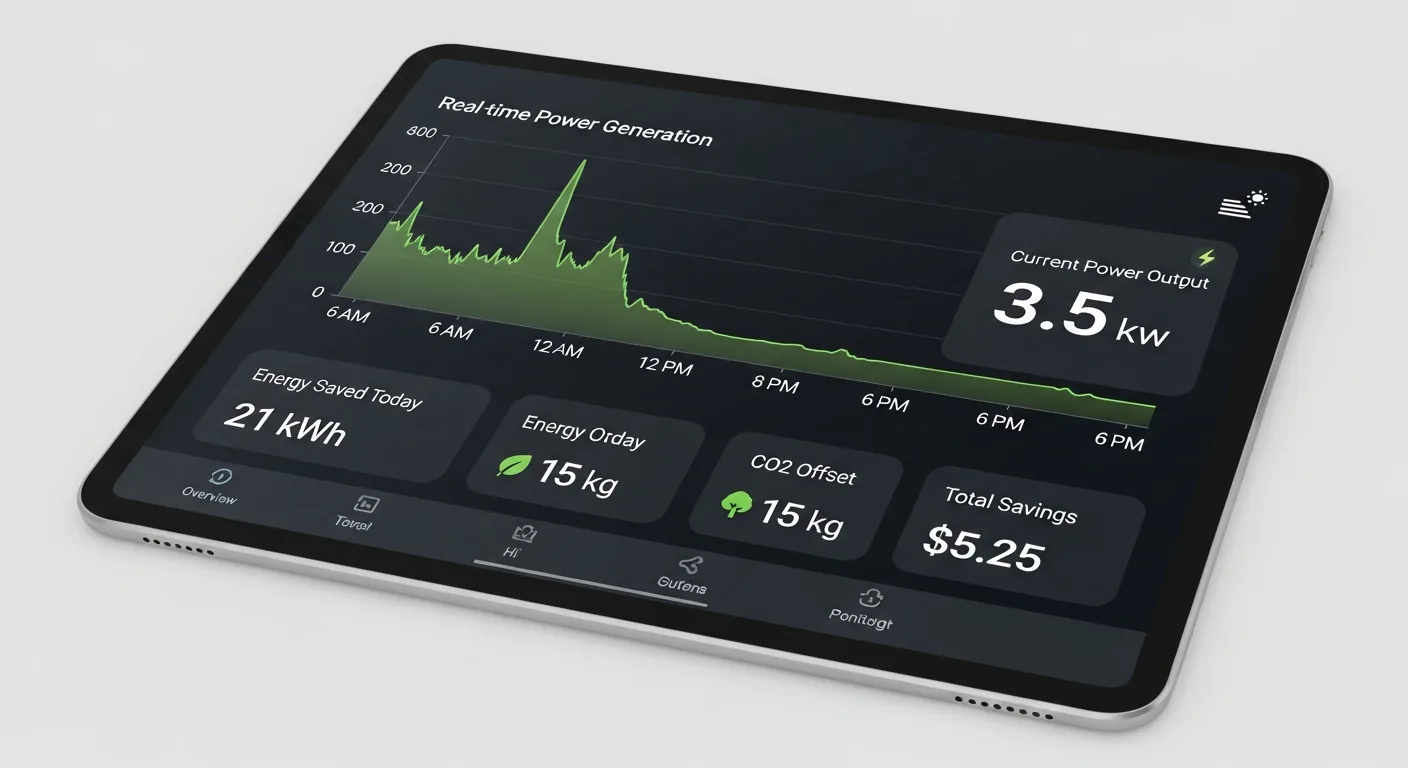
![Solar Panel Installation Photos — Complete Visual Guide [2026]](https://tygartmedia.com/wp-content/uploads/2026/03/residential-solar-panel-rooftop-aerial.webp)


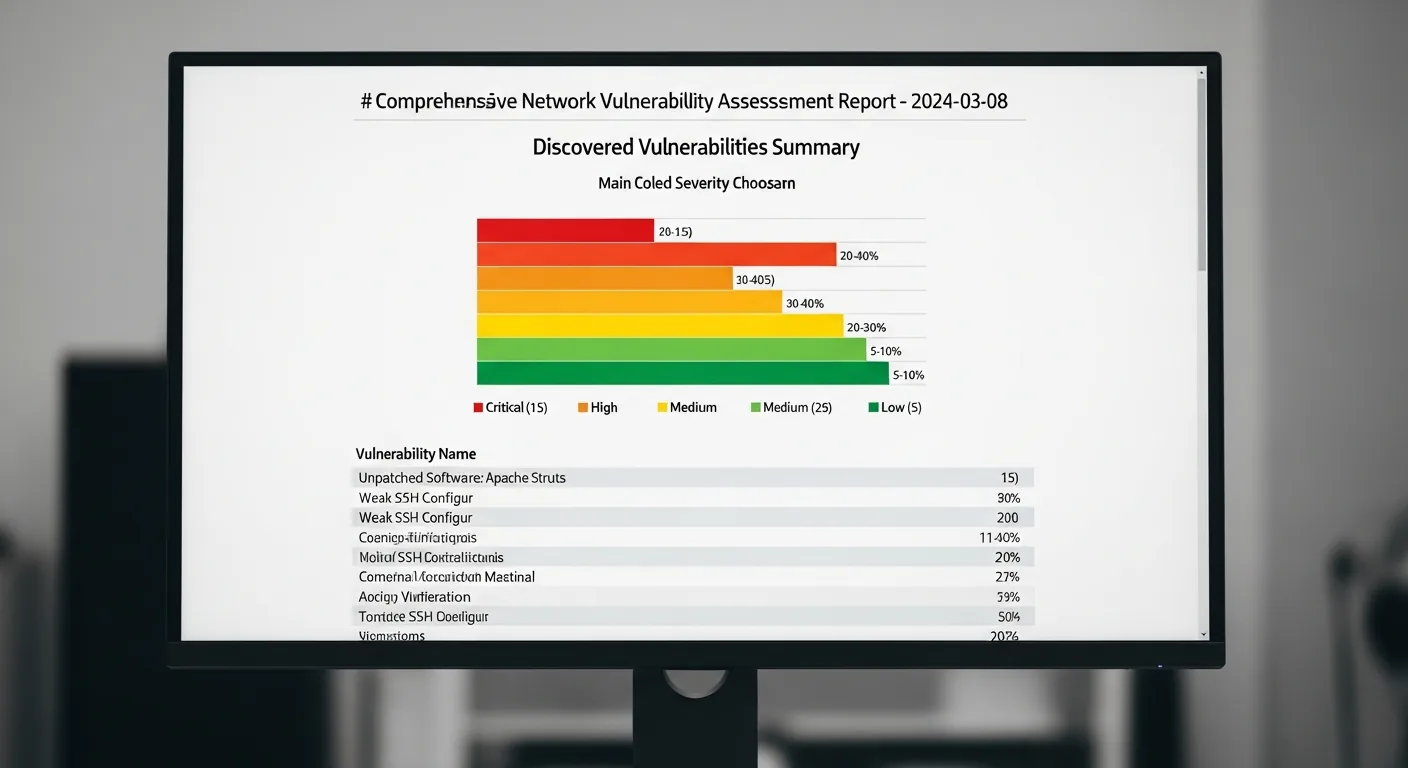
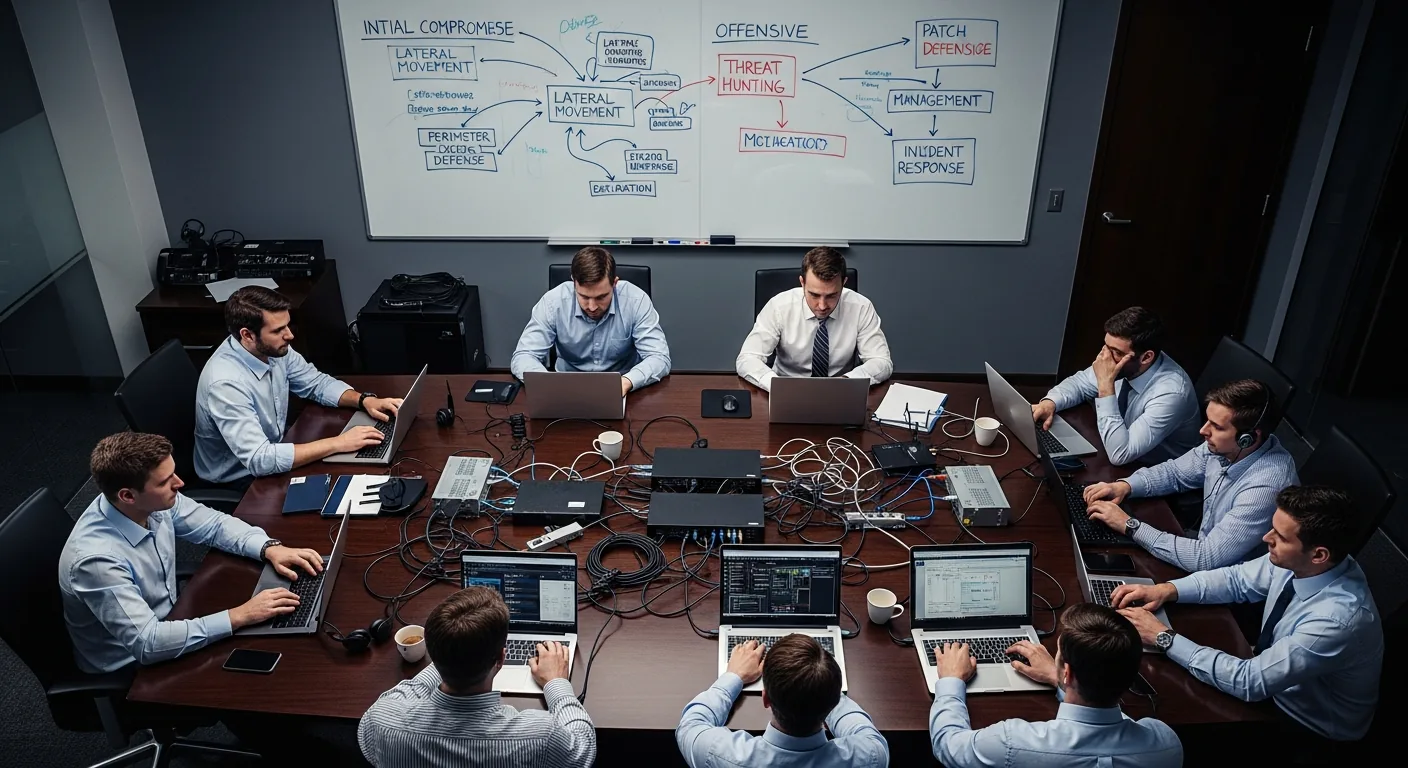
![Penetration Testing Photos — Tools, Environments & Methodology Visual Guide [2026]](https://tygartmedia.com/wp-content/uploads/2026/03/penetration-testing-security-operations-center.webp)


![Water Damage Restoration Photos — Complete Visual Guide [2026]](https://tygartmedia.com/wp-content/uploads/2026/03/water-damage-flooded-living-room.webp)