This image is part of the Article Hero Images collection in the Tygart Media visual library. Every image produced by Tygart Media is AI-generated using Google Vertex AI (Imagen), converted to WebP format, and injected with full IPTC/XMP metadata before publication.
Technical Details
Format: WEBP
Collection: Article Hero Images
Media ID: 358
Pipeline: Vertex AI Imagen → WebP → IPTC/XMP → WordPress
Image Licensing
All images in the Tygart Media visual library are produced in-house using AI image generation and are owned by Tygart Media.
The WP Proxy Pattern: How We Route 19 WordPress Sites Through One Cloud Run Endpoint
About This Image
This image is part of the Article Hero Images collection in the Tygart Media visual library. Every image produced by Tygart Media is AI-generated using Google Vertex AI (Imagen), converted to WebP format, and injected with full IPTC/XMP metadata before publication.
Technical Details
Format: WEBP
Collection: Article Hero Images
Media ID: 357
Pipeline: Vertex AI Imagen → WebP → IPTC/XMP → WordPress
Image Licensing
All images in the Tygart Media visual library are produced in-house using AI image generation and are owned by Tygart Media.
This image is part of the Article Hero Images collection in the Tygart Media visual library. Every image produced by Tygart Media is AI-generated using Google Vertex AI (Imagen), converted to WebP format, and injected with full IPTC/XMP metadata before publication.
Technical Details
Format: WEBP
Collection: Article Hero Images
Media ID: 355
Pipeline: Vertex AI Imagen → WebP → IPTC/XMP → WordPress
Image Licensing
All images in the Tygart Media visual library are produced in-house using AI image generation and are owned by Tygart Media.
LinkedIn Isn’t Dead — Your Posts Just Aren’t Saying Anything
About This Image
This image is part of the Article Hero Images collection in the Tygart Media visual library. Every image produced by Tygart Media is AI-generated using Google Vertex AI (Imagen), converted to WebP format, and injected with full IPTC/XMP metadata before publication.
Technical Details
Format: WEBP
Collection: Article Hero Images
Media ID: 352
Pipeline: Vertex AI Imagen → WebP → IPTC/XMP → WordPress
Image Licensing
All images in the Tygart Media visual library are produced in-house using AI image generation and are owned by Tygart Media.
The Knowledge Cluster: 5 Sites, One VM, Zero Overlap
About This Image
This image is part of the Article Hero Images collection in the Tygart Media visual library. Every image produced by Tygart Media is AI-generated using Google Vertex AI (Imagen), converted to WebP format, and injected with full IPTC/XMP metadata before publication.
Technical Details
Format: WEBP
Collection: Article Hero Images
Media ID: 350
Pipeline: Vertex AI Imagen → WebP → IPTC/XMP → WordPress
Image Licensing
All images in the Tygart Media visual library are produced in-house using AI image generation and are owned by Tygart Media.
UCP Is Here: What Google’s Universal Commerce Protocol Means for AI Agents
About This Image
This image is part of the Article Hero Images collection in the Tygart Media visual library. Every image produced by Tygart Media is AI-generated using Google Vertex AI (Imagen), converted to WebP format, and injected with full IPTC/XMP metadata before publication.
Technical Details
Format: WEBP
Collection: Article Hero Images
Media ID: 334
Pipeline: Vertex AI Imagen → WebP → IPTC/XMP → WordPress
Image Licensing
All images in the Tygart Media visual library are produced in-house using AI image generation and are owned by Tygart Media.
This image is part of the Article Hero Images collection in the Tygart Media visual library. Every image produced by Tygart Media is AI-generated using Google Vertex AI (Imagen), converted to WebP format, and injected with full IPTC/XMP metadata before publication.
Technical Details
Format: WEBP
Collection: Article Hero Images
Media ID: 332
Pipeline: Vertex AI Imagen → WebP → IPTC/XMP → WordPress
Image Licensing
All images in the Tygart Media visual library are produced in-house using AI image generation and are owned by Tygart Media.
Private jet charter represents the ultimate in luxury travel — bypassing commercial airports entirely for a seamless door-to-door experience. With hourly rates ranging from $3,000 for light jets to $15,000+ for ultra-long-range heavy aircraft, the private aviation industry generates over $30 billion annually in the United States alone. This photo gallery takes you inside the world of private jet charter — from the tarmac and cockpit to the luxury cabin and FBO terminal.
Private Jet Charter Photo Gallery
Private jet ready for departure at sunset — large-cabin aircraft representing the pinnacle of charter aviationUltra-luxury cabin: Hand-stitched leather, exotic wood veneer, and full champagne serviceState-of-the-art glass cockpit: Modern avionics suite enabling transcontinental flight capabilityCruising at 45,000 feet: Private jets fly above commercial traffic for faster, smoother flightsFixed Base Operator (FBO) private terminal — bypassing commercial airports entirelyOnboard bedroom suite on ultra-long-range aircraft — sleeping flat on transcontinental flightsCharter fleet: Light jets to heavy long-range aircraft available for immediate departureThe private jet experience: Door-to-door luxury with red carpet boarding and personal ground crew
Understanding Private Jet Categories
Private jets are classified into categories based on size, range, and cabin configuration. Very Light Jets (VLJs) like the Cessna Citation M2 carry 4-5 passengers up to 1,200 nautical miles. Light jets like the Phenom 300 accommodate 6-8 passengers with 2,000 nm range. Midsize jets like the Citation Latitude offer stand-up cabins for 8-9 passengers. Super-midsize aircraft like the Challenger 350 provide coast-to-coast range. Heavy jets like the Gulfstream G650 deliver transcontinental capability for 12-16 passengers. Ultra-long-range aircraft like the Global 7500 and Gulfstream G700 can fly 7,500+ nm nonstop — New York to Tokyo — with full bedroom suites, showers, and conference rooms.
The Private Jet Charter Experience
Charter passengers arrive at a Fixed Base Operator (FBO) — a private terminal with luxury lounges, concierge service, and direct tarmac access. There are no TSA security lines, no boarding groups, and no checked baggage restrictions. Passengers drive directly to their aircraft, with luggage loaded by ground crew. Most FBOs offer catering, ground transportation coordination, customs pre-clearance for international flights, and pet-friendly policies. The entire experience from car to cabin takes under 15 minutes — compared to the 2-3 hours typical of commercial air travel.
Frequently Asked Questions About Private Jet Charter
How much does it cost to charter a private jet?
Charter costs vary by aircraft category: Light jets run $3,000-$6,000 per flight hour, midsize jets cost $4,500-$8,000/hour, super-midsize aircraft range from $6,000-$10,000/hour, and heavy/ultra-long-range jets command $8,000-$15,000+ per hour. A New York to Miami trip on a midsize jet costs approximately $18,000-$28,000 one-way. Empty leg flights — when aircraft reposition without passengers — are available at 25-75% discounts.
How far in advance should you book a private jet?
Same-day charter is possible through the spot market, though availability and pricing are less favorable. Optimal pricing requires 1-2 weeks advance notice. Peak travel periods — holidays, Super Bowl, Aspen ski season, Art Basel — may require 30+ days. Jet card and membership programs guarantee availability within 24-48 hours at fixed rates regardless of market conditions.
What is an FBO terminal?
A Fixed Base Operator (FBO) is a private aviation facility at an airport providing services exclusively to private jet passengers and crew. Premier FBOs like Signature Flight Support, Atlantic Aviation, and Jet Aviation offer luxury lounges, conference rooms, concierge services, customs/immigration processing, crew rest areas, aircraft fueling and maintenance, and direct ramp access. Passengers bypass the commercial terminal entirely — driving directly to their aircraft on the tarmac.
How many passengers can a private jet carry?
Passenger capacity ranges from 4 seats on very light jets to 19 seats on ultra-long-range heavy aircraft. Light jets (Phenom 300, Citation CJ4) carry 6-8 passengers. Midsize jets (Citation Latitude, Learjet 75) carry 8-9. Super-midsize (Challenger 350, Citation Longitude) carry 9-12. Heavy jets (Gulfstream G650, Falcon 8X) carry 12-16. The largest ultra-long-range aircraft like the Global 7500 and Gulfstream G700 accommodate up to 19 passengers in configurations that include bedrooms, showers, and full dining areas.
Solar panel installation has become the fastest-growing segment of the U.S. energy market, with residential installations exceeding 1 million homes annually. The average system costs $15,000 to $35,000 before the 30% federal tax credit, delivering 25-30 years of clean energy and typical payback periods of 6-10 years. This comprehensive photo gallery documents every aspect of solar installation — from aerial views of completed rooftop arrays to the technical details of micro-inverters, battery storage, and thermal inspection.
Solar Panel Installation Photo Gallery
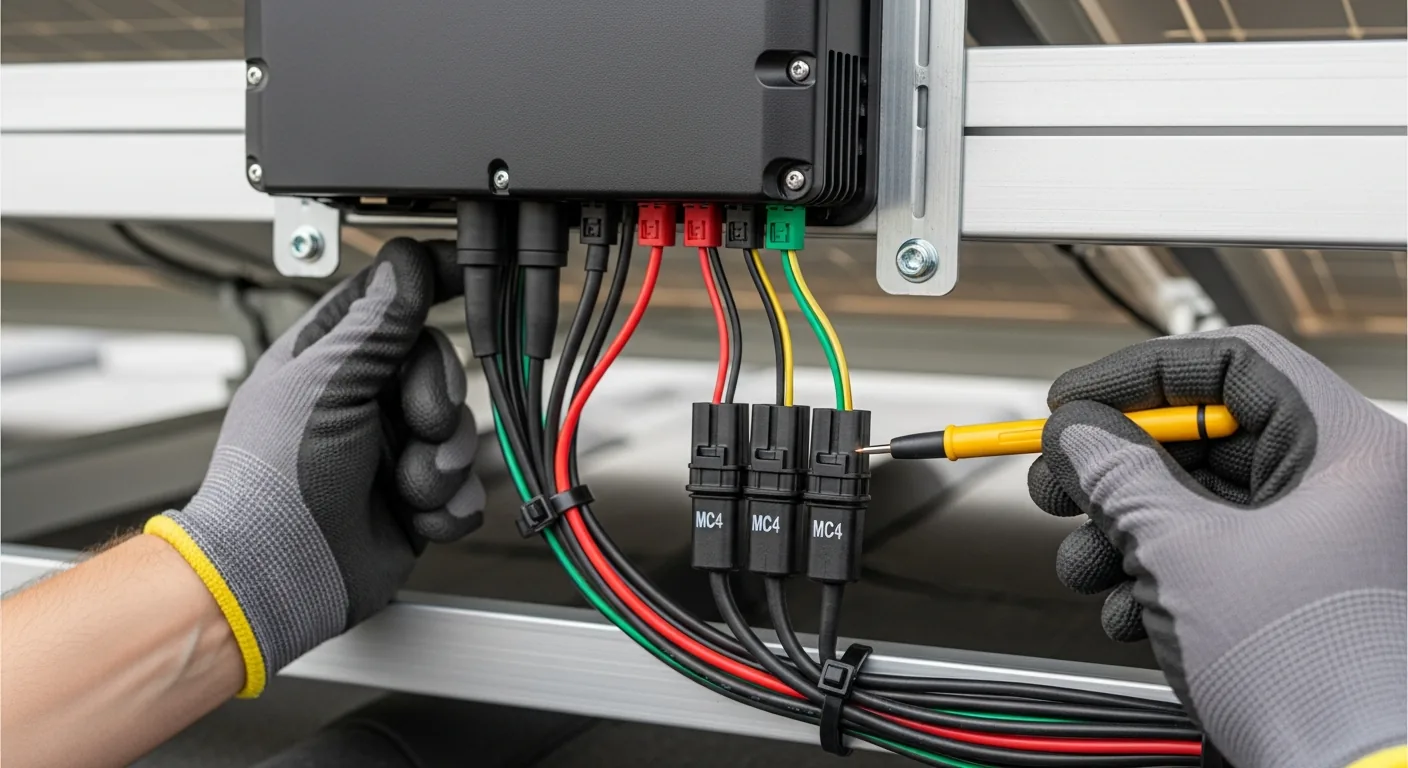
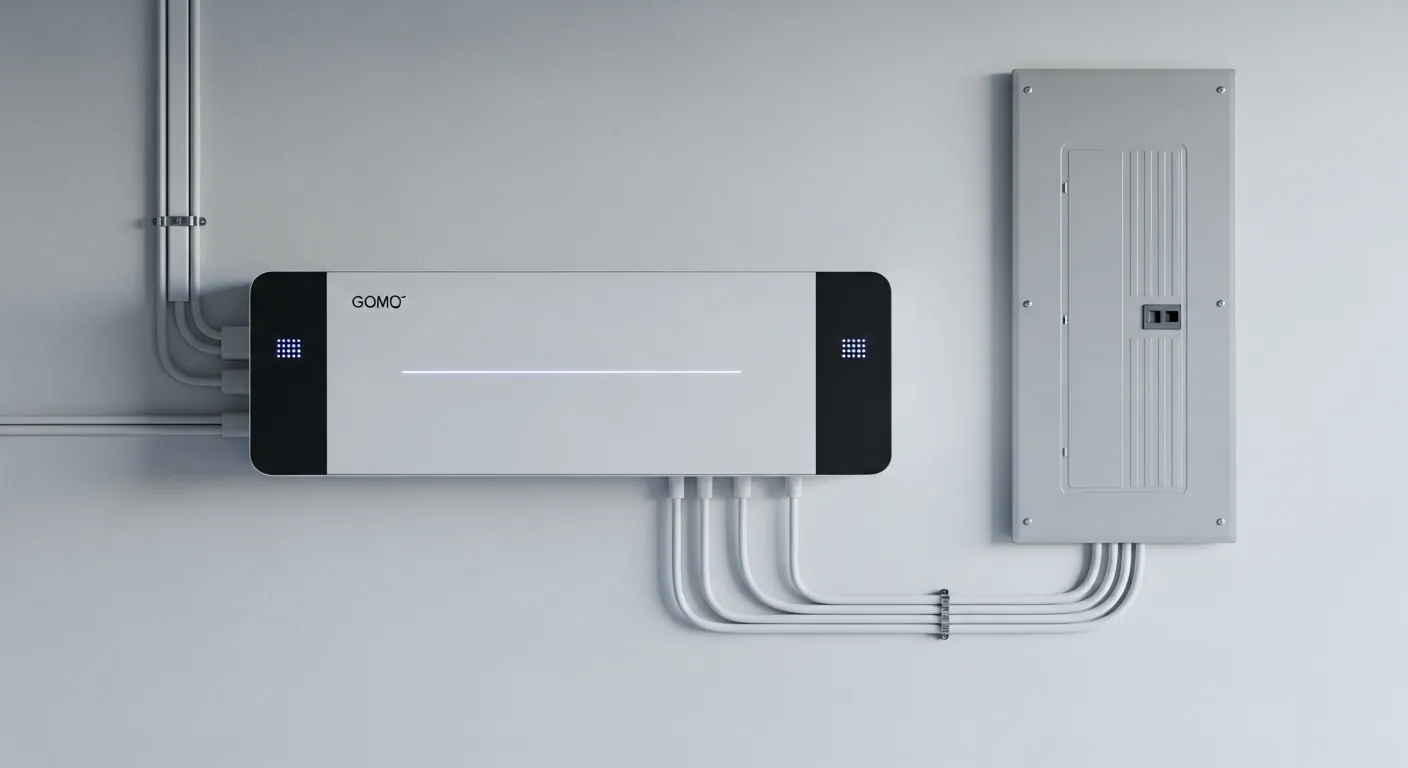
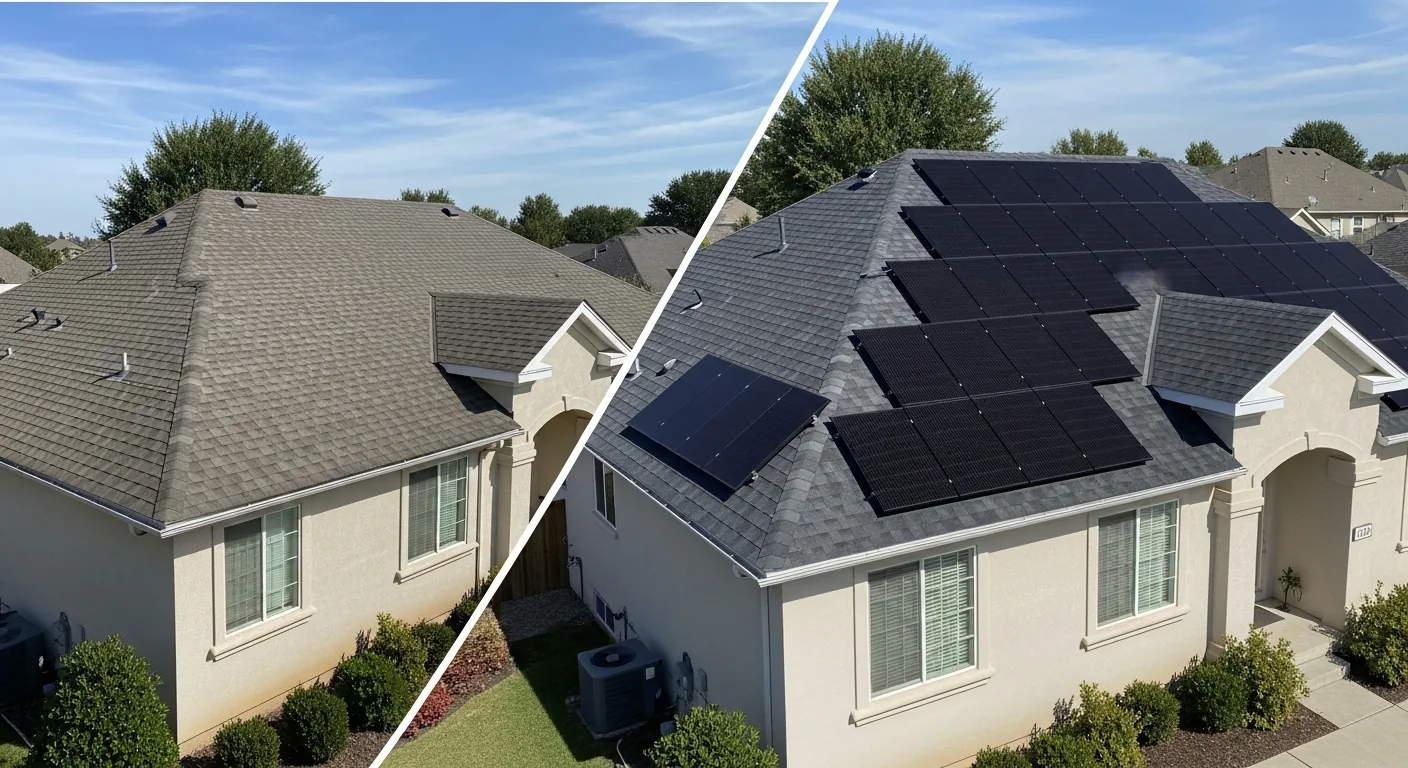
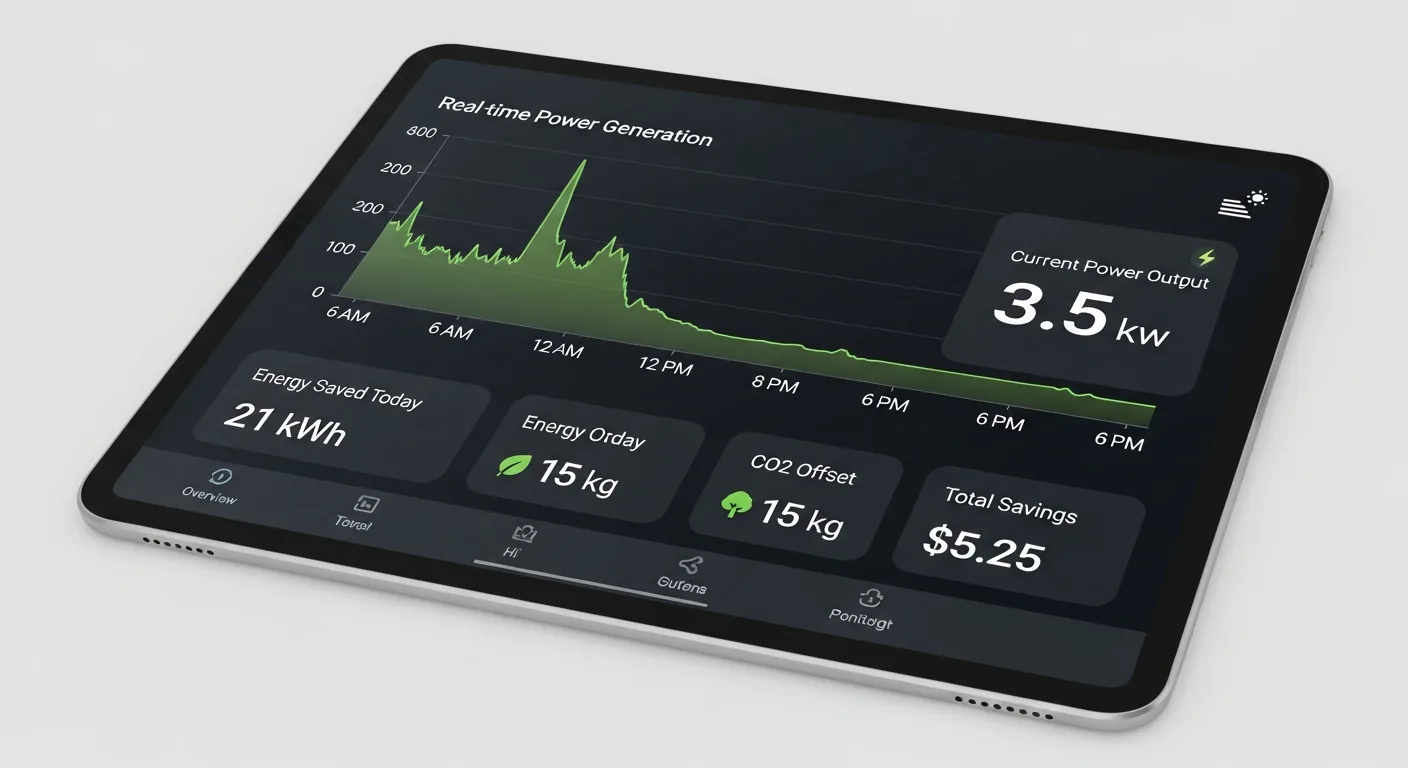
Residential rooftop solar installation — a typical 8kW system covering approximately 400 square feetProfessional installers securing photovoltaic panels to aluminum racking — proper safety equipment requiredUtility-scale solar farm generating megawatts of clean energy — the future of commercial power generationMicro-inverter and connector detail — the electrical backbone of a modern solar installationBattery storage integration paired with solar for 24/7 energy independenceThermal imaging inspection: Identifying underperforming cells and potential defects in solar arraysBefore and after: Modern all-black solar panels enhancing both energy production and curb appealReal-time solar monitoring: Tracking generation, consumption, and dollar savings from your installation
The Solar Installation Process
A professional solar installation follows a structured process: site assessment evaluates roof orientation, pitch, shading, and structural capacity; system design determines optimal panel placement using satellite imagery and shade analysis tools like Aurora Solar; permitting secures local building and electrical permits (typically 2-6 weeks); installation involves mounting racking systems, securing panels, running conduit, and connecting inverters (1-3 days); inspection by local building officials verifies code compliance; and interconnection with the utility company activates net metering and powers on the system. The total timeline from contract to activation averages 2-4 months.
Solar Technology: Panels, Inverters, and Battery Storage
Modern residential solar systems use monocrystalline silicon panels with efficiencies of 20-23%, producing 370-430 watts per panel. Inverter technology has evolved from single string inverters to microinverters (one per panel) and DC optimizers, which maximize output and enable panel-level monitoring. Battery storage systems like the Tesla Powerwall (13.5 kWh), Enphase IQ Battery (10.1 kWh), and Franklin WH (13.6 kWh) provide backup power and enable time-of-use arbitrage. The combination of solar panels and battery storage enables true energy independence — generating, storing, and consuming your own electricity 24/7.
Frequently Asked Questions About Solar Installation
How much do solar panels cost to install?
The average residential solar installation costs $15,000 to $35,000 before incentives, depending on system size and equipment quality. The federal Investment Tax Credit (ITC) reduces this by 30%, bringing net costs to $10,500-$24,500. Cost per watt installed ranges from $2.50 to $4.00. Premium panel brands like SunPower and REC command higher prices but offer superior warranties and efficiency.
How long does solar panel installation take?
Physical installation typically takes 1-3 days for a standard residential system. However, the complete process from signed contract to system activation — including engineering review, permitting, installation, inspection, and utility interconnection — takes 2-4 months in most markets. Permitting timelines vary significantly by jurisdiction.
Do solar panels work on cloudy days?
Yes. Solar panels generate electricity under cloud cover at 10-25% of rated capacity. Modern panels with half-cut cell technology and PERC (Passivated Emitter and Rear Contact) architecture perform significantly better in diffuse light than older poly-crystalline panels. Germany, one of the cloudiest countries in Europe, is also one of the world’s largest solar markets — proving that solar works effectively in less-than-ideal conditions.
How long do solar panels last?
Modern solar panels carry 25-30 year performance warranties guaranteeing at least 80-85% of original output at warranty end. Studies from NREL show most panels degrade at only 0.3-0.5% per year, meaning a panel producing 400W today will still produce 340-360W after 30 years. Panels continue generating power well beyond their warranty period. String inverters typically need replacement at 10-15 years ($1,500-$3,000), while microinverters carry 25-year warranties matching the panels.
Penetration testing — also known as ethical hacking or pen testing — is a controlled cyberattack simulation conducted against an organization’s systems, networks, and applications to identify exploitable vulnerabilities before malicious actors do. This visual guide provides a comprehensive gallery of penetration testing environments, tools, methodologies, and deliverables used by cybersecurity professionals worldwide. With average engagement costs ranging from $10,000 to $100,000+ for enterprise assessments, penetration testing represents one of the highest-value services in the cybersecurity industry.
Penetration Testing Photo Gallery: Tools, Environments, and Methodologies
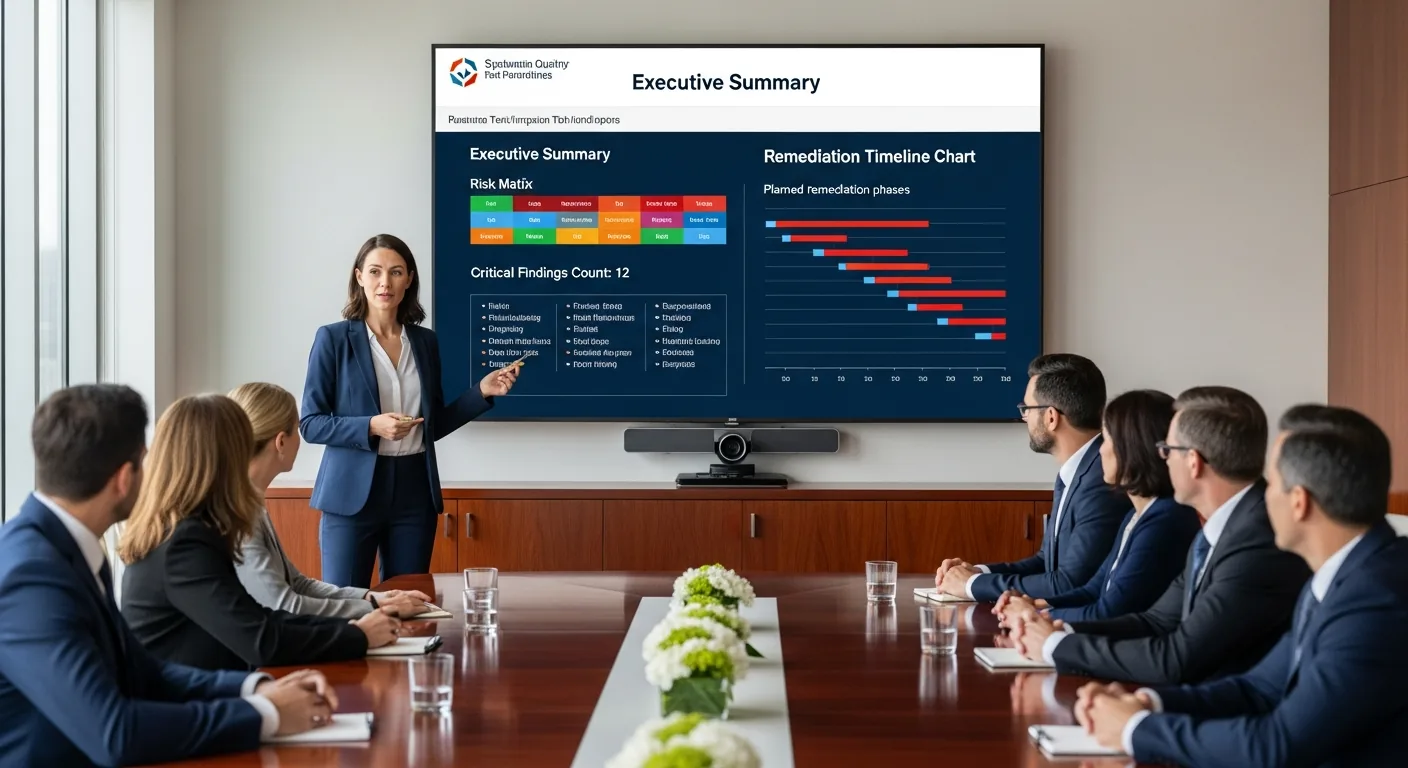
The following images document the complete penetration testing lifecycle — from the Security Operations Center where monitoring begins, through the ethical hacker’s workstation and toolkit, to the executive boardroom where findings are presented to stakeholders. Each image represents a critical phase of a professional penetration testing engagement.
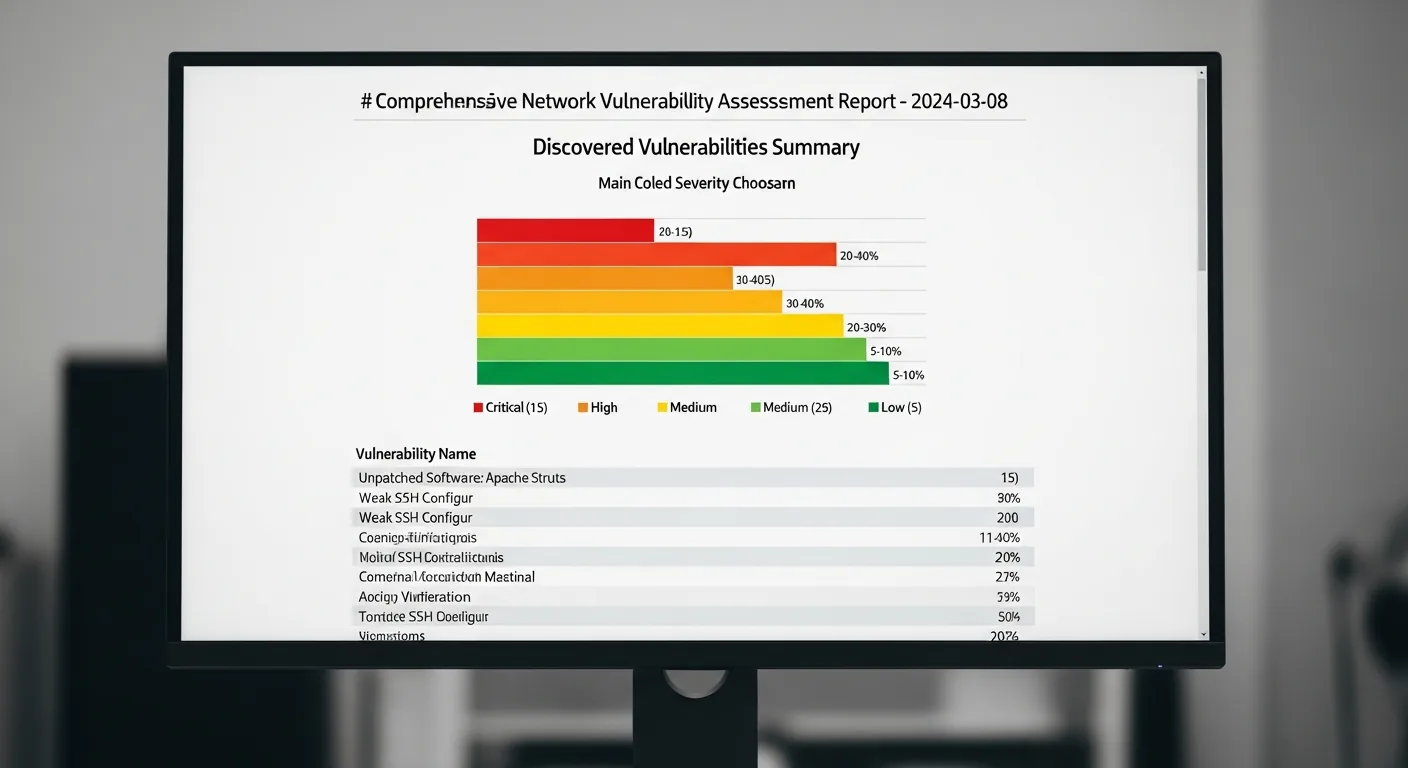
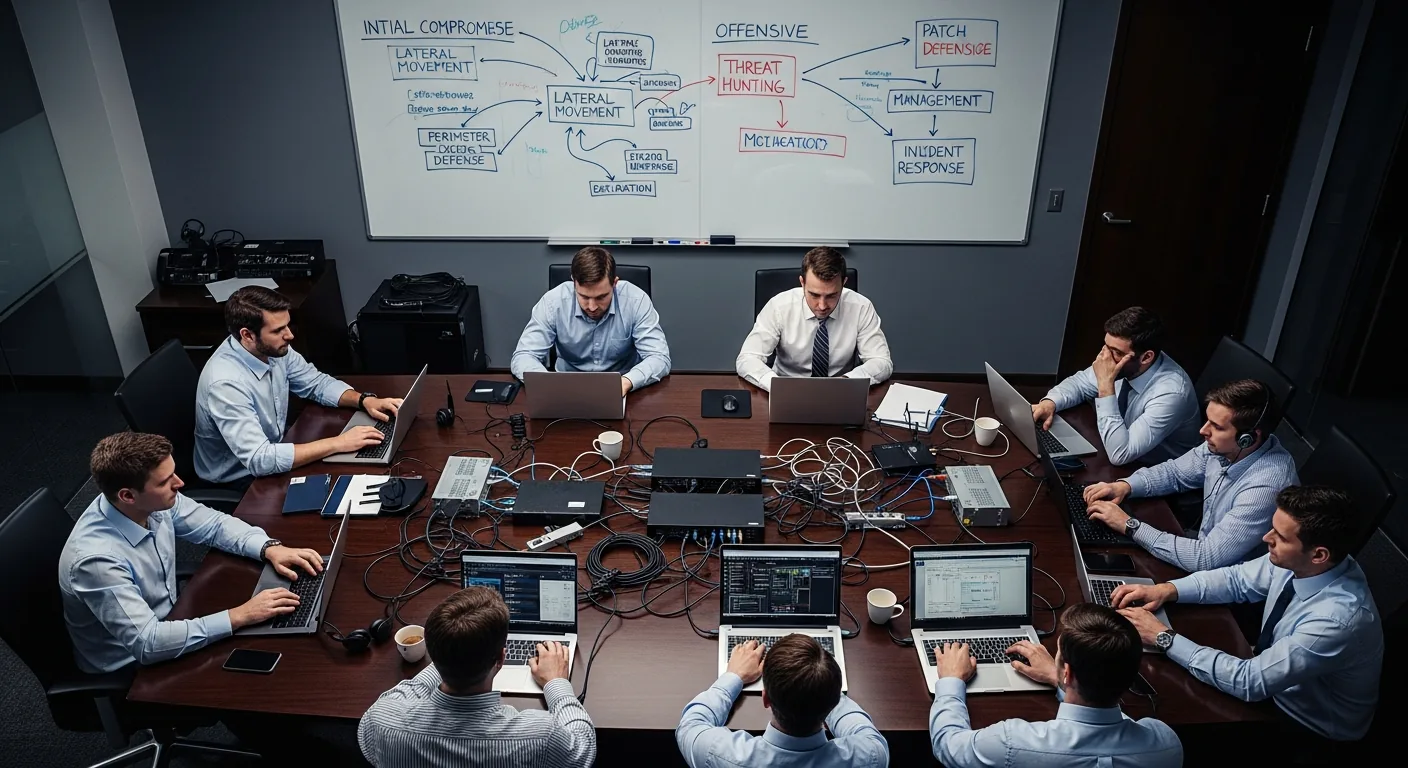
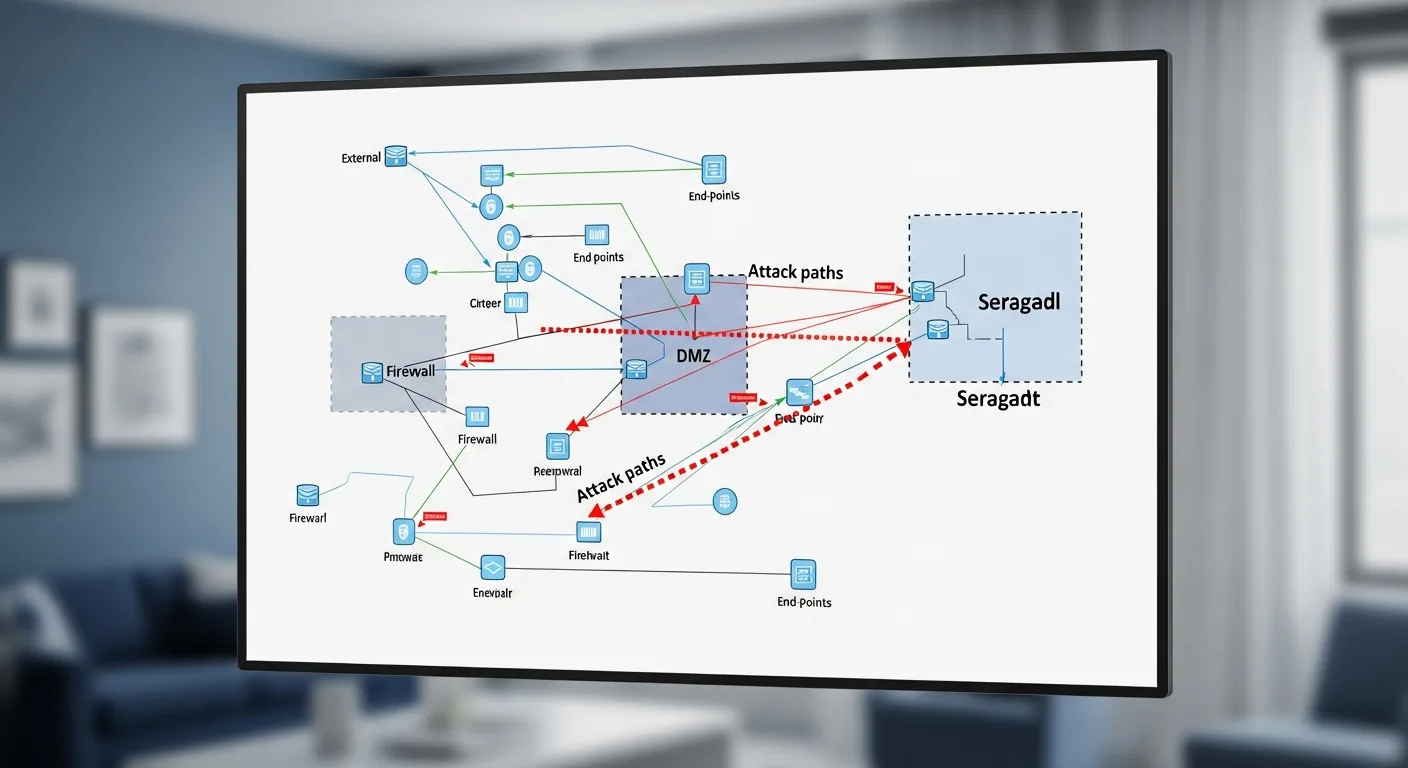
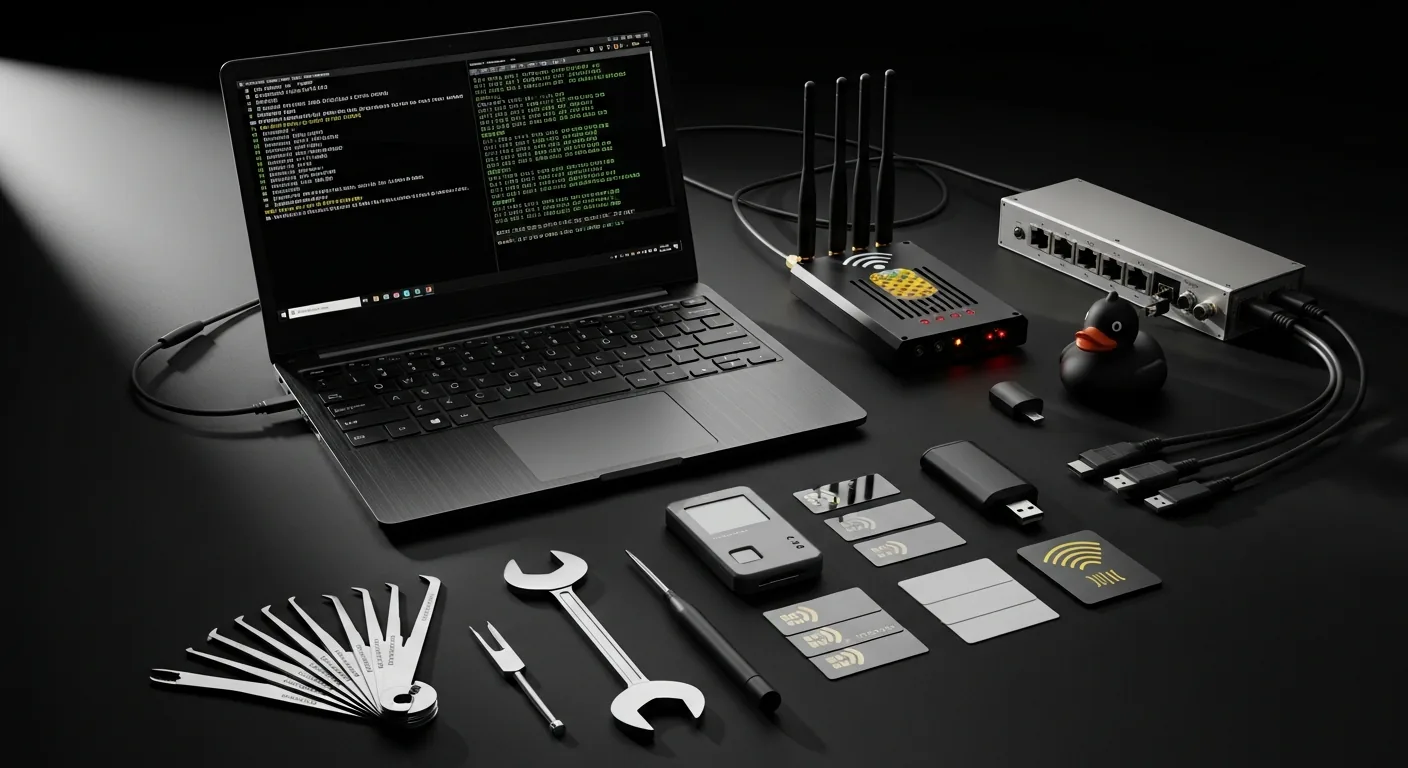
Security Operations Center (SOC) monitoring network traffic for vulnerabilities during a penetration testPenetration tester workstation running Kali Linux with active vulnerability scanning toolsVulnerability scan results with CVSS severity scoring — critical findings highlighted in redRed team vs blue team exercise: Simulating real-world attack and defense scenariosEnterprise server rack — a common target during network penetration testing engagementsNetwork topology with identified attack paths — mapping the route from perimeter to critical assetsProfessional penetration testing toolkit: WiFi Pineapple, USB implants, RFID cloner, and bypass toolsDelivering penetration test findings: Executive summary with risk matrix and remediation roadmap
The Five Phases of Penetration Testing
Professional penetration testing follows a structured methodology defined by frameworks like the PTES (Penetration Testing Execution Standard) and OWASP Testing Guide. The five phases are: Reconnaissance (passive and active information gathering about the target), Scanning (port scanning, vulnerability scanning, and service enumeration using tools like Nmap and Nessus), Exploitation (attempting to breach identified vulnerabilities using frameworks like Metasploit), Post-Exploitation (privilege escalation, lateral movement, and data exfiltration simulation), and Reporting (documenting findings with CVSS severity scores and remediation recommendations).
Red Team vs Blue Team: Adversarial Security Testing
Beyond traditional penetration testing, many organizations conduct red team engagements — extended adversarial simulations where an offensive team (red) attempts to breach the organization’s defenses while the defensive team (blue) works to detect and respond to the attacks in real time. Purple team exercises combine both perspectives, with the red team sharing techniques and the blue team improving detection capabilities. These exercises test not just technical controls but also the organization’s incident response procedures, employee security awareness, and communication protocols under pressure.
Essential Penetration Testing Tools and Equipment
A professional penetration tester’s arsenal includes both software and hardware tools. On the software side, Kali Linux serves as the primary operating system, bundling over 600 security tools including Burp Suite for web application testing, Metasploit for exploitation, Wireshark for network analysis, and John the Ripper for password cracking. Physical penetration testing adds hardware devices like the WiFi Pineapple for wireless attacks, USB Rubber Ducky for keystroke injection, Proxmark for RFID cloning, and traditional lock picks for physical access testing. The complete toolkit shown in this gallery represents approximately $5,000-$15,000 in equipment investment.
Frequently Asked Questions About Penetration Testing
How much does a penetration test cost?
Penetration testing costs vary significantly based on scope, complexity, and the type of assessment. A basic web application pen test typically ranges from $5,000 to $25,000. A comprehensive network penetration test for a mid-size enterprise costs $15,000 to $50,000. Red team engagements with physical testing, social engineering, and extended timelines can exceed $100,000. Organizations in regulated industries like healthcare (HIPAA), finance (PCI DSS), and government (FedRAMP) often require annual penetration testing as a compliance requirement.
What is the difference between a vulnerability scan and a penetration test?
A vulnerability scan is an automated process that identifies known vulnerabilities in systems using databases like the CVE (Common Vulnerabilities and Exposures) list — it finds potential weaknesses but does not attempt to exploit them. A penetration test goes further by having skilled security professionals actively attempt to exploit those vulnerabilities, chain multiple findings together, and demonstrate the real-world impact of a successful attack. Vulnerability scans cost $1,000-$5,000 and take hours; penetration tests cost $10,000-$100,000+ and take days to weeks.
How often should an organization conduct penetration testing?
Industry best practice and most compliance frameworks recommend penetration testing at least annually, with additional testing after significant infrastructure changes, application deployments, or security incidents. Organizations handling sensitive data should consider quarterly testing. PCI DSS requires annual penetration testing and retesting after significant changes. Many mature security programs implement continuous penetration testing programs that combine automated scanning with periodic manual assessments.
What certifications should a penetration tester hold?
The most respected penetration testing certifications include OSCP (Offensive Security Certified Professional), widely considered the gold standard due to its hands-on 24-hour exam; GPEN (GIAC Penetration Tester) from SANS; CEH (Certified Ethical Hacker) from EC-Council; and CREST CRT/CCT recognized internationally. For web application testing specifically, the OSWE (Offensive Security Web Expert) and BSCP (Burp Suite Certified Practitioner) are highly valued. When selecting a penetration testing firm, verify that their testers hold at minimum OSCP or equivalent hands-on certifications.


![Private Jet Charter Photos — Luxury Aviation Visual Guide [2026]](https://tygartmedia.com/wp-content/uploads/2026/03/private-jet-tarmac-sunset.webp)


![Solar Panel Installation Photos — Complete Visual Guide [2026]](https://tygartmedia.com/wp-content/uploads/2026/03/residential-solar-panel-rooftop-aerial.webp)


![Penetration Testing Photos — Tools, Environments & Methodology Visual Guide [2026]](https://tygartmedia.com/wp-content/uploads/2026/03/penetration-testing-security-operations-center.webp)