Tag: Technical SEO

  • LLMs.txt Spec: 2026 Guide, Robots.txt Rules & Verification

    LLMs.txt Spec: 2026 Guide, Robots.txt Rules & Verification

    If you publish an llms.txt file this week, no major model is going to fetch it tonight. That is the honest 2026 read on the spec — and yet the file is still worth shipping for narrow, specific reasons. This guide covers the 4-element specification published at llmstxt.org, the robots.txt pairing that actually controls AI crawler behavior right now, and a server-log filter you can run to verify whether anyone is reading the file you just shipped.

    What llms.txt actually is (and what it isn’t)

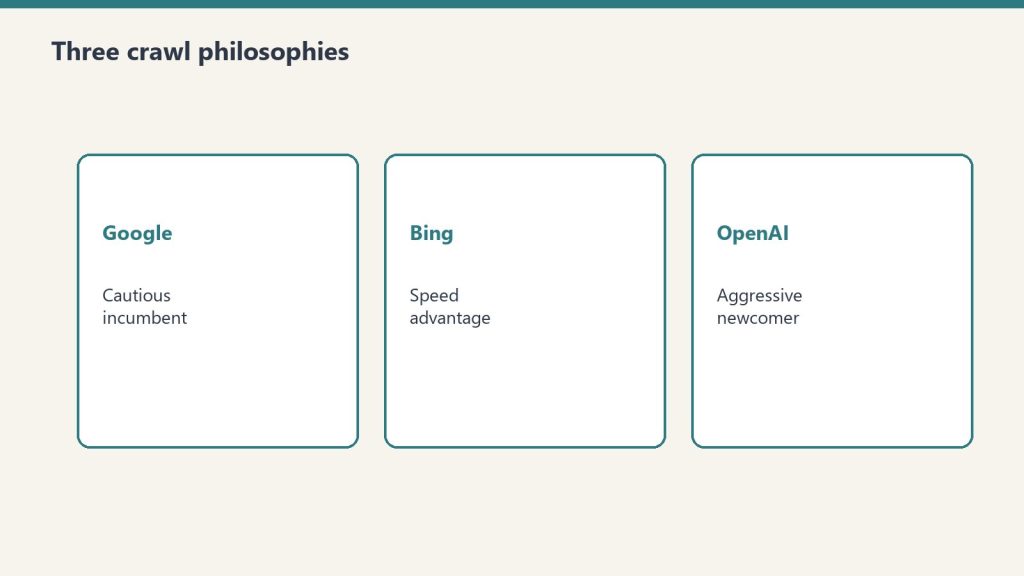
    Three cards for Google cautious, Bing speed, OpenAI aggressive crawl styles
    What llms.txt actually is — and isn’t.

    llms.txt is a Markdown file served at the site root — /llms.txt — proposed by Jeremy Howard of Answer.AI on September 3, 2024. The spec at llmstxt.org defines four elements: a required H1 with the project or site name; a blockquote summary; zero or more Markdown content sections (no headings); and zero or more H2-delimited file-list sections containing annotated Markdown links to deeper content. That is the entire specification. There is no header convention, no schema requirement, no robots-style allow/deny syntax.

    What llms.txt is not: it is not a substitute for robots.txt, it is not an access-control mechanism, and as of May 2026 it is not consumed at inference time by ChatGPT, Claude, Gemini, Perplexity, or Copilot in any documented production system. Server-log audits across multiple independent practitioners show GPTBot, ClaudeBot, and Google-Extended do not request /llms.txt in meaningful volume during routine crawls.

    The realistic 2026 use case is developer tooling. AI coding assistants and IDE agents — Cursor, GitHub Copilot, Claude Code, and similar tools — retrieve docs in real time, and a curated llms.txt cuts token waste by pointing them at canonical Markdown sources instead of HTML-rendered pages bloated with nav and tracking. Companies like Anthropic, Stripe, Cursor, Cloudflare, Vercel, Mintlify, Supabase, and LangGraph ship llms.txt for that reason.

    The 4-element template — a working example

    Here is a real, valid llms.txt for a hypothetical SaaS docs site. Copy this structure, change the project name, and you have a shippable file in under 30 minutes:

    # Acme Analytics
    
    > Acme Analytics is a self-hosted product analytics platform for SaaS teams. This file points AI assistants and IDE agents at canonical Markdown documentation, not the rendered HTML.
    
    Authoritative Markdown sources for product, API, and SDK documentation. Use the `.md` variant of any docs page (append `.md` to the URL) for a clean, agent-friendly version.
    
    ## Getting Started
    
    - [Quickstart](https://acme.example/docs/quickstart.md): 10-minute setup, install through first event.
    - [Concepts](https://acme.example/docs/concepts.md): events, properties, identities, sessions — definitions and examples.
    
    ## API Reference
    
    - [REST API Reference](https://acme.example/docs/api/rest.md): every endpoint, request/response schema, rate limits.
    - [Webhook Reference](https://acme.example/docs/api/webhooks.md): payload contracts and retry behavior.
    
    ## SDKs
    
    - [JavaScript SDK](https://acme.example/docs/sdk/js.md): browser and Node, including server-side rendering notes.
    - [Python SDK](https://acme.example/docs/sdk/python.md): server-side ingestion patterns.
    
    ## Optional
    
    - [Changelog](https://acme.example/docs/changelog.md): version history, breaking changes flagged inline.
    

    Two practitioner notes. First, the spec uses an “Optional” H2 as a soft signal — links under that heading can be skipped by aggressive token budgets. Second, the file is most useful when every linked URL has a parallel .md Markdown version. If your site is pure HTML, llms.txt without paired Markdown does little.

    The robots.txt pairing — this is what actually controls AI bots today

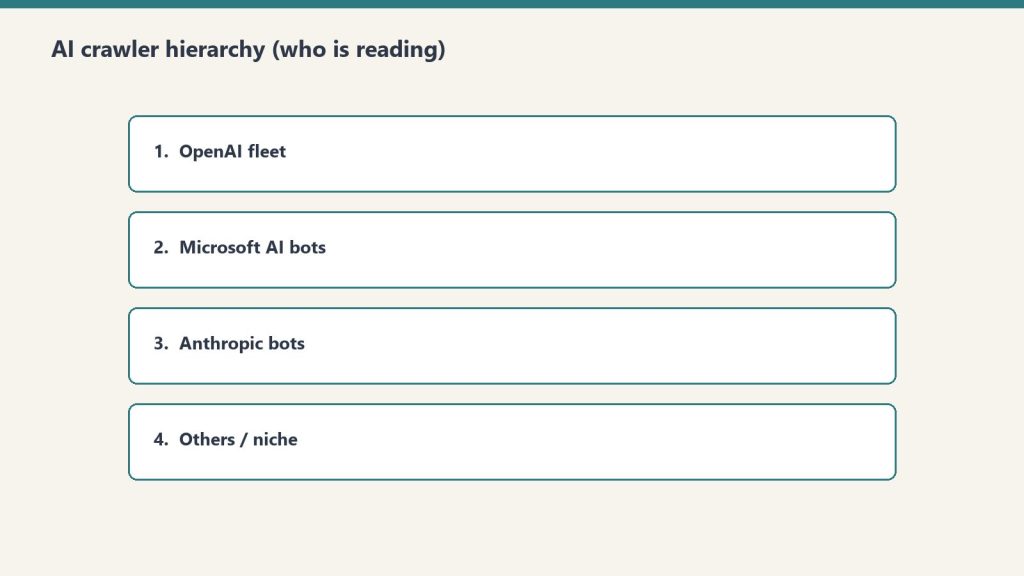
    Four ranked rows of AI crawler fleets reading publisher content
    robots.txt pairing — what controls AI bots today.

    The lever that meaningfully controls AI crawler behavior in 2026 is robots.txt with user-agent–specific rules. Anthropic publishes official documentation for three bots — ClaudeBot for training, Claude-User for user-initiated fetches, and Claude-SearchBot for search indexing — and confirms all three honor robots.txt. OpenAI runs GPTBot (training) and OAI-SearchBot (live ChatGPT search). Google’s AI training opt-out is the Google-Extended user-agent. Perplexity uses PerplexityBot.

    The two-bucket pattern most practitioner sites should ship: block training-only crawlers, allow search and user-initiated retrieval so your content can still be cited in answers.

    # Allow AI search and user-fetch traffic (citations, attribution)
    User-agent: Claude-SearchBot
    Allow: /
    
    User-agent: Claude-User
    Allow: /
    
    User-agent: OAI-SearchBot
    Allow: /
    
    User-agent: PerplexityBot
    Allow: /
    
    # Block training-only crawlers
    User-agent: ClaudeBot
    Disallow: /
    
    User-agent: GPTBot
    Disallow: /
    
    User-agent: Google-Extended
    Disallow: /
    
    # Standard search crawler — leave open
    User-agent: Googlebot
    Allow: /
    
    Sitemap: https://example.com/sitemap.xml
    

    One operational caveat: robots.txt is policy, not enforcement. Anthropic, OpenAI, and Google have all publicly committed their named bots to compliance, but unnamed scrapers and residential-IP harvesters routinely ignore it. For sites with sensitive content, pair robots.txt with WAF or Cloudflare bot-management rules at the edge.

    Structured data still does more heavy lifting than llms.txt

    If your goal is AI citation rather than IDE-agent retrieval, structured data on the page itself moves the needle more than llms.txt. The minimum stack for any article you want cited: Article schema with named author and publisher, FAQPage schema on any post that answers a discrete question, and speakable markup on the answer paragraphs. These get parsed during normal HTML fetches by every major AI crawler — no separate file required.

    How to verify your llms.txt is actually being read

    Desk with laptop, checklist notebook, and billing card ready before creating an Anthropic API key
    How to verify llms.txt is being read.

    Ship the file, then run this server-log filter weekly for 30 days. On any standard access-log format (nginx, Apache, or a Cloudflare log push), grep for requests to /llms.txt and break them down by user-agent:

    grep "GET /llms.txt" /var/log/nginx/access.log \
      | awk -F\" '{print $6}' \
      | sort | uniq -c | sort -rn
    

    What you will almost certainly see in May 2026: a steady trickle of human curl requests, the occasional IDE agent fetch tagged with a Cursor or VS Code user-agent, and effectively zero hits from GPTBot, ClaudeBot, or Google-Extended. That null result is itself the measurement — it tells you llms.txt is a developer-experience asset right now, not an AI-citation asset, and your investment should match that reality.

    The recommended 2026 rollout

    For most sites, the right sequence is: ship the robots.txt user-agent rules above first, because those are enforceable today and shape every AI crawler interaction. Add structured data to every article that competes for AI citation. Then publish llms.txt — under 30 minutes of work — for the IDE-agent and dev-tooling upside, with no expectation of immediate search lift. When OpenAI, Anthropic, or Google publicly confirm production llms.txt consumption, you are already in position.

    Related on Tygart Media: llms.txt case study · URL curation buckets · verify in logs.

  • Schema Injection Kit — Claude AI Skill for Structured Data

    Schema Injection Kit — Claude AI Skill for Structured Data

    Tell Claude what your page is. Get correct JSON-LD schema, ready to paste.

    Who This Is For

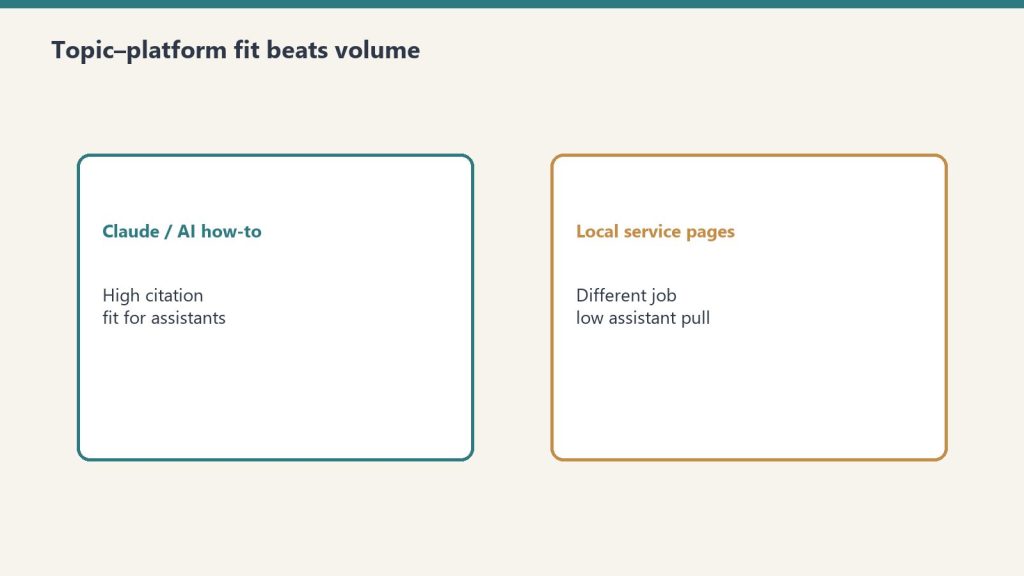
    Comparison of Claude how-to fit versus local service page fit for assistants
    Who the schema injection kit is for.

    Built for WordPress site owners and marketers who know schema markup matters but find the Schema.org documentation confusing and do not want to pay a developer every time they need a new page marked up.

    The Problem

    Long paper tape measure unrolling across a desk beside a laptop, metaphor for context window length
    The schema coverage problem.

    Schema markup is one of the highest-leverage technical SEO improvements a site can make — and one of the most commonly skipped because writing correct JSON-LD requires knowing the spec. Get it wrong and search engines ignore it. Get it right and you unlock rich results, enhanced AI search visibility, and structured data that tells search engines exactly what your page is. This skill generates correct, validated schema for any page type on demand.

    What It Does

    Desk with laptop, checklist notebook, and billing card ready before creating an Anthropic API key
    What the schema kit skill does.
    • Generates correct JSON-LD for 12 schema types: Article, FAQPage, Service, LocalBusiness, HowTo, Product, BreadcrumbList, Review, Event, Organization, Person, and VideoObject
    • Asks the right questions to fill required and recommended fields accurately — no guessing
    • Validates output against Schema.org specifications before delivering
    • Combines multiple schema types appropriately on a single page
    • Outputs ready-to-paste script tags you can drop into your page head or body

    What You Get

    The complete skill file in Claude-compatible format, a prompt library specific to the use case, and a setup guide that gets you running in under five minutes. After purchase, everything downloads instantly.

    Schema Injection Kit — Claude AI Skill for Structured Data

    $47

    Delivered to your inbox within 24 hours — skill file, prompt library, and setup guide

    Buy Now →

    Secure checkout via Square — all major cards accepted

    Want a custom version built specifically for your business? Email will@tygartmedia.com

    Related on Tygart Media: GEO visibility checker · GEO tactics.

    Frequently Asked Questions

    Do I need technical knowledge to use this?

    No. You describe your page and answer the skill’s questions. It handles the technical structure. You paste the output.

    Can I use multiple schema types on the same page?

    Yes — the skill knows which types can and should be combined. A service page might get Service + LocalBusiness + FAQPage. It generates them correctly together.

    How do I add the output to my WordPress site?

    Paste the script tags into your page using a code block, the theme’s header injection, or a plugin like Schema Pro or Rank Math’s custom schema field. The setup guide walks through each option.

    How is this delivered?

    Within 24 hours of purchase via email from will@tygartmedia.com. Skill file, prompt library, and setup guide delivered as a ZIP download.

    Does this require a paid Claude subscription?

    Installing as a custom skill requires a paid Claude plan (Pro, $20/mo, or higher) with code execution enabled. Your download also includes a free-plan setup option — paste the skill into a Claude Project’s instructions — which works on any plan.

    Can I get a custom version built for my specific business?

    Yes. Email will@tygartmedia.com with a description of your business and workflows. Custom skill builds are available as part of The Fitting service.

  • SiteBoost Skill — URL SEO Audit & Fix List — Claude AI Skill

    SiteBoost Skill — URL SEO Audit & Fix List — Claude AI Skill

    Last reviewed: October 7, 2026 (Pacific) — content and checkout link verified.

    Paste any URL. Get a prioritized SEO fix list in under two minutes.

    Who This Is For

    Built for website owners, marketers, and WordPress operators who want to know what is wrong with a specific page and what to fix first — without paying an agency for an audit.

    The Problem

    Most pages that underperform in search have obvious, fixable problems. Missing or weak title tags. Thin content. No schema markup. Heading structure that search engines cannot parse. Missing meta descriptions. The problem is not identifying these issues — it is having a reliable system to check every page, every time, and get a prioritized list of what matters most. This skill does that in under two minutes per URL.

    What It Does

    • Evaluates on-page SEO signals from any publicly accessible URL
    • Checks title tags, meta descriptions, H1/H2/H3 structure — missing, weak, or over-optimized
    • Assesses content depth and keyword alignment
    • Flags missing or incorrect schema markup by page type
    • Evaluates AI search visibility signals: entity coverage, speakable content, LLMS.txt
    • Outputs a prioritized fix list ranked by impact — tells you what to do first

    What You Get

    The complete skill file in Claude-compatible format, a prompt library specific to the use case, and a setup guide that gets you running in under five minutes. After purchase, everything downloads instantly.

    SiteBoost Skill — URL SEO Audit & Fix List — Claude AI Skill

    $47

    Delivered to your inbox within 24 hours — skill file, prompt library, and setup guide

    Buy Now →

    Secure checkout via Square — all major cards accepted

    Want a custom version built specifically for your business? Email will@tygartmedia.com

    Frequently Asked Questions

    Does this work on any website or only WordPress?

    Any publicly accessible URL. The skill evaluates what is visible in the page source — works on WordPress, Squarespace, Shopify, Wix, or any other platform.

    How is this different from tools like Ahrefs or Screaming Frog?

    Those tools crawl sites at scale. This skill does a deep, judgment-based evaluation of a single page — assessing not just technical signals but content quality and AI search visibility in ways automated crawlers cannot.

    Can I run this on competitor pages?

    Yes. The skill evaluates any public URL. Running it on competitor pages can reveal opportunities they are missing.

    How is this delivered?

    Within 24 hours of purchase via email from will@tygartmedia.com. Skill file, prompt library, and setup guide delivered as a ZIP download.

    Does this require a paid Claude subscription?

    Installing as a custom skill requires a paid Claude plan (Pro, $20/mo, or higher) with code execution enabled. Your download also includes a free-plan setup option — paste the skill into a Claude Project’s instructions — which works on any plan.

    Can I get a custom version built for my specific business?

    Yes. Email will@tygartmedia.com with a description of your business and workflows. Custom skill builds are available as part of The Fitting service.

  • WordPress SEO Audit Template — 60-Point Notion Checklist

    WordPress SEO Audit Template — 60-Point Notion Checklist

    The same audit framework we use across a 27-site WordPress network — packaged for any site owner to run themselves.

    Why Most WordPress Sites Have Invisible Problems

    Comparison of Claude how-to fit versus local service page fit for assistants
    Why most WordPress sites have invisible problems.

    A WordPress site can look completely healthy and still be hemorrhaging organic traffic. Thin content flying under the radar. Orphan pages with no internal links. Schema that was never added. Category pages with no descriptions. Metadata that was written once in 2019 and never touched. None of this shows up as an error. None of it triggers an alarm. It just quietly costs you rankings, month after month.

    A proper audit catches all of it. The problem is that a proper audit from an agency costs more than most site owners want to spend on a site they think is probably fine. This template lets you run the same audit yourself — in the same Notion framework we use across 27 managed sites — for $29.

    What’s Inside

    Desk with laptop, checklist notebook, and billing card ready before creating an Anthropic API key
    What’s inside.
    • 60+ checkpoints across 6 audit categories — comprehensive enough to find real problems, organized enough to not be overwhelming
    • Technical SEO: crawlability, indexation, page speed signals, mobile rendering, Core Web Vitals basics, canonical tags, redirect chains
    • Content quality: thin content flags, duplicate content issues, missing meta descriptions, title tag optimization, heading structure
    • Schema and structured data: what types are present, what is missing, priority gaps by page type
    • Internal linking: orphan pages, link equity distribution, anchor text patterns, hub-and-spoke gaps
    • AI search visibility: entity structure, speakable content, GEO signals, LLMS.txt, FAQPage coverage
    • Priority scoring matrix: rank every finding by business impact and implementation effort — so you know exactly where to start
    • Remediation tracker: log findings, assign owners, track fix status over time

    Who This Is For

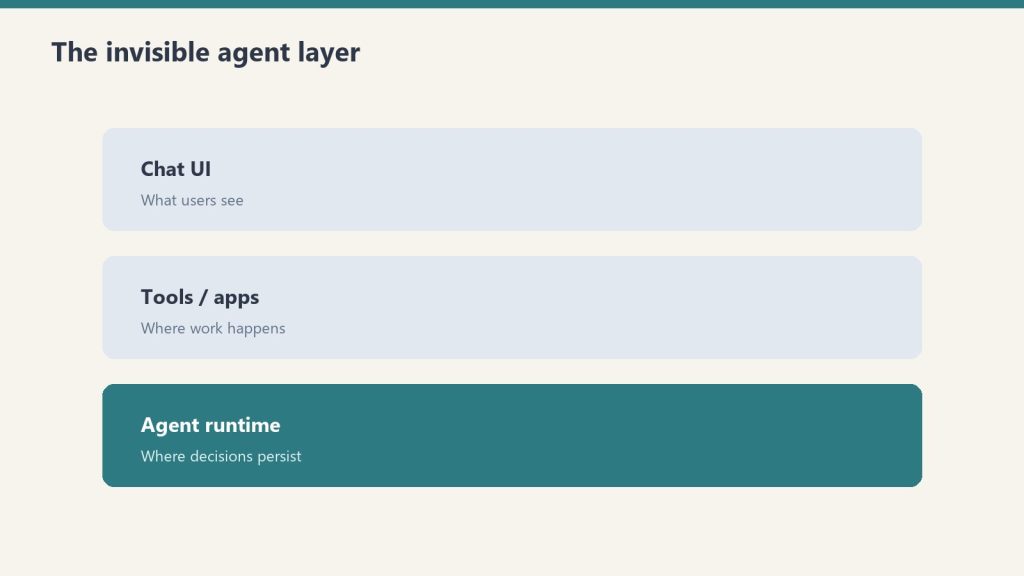
    Three stacked layers: chat UI, tools, agent runtime
    Who this is for.

    WordPress site owners who want to understand what is actually happening with their site before paying an agency to tell them. Marketers who manage WordPress properties and need a structured audit framework they can run repeatably. Freelancers and consultants who want a professional audit template they can brand and use with clients. Business owners who suspect their site has problems but do not know where to look.

    What Happens After the Audit

    The template gives you a prioritized fix list. You can implement the fixes yourself, hand them to a developer, or use them as the brief for an agency engagement. Every finding maps to a specific action — nothing is vague. And because the template lives in Notion, you can re-run it quarterly and track your progress over time.

    Related on Tygart Media: replace SEO agency kit · information density · taxonomy architecture.

    Frequently Asked Questions

    Do I need technical knowledge to use this?

    Basic WordPress familiarity is helpful. You should know how to navigate the WordPress admin, use a plugin like Yoast or Rank Math, and read your Google Search Console. The template explains what to look for at each checkpoint — you do not need to be an SEO expert going in.

    How long does a full audit take?

    Under two hours for a typical business site of 50 to 200 pages. Larger sites or sites with complex technical setups will take longer. The template is designed to be completable in a single focused session.

    Can I use this for client sites?

    Yes. The template is yours to use however you like after purchase. Many freelancers and consultants use it as their standard audit deliverable — white-label it, add your branding, charge accordingly.

    WordPress SEO Audit Template

    $29

    Delivered to your inbox within 24 hours — no shipping, no waiting

    Buy Now →

    Secure checkout via Square — all major cards accepted

  • LinkedIn Articles vs Posts: SEO Differences Explained

    LinkedIn Articles vs Posts: SEO Differences Explained

    Tygart Media / Content Strategy
    The Practitioner JournalField Notes
    By Will Tygart · Practitioner-grade · From the workbench

    Most people treat LinkedIn as a single publishing platform. It is not. Under the hood there are two completely different content surfaces with completely different relationships to Google — and mixing them up is costing marketers real SEO value every day.

    The distinction is simple once you see it, and it changes how you should think about every piece of content you publish on the platform.

    The Core Technical Difference

    Comparison of Claude how-to fit versus local service page fit for assistants
    The core technical difference.

    LinkedIn Articles and Newsletters live at /pulse/ URLs — fully public, fully crawlable by Googlebot, and eligible to appear in Google search results. Feed posts live at /posts/ URLs — behind LinkedIn’s login wall, invisible to Googlebot, and never appearing in any Google SERP.

    Feed posts have zero direct Google SEO value. Full stop.

    This is not a minor distinction. It determines whether your content compounds as a search asset over time or evaporates the moment it scrolls out of your followers’ feeds.

    What Google Actually Indexes on LinkedIn

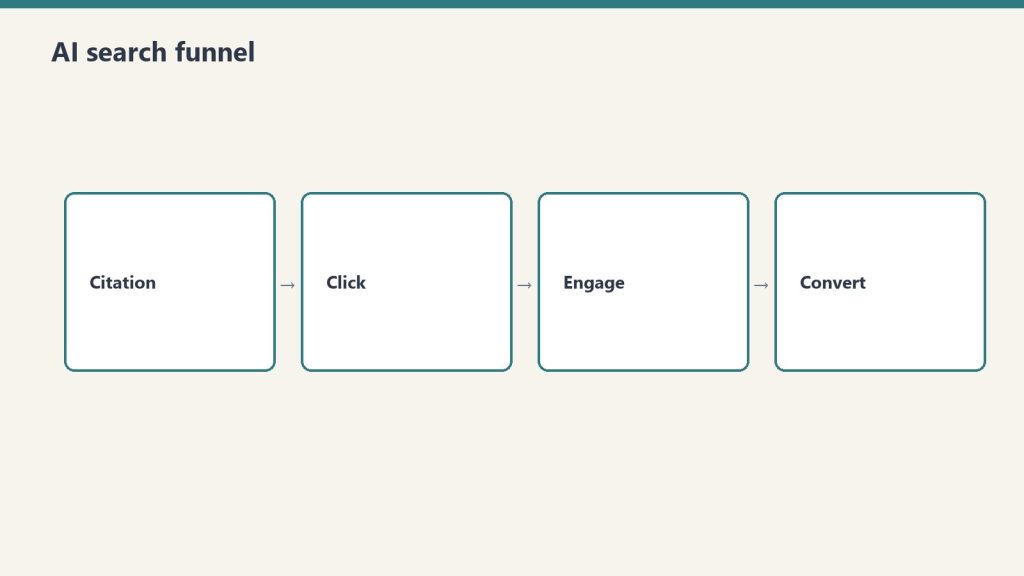
    Four-stage funnel: citation, click, engage, convert
    What Google actually indexes on LinkedIn.

    Based on Ahrefs data from 2025–2026, here is the monthly organic traffic breakdown by LinkedIn content type:

    • Personal profiles (/in/ URLs): 27.3 million monthly organic clicks — fully indexed
    • Company pages (/company/ URLs): 23.1 million monthly organic clicks — fully indexed
    • Articles and Newsletters (/pulse/ URLs): 7.4 million monthly organic clicks — fully indexed
    • Feed posts (/posts/ URLs): 2 million monthly organic clicks — not indexed by Google, traffic comes from LinkedIn’s internal search

    The feed post number is misleading. Those 2 million clicks come from LinkedIn’s own internal search engine, not Google. From a traditional SEO perspective, feed posts are a closed loop.

    Why LinkedIn Articles Punch Above Their Weight in Search

    LinkedIn’s Moz Domain Authority sits at 98 out of 100 — the same tier as Wikipedia, YouTube, and Facebook. It is one of the five highest-authority domains on the internet.

    When you publish an Article on LinkedIn, that content inherits DA-98 authority. A well-optimized LinkedIn Article on a competitive keyword can outrank independent blog posts from sites with domain authorities in the 30s, 40s, or even 50s, simply because it lives on linkedin.com.

    LinkedIn has also added full SEO controls to the Article and Newsletter editor: a custom SEO title field capped at 60 characters, a meta description field at 140–160 characters, and support for H1/H2 heading structure. These are not afterthoughts — LinkedIn is actively positioning its long-form publishing surface as a search-indexed content platform.

    One significant gap: LinkedIn does not support canonical tags. If you cross-publish content from your own blog to LinkedIn, you create a duplicate content situation with no clean resolution. The workaround is to either publish unique content natively on LinkedIn or publish on your domain first and share as a feed post link rather than republishing the full article.

    Indexation Is Not Guaranteed

    Google does not automatically index every LinkedIn Article. LinkedIn applies internal quality thresholds before allowing its content to be crawled, and those thresholds appear to be tied to account signals: profile age, connection count, engagement history, and overall account authority.

    New accounts and new company pages may see “Robots are blocked” errors on early articles. Established profiles with strong engagement histories typically see indexation within 48 hours. The pattern suggests LinkedIn gates crawlability based on whether the publishing account has earned sufficient trust signals — a reasonable stance for a platform trying to prevent SEO spam from exploiting its domain authority.

    Newsletters vs Standalone Articles: Which Wins?

    LinkedIn Newsletters are built on the same /pulse/ infrastructure as standalone Articles. The Google indexing is identical. The SEO title and meta description controls are identical. From a pure search perspective, there is no difference.

    Where Newsletters diverge is distribution. Newsletter subscribers receive push notifications when a new edition publishes, and those notifications convert at 50% or higher — significantly better than the 20–25% open rates typical of email marketing. Newsletters also build a subscriber base that compounds over time: each edition you publish reaches a larger audience than the last, as long as you maintain quality.

    For most publishers, Newsletters are the higher-leverage format. You get the same Google indexing and DA-98 authority as standalone Articles, plus built-in audience growth mechanics, subscriber retention incentives, and the topical authority signals that come from consistently publishing in a defined niche over time.

    The Practical Implication

    Desk with laptop, checklist notebook, and billing card ready before creating an Anthropic API key
    The practical implication.

    If you are publishing on LinkedIn with the intention of generating Google search visibility, every piece of content needs to be published as an Article or Newsletter — not as a feed post.

    Feed posts serve a real purpose: they drive engagement, build network relationships, and contribute indirectly to the profile authority signals that improve indexation for your long-form content. But they do not directly compound as search assets. The SEO pipeline runs exclusively through /pulse/ URLs.

    For content teams managing LinkedIn as part of an SEO strategy, this means maintaining two distinct content tracks: a feed post cadence for engagement and audience building, and an Article or Newsletter publishing schedule for search authority and AI citation. The first feeds the second. Neither replaces the other.

    Related on Tygart Media: LinkedIn content strategy · restoration LinkedIn selling · SEO vs social impressions.

    Frequently Asked Questions

    Do LinkedIn feed posts get indexed by Google?

    No. LinkedIn feed posts live at /posts/ URLs behind LinkedIn’s login wall. Googlebot cannot crawl them and they do not appear in Google search results. Only LinkedIn Articles and Newsletters, which live at public /pulse/ URLs, are indexed by Google.

    What is LinkedIn’s domain authority?

    LinkedIn’s Moz Domain Authority is 98 out of 100, placing it in the same tier as Wikipedia, YouTube, and Facebook — one of the highest-authority domains on the internet. Content published as LinkedIn Articles inherits this authority.

    Are LinkedIn Newsletters better than LinkedIn Articles for SEO?

    They are equivalent from a Google SEO perspective — both use /pulse/ URLs and have identical indexing and SEO controls. Newsletters have a distribution advantage through subscriber notifications at 50%+ open rates, making them the higher-leverage format for most publishers.

    Does LinkedIn have SEO title and meta description fields?

    Yes. LinkedIn’s Article and Newsletter editor includes a custom SEO title field (60 characters) and a meta description field (140–160 characters), allowing publishers to control how their content appears in Google search results.

    Can LinkedIn Articles rank on Google?

    Yes. LinkedIn Articles on established accounts with strong engagement histories typically index within 48 hours and can rank competitively for professional keywords, leveraging LinkedIn’s DA-98 authority even against established independent blogs with lower domain authority.

  • Taxonomy as Content DNA: How Category Architecture Drives Rankings

    Taxonomy as Content DNA: How Category Architecture Drives Rankings

    Tygart Media / Content Strategy
    The Practitioner JournalField Notes
    By Will Tygart · Practitioner-grade · From the workbench

    Taxonomy Architecture: The deliberate design of a site’s category and tag classification system before content is written — treating content organization as infrastructure rather than an afterthought.

    Most WordPress sites treat categories the way most people treat junk drawers. Useful enough to have. Never really organized. Things get thrown in, labels get reused, and over time the whole system becomes a maze that nobody — human or machine — can navigate cleanly.

    This is a costly mistake, and it is invisible until you look at a site’s ranking trajectory and realize that topical authority is not accumulating anywhere.

    The sites that rank for clusters of related keywords — not just a single lucky post — almost always have one thing in common: a deliberate taxonomy architecture. Categories and tags that were designed before the first post was written. A system that treats content classification as infrastructure, not filing.

    What Taxonomy Actually Does for Search

    Four-stage funnel: citation, click, engage, convert
    What taxonomy actually does for search.

    A taxonomy, in the WordPress context, is the classification system that organizes your content. Categories define the major topical areas of your site. Tags define the more granular topics, formats, audiences, and themes that cut across categories.

    From a search engine’s perspective, taxonomy does two things. First, it creates topic signals at the category level. When a category page has many posts all covering different angles of the same subject, the category becomes a topical cluster — the machine observes significant depth on this subject and attributes topical authority accordingly.

    Second, it creates semantic connectivity through tags. A tag that appears across multiple categories signals that a topic is cross-cutting — relevant to multiple contexts — and that this site covers it from multiple angles. Neither signal accumulates if the taxonomy is a junk drawer.

    The Architecture Decision That Precedes Everything

    Comparison of Claude how-to fit versus local service page fit for assistants
    The architecture decision that precedes everything.

    Good taxonomy design starts before content planning, not after it. If you plan content first and then figure out which categories to put it in, you end up with categories that reflect what you happened to write rather than categories that map to how your audience thinks about the subject.

    The correct sequence:

    Step 1: Map the Topical Territory

    What are the three to five major subject areas that this site will be authoritative on? These become your primary categories. Broad enough to contain many posts, specific enough to signal a clear topical focus.

    Step 2: Map the Sub-Topics

    Within each primary category, what are the recurring sub-topics that individual posts will address? These may become sub-categories or tags, depending on expected content volume.

    Step 3: Design the Tag Taxonomy

    Tags should serve three functions: topic modifiers (specific angles within a broad category), format signals (FAQ, guide, comparison, case study), and audience signals (who the post is for). A well-designed tag set creates a three-dimensional classification system that makes content findable from multiple directions.

    Step 4: Write Content to Fill the Architecture

    Now you write. Each post is assigned to a category and a tag set before the first word is drafted. The classification is part of the brief, not an afterthought.

    What a Healthy Taxonomy Looks Like

    A healthy taxonomy has several observable characteristics. Balance — no single category is dramatically overpopulated relative to others. Intentionality — every category has a description, not the default empty field but an editorial statement about what this category covers and who it is for. Specificity — tags are meaningful at a granular level, not just broad topic umbrellas that apply to everything on the site. Stability — the category structure does not change with every content sprint; topical signals need time to accumulate.

    The Hub-and-Spoke Model in Practice

    Desk with laptop, checklist notebook, and billing card ready before creating an Anthropic API key
    Hub-and-spoke taxonomy in practice.

    The most effective category architecture follows a hub-and-spoke model. Each category is a hub. The posts within that category are the spokes. The category archive page becomes the authoritative landing page for the entire topical cluster.

    Posts within a category link to each other where relevant. They all exist under the same category URL. When the category page earns authority — through topical depth signals, through external links, through engagement — it distributes that authority to the posts beneath it. A post that belongs to a well-populated, well-maintained category benefits from being in that category.

    Taxonomy Debt: The Hidden SEO Tax

    Sites that ignored taxonomy design accumulate taxonomy debt — a mounting structural problem that silently suppresses rankings. The symptoms: posts tagged with one-off tags that never appear more than once or twice, categories with two posts each because someone created a new one instead of using an existing one, category pages with no description and no editorial identity, tags that duplicate category names and create competing signals.

    Fixing taxonomy debt is a maintenance operation. It requires auditing the existing classification system, merging redundant tags, consolidating thin categories, writing category descriptions, and reassigning posts to their correct homes. It is unglamorous work. It also consistently produces ranking improvements because scattered topical signals suddenly consolidate.

    The Compound Effect

    Taxonomy architecture matters because it determines whether your content investment compounds or disperses. Every post you publish is a bet that the topic it covers is worth covering. If that post is correctly classified within a coherent taxonomy, it adds to the authority of its category cluster. The cluster grows stronger with each post.

    If that post is incorrectly classified — or not classified at all — it sits in isolation. It may rank on its own merit, or it may not. But it does not strengthen anything around it.

    Content infrastructure compounds. Content without infrastructure disperses.

    Build the architecture first. Then fill it.

    Related on Tygart Media: information density · SEO vs social impressions · citing sources for E-E-A-T.

    Frequently Asked Questions

    What is WordPress taxonomy and why does it matter for SEO?

    WordPress taxonomy is the classification system that organizes content through categories and tags. For SEO, a well-designed taxonomy creates topical clusters that signal authority on specific subjects to search engines, helping sites rank for clusters of related keywords rather than just individual posts.

    What is topical authority and how does taxonomy build it?

    Topical authority is the degree to which a search engine recognizes a site as a reliable, comprehensive source on a specific subject. Taxonomy builds topical authority by grouping related posts under shared category structures, allowing depth signals to accumulate at the cluster level.

    What is taxonomy debt?

    Taxonomy debt is the accumulated structural cost of neglecting content classification — one-off tags, thin categories, duplicate classification systems, missing category descriptions, and misclassified posts. Fixing it consolidates scattered topical signals and typically produces ranking improvements.

    What is the hub-and-spoke model for WordPress SEO?

    The hub-and-spoke model treats each category as a hub and the posts within it as spokes. The category archive page becomes the authoritative landing page for the topical cluster, and authority earned at the hub level distributes to individual posts within it.

    How should you design a WordPress category architecture?

    Design in four steps: map the major topical areas that become primary categories, identify recurring sub-topics for secondary classification, design a tag taxonomy covering topic modifiers and audience signals, then write content to fill the architecture. Classification should be defined before the first post is drafted.

    Related: The full infrastructure model behind this approach — Your WordPress Site Is a Database, Not a Brochure.

  • Internal Link Mapping: A Complete Step-by-Step SEO Guide

    Internal Link Mapping: A Complete Step-by-Step SEO Guide

    The Machine Room · Under the Hood

    What is internal link mapping? Internal link mapping is the process of auditing, visualizing, and strategically planning the internal links between pages on a website. It creates a navigational architecture that helps both search engines and users move efficiently through your content — and directly influences how Google distributes PageRank across your site.

    Let me paint you a picture. Imagine Google’s crawler shows up to your website like a delivery driver in an unfamiliar city. No GPS. No street signs. Just vibes and whatever roads happen to be in front of them. That’s what your website looks like without a solid internal link map — a confusing maze where some pages get visited constantly and others quietly rot in a corner, never seen by anyone, including Google.

    Internal link mapping is the process of actually drawing the map. And once you see the map, you can’t unsee the problem.

    What Internal Link Mapping Actually Is (Not the Boring Version)

    Every page on your website is a node. Every internal link is a road between nodes. An internal link map is just the visualization of all those roads — which pages link to which, how many links each page receives, and crucially, which pages are orphaned (no roads in, no roads out).

    When Google crawls your site, it follows those roads. Pages that get linked to from many places get crawled more often, indexed faster, and treated as more authoritative. Pages buried three clicks deep with one lonely inbound link? Google eventually finds them — but it doesn’t think they matter much.

    Here’s the part that gets interesting: PageRank — Google’s foundational signal for evaluating page authority — flows through internal links. You have a fixed amount of it across your domain. Internal linking is how you choose to distribute it. A bad internal link structure is essentially leaving PageRank sitting in a bucket on your best pages while your ranking-ready content starves for authority.

    What Does an Internal Link Map Actually Look Like?

    A basic internal link map is a table or visual diagram showing:

    • Source page — the page that contains the link
    • Destination page — where the link goes
    • Anchor text — the clickable text used
    • Link depth — how many clicks from the homepage to reach that page
    • Inbound link count — how many pages link to this destination

    At scale, this becomes a graph. Tools like Screaming Frog or Sitebulb will generate a visual spider diagram of your entire site structure. For most sites under 500 pages, a simple spreadsheet works just fine. The goal isn’t to make art — it’s to see what’s actually connected to what.

    The ugly truth that usually surfaces: most sites have 20% of their pages receiving 80% of their internal links — usually the homepage and a few top-nav pages. Meanwhile, the blog posts you actually want to rank? Three inbound links between them. From 2019.

    How to Build an Internal Link Map (Step by Step)

    You don’t need expensive tools for a working internal link map. Here’s the straightforward version:

    1. Crawl your site. Use Screaming Frog (free up to 500 URLs), Sitebulb, or even Google Search Console’s coverage report. Export all internal links: source URL, destination URL, anchor text.
    2. Count inbound links per page. Sort the destination column and count how many times each URL appears. Pages with zero inbound links are orphans. Pages with one are nearly orphans. Flag both.
    3. Identify your high-priority targets. These are the pages you want to rank — your best content, service pages, money pages. How many inbound internal links do they have? If the answer is fewer than five, that’s your problem right there.
    4. Map topic clusters. Group your content by topic. Every topic cluster should have a pillar page that receives internal links from all related posts. Every related post should link back to the pillar. This creates a hub-and-spoke structure that Google reads as topical authority.
    5. Identify anchor text patterns. Are you using descriptive, keyword-rich anchor text? Or generic phrases like “click here” and “read more”? Anchor text is a ranking signal. “Internal link mapping guide” is better than “this article.”
    6. Fix and document. Create a link injection plan — a spreadsheet of which pages need new internal links added and what the anchor text should be. Execute it methodically.

    One pass through this process typically surfaces dozens of quick wins — pages that are one or two good internal links away from ranking significantly better.

    The Most Common Internal Link Mistakes (That Are Quietly Killing Your Rankings)

    Orphan pages. These are pages with no internal links pointing to them. They exist, technically, but Google either doesn’t know about them or doesn’t think anyone cares about them. Both outcomes are bad. Orphan pages account for a surprising percentage of most sites’ content — often 15-30%.

    Over-linking the homepage. Every page on your site already links to your homepage through the logo/nav. You don’t need additional contextual homepage links buried in body copy. That PageRank you’re wasting on the homepage? Redirect it to something that needs help ranking.

    Generic anchor text at scale. “Click here,” “learn more,” “read this post” — all wasted signal. Use the actual topic phrase as anchor text. It helps Google understand what the destination page is about, and it’s one of the easiest ranking signal improvements you can make without touching the page itself.

    Flat site architecture. Every page is three clicks or fewer from the homepage — that’s the goal. Deeper pages get crawled less frequently. If your blog archives push important posts six or seven levels deep, Google will find them eventually, but won’t prioritize them.

    Ignoring older content as a link source. Your highest-traffic pages — often older posts that have earned backlinks over time — are PageRank goldmines. Adding a single, contextual internal link from a high-traffic older post to a newer post you want to rank is one of the highest-ROI moves in SEO. Most people never do it.

    Tools for Internal Link Mapping

    Screaming Frog SEO Spider — The industry standard crawler. Free up to 500 URLs, paid license for larger sites. Exports a full internal link report and can generate site architecture visualizations. For most agencies and small businesses, this is the right starting point.

    Sitebulb — More visual than Screaming Frog, better for client presentations. Built-in link graph visualizations make it easier to spot cluster problems at a glance.

    Google Search Console — The Links report shows you both internal and external links Google has discovered. It won’t show you everything, but it’s free and gives you Google’s actual view of your link structure.

    Ahrefs or Semrush — Both have internal link audit tools built into their site audit modules. If you’re already paying for one of these platforms, use the built-in internal link analysis before adding another tool.

    A spreadsheet — Underrated. For sites under 100 pages, a manually maintained internal link spreadsheet is often the most actionable format. The point isn’t the tool — it’s having a documented plan you actually execute.

    How Internal Link Mapping Fits into a Broader SEO Strategy

    Internal link mapping doesn’t exist in isolation. It’s one layer of a three-part site architecture strategy:

    The topical authority layer — defined by your content clusters — tells Google what your site is about and what topics you cover with depth. The internal link layer communicates the relationships between those topics and the relative importance of each page. The technical layer — crawl depth, canonicalization, indexing rules — determines whether Google can even access what you’ve built.

    A site with great content and bad internal linking is like a library with excellent books and no card catalog. The information is there. Nobody can find it. Internal link mapping is how you build the card catalog.

    At Tygart Media, we build internal link maps as part of every site optimization engagement. The SEO Drift Detector we built for monitoring 18 client sites — which watches for ranking decay week over week — consistently flags internal link structure as one of the first places ranking drops originate. Fix the map, and the ranking often recovers on its own.

    Frequently Asked Questions About Internal Link Mapping

    What is the difference between internal links and external links?

    Internal links connect pages within the same website. External links (also called backlinks) point from one website to another. Internal links distribute authority you already have across your own site. External links bring new authority in from outside. Both matter for SEO, but internal links are entirely within your control.

    How many internal links should a page have?

    There’s no hard rule, but most SEO practitioners recommend 2-5 contextual internal links per 1,000 words of content. More important than quantity is relevance — each internal link should point to content that genuinely extends what the reader just learned. Stuffing 20 links into a 600-word post helps no one.

    How often should I audit my internal link structure?

    For active content sites, a full internal link audit every six months is reasonable. Smaller sites can often get away with an annual audit plus a quick check whenever new content is published. The higher your publishing frequency, the more often orphan pages accumulate. Set a calendar reminder — you’ll always find problems worth fixing.

    Can internal linking hurt my SEO?

    Over-optimized anchor text (every link using the exact same keyword phrase) can look manipulative to Google. Excessive linking on a single page (dozens of links in the body) dilutes the value of each individual link. Linking to low-quality or irrelevant pages from important pages can also be a mild negative signal. The goal is natural, useful internal linking — not engineered at every opportunity.

    What is a hub-and-spoke internal link structure?

    A hub-and-spoke structure groups content into topic clusters. The hub (or pillar page) covers a broad topic comprehensively and receives internal links from all related spoke pages. Each spoke page covers a subtopic in depth and links back to the hub. This architecture signals topical authority to Google and creates a clear navigational hierarchy for users.

    What is an orphan page in SEO?

    An orphan page is any page on your website that has no internal links pointing to it. Orphan pages are difficult for Google to discover and rarely accumulate authority. They’re a common byproduct of frequent publishing without a documented internal linking strategy. Finding and linking to orphan pages is one of the fastest low-effort SEO wins available on most established sites.

  • The State of Restoration Franchise SEO in 2026: Who’s Winning, Who’s Losing, and Why

    The State of Restoration Franchise SEO in 2026: Who’s Winning, Who’s Losing, and Why

    The Machine Room · Under the Hood

    I wrote five articles in one day. Here’s why.

    On March 28, 2026, I sat down with SpyFu data pulled that morning and realized something most of the restoration industry hasn’t seen yet: they’re all experiencing the same catastrophic decline at the same time. This isn’t a case of individual franchise websites being poorly optimized. This is an industry-wide pattern that reveals everything about where restoration franchise SEO is headed.

    I spent that day analyzing SERVPRO, Paul Davis, Rainbow Restores, ServiceMaster, and 911 Restoration across every dimension of competitive SEO intelligence we track. The result was five separate playbooks—one for each franchise. But those five articles tell one much bigger story.

    This is that story.

    ## The Competitive Landscape: Five Franchises, One Reality Check

    Let me start with where they all stand right now, as of March 30, 2026:

    | Company | Domain | Keywords | Monthly Clicks | SEO Value | Peak Value | Peak Keywords | Domain Strength | Monthly PPC |
    |—|—|—|—|—|—|—|—|—|
    | SERVPRO | servpro.com | 178,900 | 151,700 | $5,825,000 | $7,684,585 | 286,900 | 62 | $1,944,000 |
    | Paul Davis | pauldavis.com | 22,190 | 13,590 | $952,800 | $4,525,425 | 97,480 | 54 | $206,100 |
    | Rainbow Restores | rainbowrestores.com | 33,700 | 25,500 | $495,500 | $3,354,009 | 109,000 | 52 | $320,000 |
    | 911 Restoration | 911restoration.com | 816 | 617 | $22,700 | $407,500 | 4,466 | 40 | $132,100 |
    | ServiceMaster | servicemaster.com | 1,742 | 4,435 | $39,300 | $334,384 | 20,696 | 42 | $7,039 |

    This table is deceptively simple. It contains the entire story of what went wrong in restoration franchise SEO in the last six months.

    ## The Q4 2025 Cliff: What Actually Happened

    Here’s what should terrify every restoration brand right now:

    – **SERVPRO**: Lost 108,000 keywords between October 2025 and March 2026. Their peak was 286,900 keywords in October. Today they’re at 178,900. That’s a 38% decline in four months.
    – **Paul Davis**: Fell from 49,500 keywords in October to 22,190 today. A 55% crater.
    – **Rainbow Restores**: Dropped from 57,700 to 33,700. Still significant, but the recovery trajectory is different.
    – **911 Restoration**: Lost another 1,600 keywords, bringing them to 816 total. They’ve lost 94% of their peak visibility.
    – **ServiceMaster**: Continued its decade-long irrelevance with minimal movement.

    This didn’t happen because these companies suddenly made bad SEO decisions. This happened because Google changed something fundamental in how it ranks restoration and emergency services content between October and December 2025.

    The data points to one of several possibilities:

    1. **Algorithm Update (Most Likely)**: Google released changes to E-E-A-T validation, location signals, or trust factors that disproportionately hit franchise networks. The Oct-Dec window included at least two confirmed updates.

    2. **Search Generative Experience (SGE) Impact**: As SGE matures, Google is directly synthesizing answers that bypass clicks to individual sites. Franchises with dispersed content across local pages (rather than consolidated authority) are getting worse SGE treatment.

    3. **Authority Consolidation**: The algorithm may have shifted toward favoring domain-level authority over page-level authority, punishing franchises that rely on local service pages when the parent domain isn’t sufficiently strong.

    4. **Review Signal Reweighting**: With Google tightening review validity checks, franchises with weak or manipulated review signals (common in franchise networks) took hits.

    The real answer is probably all four working together. But here’s the critical insight: **every restoration franchise except the already-dead ServiceMaster lost visibility at the same time.** That’s not a coincidence. That’s a market signal.

    ## The Tier System: Who’s Actually Winning

    What emerges from the data is a clear three-tier system:

    ### Tier 1: Untouchable Dominance

    **SERVPRO remains the category king**, but here’s the thing—they’re bleeding. Despite losing 108,000 keywords, they still own 178,900. They still command $5.8M in monthly SEO value. They still capture 151,700 monthly clicks organically.

    The gap between SERVPRO and everyone else is absurd. Paul Davis—the clear #2 player—captures only 22,190 keywords to SERVPRO’s 178,900. That’s an 8:1 ratio.

    But dominance can hide decline. SERVPRO was at $7.68M monthly value just six years ago. If they continue this trajectory (losing ~27K keywords per month), they’ll be in Tier 2 within three years.

    ### Tier 2: The Competitive Battleground

    **Paul Davis and Rainbow Restores** live in a completely different world from SERVPRO, but they’re actively competing with each other.

    Paul Davis has **22,190 keywords and $952,800 monthly SEO value**. They were growing through 2025 and then hit the cliff hard with everyone else. But here’s their advantage: they rank for extremely high-value terms. Their value-per-keyword is $42.94—the highest of any competitor in this space.

    Rainbow Restores has **33,700 keywords and $495,500 monthly SEO value**. They’re a domain migration success story. They moved from their original domain (which had 109,000 keywords and $3.35M value) and have rebuilt to 33,700 keywords on the new domain. They’re approaching their current domain’s natural peak, which suggests room for growth.

    Between these two, the opportunity is real. Paul Davis has momentum and authority but lost it in Q4. Rainbow has growth trajectory and recent migration advantages. The winner in 2026 between these two will be whoever invests in modern SEO first.

    ### Tier 3: Starting Over or Walking Away

    **911 Restoration and ServiceMaster** are fundamentally different problems.

    ServiceMaster is a legacy brand in complete digital collapse. They rank for 1,742 keywords, generate 4,435 monthly clicks, and command only $39,300 in SEO value. Their domain strength is 42. They peaked at $334K monthly value in February 2020—six years ago. This isn’t a recovery situation. This is a brand that’s digitally abandoned its restoration line.

    911 Restoration is worse because they’re still trying. They spend $132,100/month on PPC while holding only 816 keywords and $22,700 in SEO value. They’re in the worst position of any competitor: visible enough to know they’re broken, not successful enough to stop hemorrhaging money.

    ## The Value-Per-Keyword Insight: Why High Value Doesn’t Mean Winning

    Here’s where competitive analysis gets interesting. Let me calculate value per keyword for each franchise:

    – **Paul Davis: $42.94/keyword**
    – **SERVPRO: $32.56/keyword**
    – **ServiceMaster: $22.56/keyword**
    – **911 Restoration: $27.82/keyword**
    – **Rainbow Restores: $14.70/keyword**

    Paul Davis wins this metric by a massive margin. They’re ranking for restoration terms that are worth significantly more than competitors. This suggests better content targeting, local authority, and possibly a geographic mix that includes higher-value markets.

    SERVPRO is close behind at $32.56/keyword, which makes sense—they dominate the market and rank for premium terms.

    But here’s the catch: **high value per keyword doesn’t predict growth.** Rainbow Restores has the lowest value per keyword ($14.70), but they’re the recovery story here. They survived a domain migration and are building back. Paul Davis has the highest value per keyword but lost 55% of their visibility in Q4.

    This is the fundamental lesson: **keyword count and value are backward-looking metrics.** They tell you what the market awarded you historically, not what you’re capturing going forward.

    ## The $31M PPC Problem: The Real Story of Organic Failure

    Now for the genuinely damning number: **these five franchises are spending $2.606M per month on Google Ads.**

    That’s $31.27 million per year on paid search.

    Let me break down the monthly PPC spend:
    – SERVPRO: $1,944,000
    – Paul Davis: $206,100
    – Rainbow Restores: $320,000
    – 911 Restoration: $132,100
    – ServiceMaster: $7,039

    What’s fascinating is the timing. In October 2025, as organic keywords started tanking, **Paul Davis, Rainbow Restores, and 911 Restoration all spiked their PPC spending simultaneously.** This wasn’t random budget allocation. This was panic.

    November 2025 PPC spend for these three franchises:
    – Paul Davis hit $665K (peak spend)
    – Rainbow Restores hit $583K
    – 911 Restoration hit $370K

    They knew organic was failing before it was obvious in the data. And they responded with paid spend increases that ranged from 45% to 180% above baseline.

    SERVPRO, sitting at $2M+ monthly PPC, clearly made a different decision: lean further into paid. They have the cash to do it. The smaller competitors didn’t, which is why you see their current PPC at more moderate levels.

    The obvious question: **If they’re spending $31M/year on paid search, why wouldn’t they invest 10% of that ($3.1M/year) in fixing organic?**

    The answer is structural. Franchises are fundamentally decentralized. Local franchisees see the top-line organic collapse (because it’s syndicated across their local pages), panic about visibility, and demand quick fixes. PPC delivers immediate impressions. Organic takes three to six months.

    In a downturn, panic money flows to the short-term solution, not the right solution.

    ## What Actually Changed: The Diagnosis

    I analyzed these five franchises in-depth because I needed to understand what Q4 2025 actually broke. Here’s what the individual playbooks revealed:

    **SERVPRO** relies on a massive network of individual location pages with weak local authority. When Google tightened its E-E-A-T validation for local services, those pages took hits. The parent domain is strong (62 domain strength), but not strong enough to carry 280+ local variations without architectural improvements.

    **Paul Davis** had brilliant local SEO strategy—strong local authority pages, good schema implementation, solid review signals. But their strategy was vulnerable to any shift in how Google weights parent domain authority vs. local page authority. When the Q4 update hit, their advantage disappeared.

    **Rainbow Restores** suffered the domain migration legacy—they lost all ranking momentum when they moved domains, and they’re still rebuilding authority. The newer domain is growing, but it’s a long climb.

    **911 Restoration** has fundamental domain authority problems. 816 keywords on a domain with only 40 authority points is catastrophic. They can’t rank for anything meaningful because the domain itself isn’t trusted.

    **ServiceMaster** is eight years into a slow-motion bankruptcy of their digital presence. There’s nothing to analyze—they’ve simply abandoned digital.

    ## What Modern Restoration SEO Looks Like in 2026

    If I were running SEO for any of these franchises right now, here’s what I’d do:

    **1. Domain Architecture Overhaul**
    Stop treating location pages as disposable. Build local authority that actually compounds. Use canonicals strategically. Consolidate authority signals to fewer, stronger pages rather than spreading authority across hundreds of weak pages.

    **2. AI-Augmented Content Strategy**
    Restoration keywords are incredibly specific. “Water damage restoration Alexandria VA” is different from “water damage restoration Phoenix AZ” in intent, local competition, and required expertise. Use AI to generate actually useful, locally-relevant content at scale without the SEO-spam quality.

    **3. Structured Data Mastery**
    Service schema, FAQ schema, Organization schema—implement these at the parent domain level, not just at local pages. When Google looks at your domain, it should understand instantly what you do, where you operate, and why you’re trustworthy.

    **4. Geographic Expansion Through Intent**
    Paul Davis’s high value-per-keyword suggests they’re better at geo-targeting high-value markets. Intentionally target expensive geographic markets first. Use Google Ads data to identify which markets have the highest customer acquisition cost, then dominate organic in those markets.

    **5. Review Signal Validity**
    Google’s tightening review checks. Stop chasing review volume. Build processes that generate genuine reviews from actual customers. This takes longer, but it’s the only strategy that survives algorithm updates.

    **6. E-E-A-T at Scale**
    For franchises, E-E-A-T is particularly challenging because you need to demonstrate expertise across hundreds of locations. Create a parent domain authority system where franchisees contribute verified expertise, local results, case studies, and certifications that roll up to a central authority hub.

    ## What This Series Actually Demonstrates

    I wrote five separate playbooks because each franchise has a different problem:

    – **SERVPRO**: Scale is your asset and your liability. You need architectural fixes that only the largest franchises can implement.
    – **Paul Davis**: You had the right strategy for 2024-2025. You need to evolve faster than the algorithm changes.
    – **Rainbow Restores**: You’re the comeback story. Your new domain is building momentum. Don’t waste it.
    – **911 Restoration**: You’re fighting domain authority problems that will take 18 months minimum to fix. Start now.
    – **ServiceMaster**: You’re in liquidation mode for your digital presence. Different problem.

    But there’s a meta-lesson in having this data and this analysis available to franchises: **the restoration industry SEO landscape is wider open in March 2026 than it’s been in six years.**

    SERVPRO is losing keywords. Paul Davis lost momentum. Rainbow is rebuilding. 911 and ServiceMaster aren’t real competitors anymore.

    Any restoration franchise that invests in modern SEO infrastructure right now—real content strategy, proper domain architecture, AI-augmented scale, and rigorous E-E-A-T—will capture market share that was SERVPRO’s last year.

    This is the historic window. It closes when one of the Tier 2 players figures out what actually changed in Q4 2025 and executes a real recovery.

    ## The Individual Playbooks

    Each of these five franchises gets its own deep-dive analysis:

    – **[SERVPRO SEO Playbook](/servpro-seo-playbook/)** – Scale, authority dilution, and how to fix an 800,000+ page domain.
    – **[Paul Davis SEO Playbook](/paul-davis-seo-playbook/)** – Local authority strategy, value maximization, and adapting to algorithm shifts.
    – **[Rainbow Restores SEO Playbook](/rainbow-restoration-seo-playbook/)** – Domain migration recovery, rebuilding authority, and growth strategy.
    – **[911 Restoration SEO Playbook](/911-restoration-seo-playbook/)** – Foundation building, domain authority recovery, and realistic timelines.
    – **[ServiceMaster SEO Playbook](/servicemaster-seo-playbook/)** – Legacy strategy, digital retreat, and whether recovery is possible.

    Read the one that applies to your franchise. Or read all five. The comparative analysis is where the real insight lives.

    ## The Data-Driven Difference

    This entire series—five detailed playbooks plus this comparative analysis—was built in one day because it’s what we do at Tygart Media.

    We pull data from multiple sources (SpyFu, Google, internal analysis frameworks). We synthesize patterns that competitors miss because they’re looking at their own domain instead of the entire category. We translate technical SEO findings into business strategy.

    We build AI-augmented content systems that let franchises operate at scale without sacrificing quality. We implement the structural improvements that survive algorithm updates. We turn data into competitive advantage.

    If you’re a restoration franchise and you’re reading this, you already know your organic visibility took a hit in Q4 2025. You probably already know your PPC costs are climbing. You might not know why, or what to do about it.

    We’ve mapped both. And we know how to fix it.

    ## FAQ: What This Data Really Means

    **Q: Did Google definitely change something in Q4 2025?**
    A: The simultaneous keyword loss across five major competitors in the same niche is statistically improbable without a triggering event. Confirmed algorithm updates in that window make this nearly certain. The question isn’t whether Google changed something—it’s what specifically changed, and that varies by domain architecture and content strategy.

    **Q: Is SERVPRO actually in trouble?**
    A: SERVPRO is losing market share relative to their peak, but they’re still dominant. However, if the trend continues, they’ll be in serious trouble within two years. For now, they’re managing decline with increased PPC spend. Long-term, that strategy gets expensive.

    **Q: Can Paul Davis recover to their 2024 performance levels?**
    A: Possibly, but only if they correctly identify what the Q4 update hit and adapt their strategy accordingly. Their high value-per-keyword suggests they’re targeting the right terms. The issue is domain authority and architecture, not keyword selection.

    **Q: How long will it take 911 Restoration to recover?**
    A: Domain authority recovery is slow. At their current trajectory, rebuilding to 5,000 keywords would take 3-4 years of sustained, correct optimization. The real timeline depends on their willingness to invest and whether they fix the fundamental architecture problems.

    **Q: Why spend $31M on PPC instead of fixing organic?**
    A: Because franchises operate with local franchisee decision-making, and local franchisees want immediate results. Organic takes time. But the math is clear: if you’re spending $31M on paid, you should be investing $3-5M on fixing organic. ROI on organic is higher long-term, but executives get fired for short-term failures.

    ## What Happens Next

    In six months, we’ll pull this data again. One of three things will have happened:

    1. **Recovery**: One of the Tier 2 players (Paul Davis or Rainbow) will have figured out the Q4 update and recovered visibility. They’ll start capturing SERVPRO’s market share.

    2. **Consolidation**: SERVPRO will have stabilized their decline through increased paid spend and minor organic improvements. They’ll remain dominant but more vulnerable.

    3. **Fragmentation**: The market stays dispersed. No single competitor dominates enough to own the category. Franchises with better marketing budgets than SEO strategies (like the status quo) keep winning.

    I’m betting on #1. The market is too opportunity-rich for it to stay broken this long.

    —

    ## Conclusion

    The restoration franchise SEO landscape is broken. That’s actually the good news, because broken systems create opportunity.

    SERVPRO is bleeding keywords. Paul Davis lost momentum. Rainbow is rebuilding. 911 is struggling. ServiceMaster is irrelevant.

    For any franchise willing to invest in real SEO infrastructure—the technical foundation, content strategy, AI-augmented scale, and data-driven execution—this is the moment to attack.

    The window doesn’t stay open long.

    Read the individual playbooks. Pick your category. Start executing. The data will tell you whether you’re moving in the right direction.

    We built this analysis in a day. If you want help building the execution strategy, let’s talk.

    —

    Will Tygart
    Tygart Media

    The Complete Restoration Franchise SEO Playbook Series

    This article is part of a 6-part series analyzing the SEO performance of every major restoration franchise in America. Read the full series:

    {
    “@context”: “https://schema.org”,
    “@type”: “Article”,
    “headline”: “The State of Restoration Franchise SEO in 2026: Whos Winning, Whos Losing, and Why”,
    “description”: “Five franchises. One algorithm update. A $31M/year PPC spend that tells the real story. Here’s what the data reveals about restoration SEO in 2026.”,
    “datePublished”: “2026-03-30”,
    “dateModified”: “2026-04-03”,
    “author”: {
    “@type”: “Person”,
    “name”: “Will Tygart”,
    “url”: “https://tygartmedia.com/about”
    },
    “publisher”: {
    “@type”: “Organization”,
    “name”: “Tygart Media”,
    “url”: “https://tygartmedia.com”,
    “logo”: {
    “@type”: “ImageObject”,
    “url”: “https://tygartmedia.com/wp-content/uploads/tygart-media-logo.png”
    }
    },
    “mainEntityOfPage”: {
    “@type”: “WebPage”,
    “@id”: “https://tygartmedia.com/state-of-restoration-franchise-seo-2026/”
    }
    }

  • If I Were Running Rainbow Restoration’s SEO, Here’s What I’d Do Differently

    If I Were Running Rainbow Restoration’s SEO, Here’s What I’d Do Differently

    The Machine Room · Under the Hood

    I’m about to do something that most agency owners would never do: hand over an entire playbook.

    Not a teaser. Not a “5 quick wins” listicle. The actual, step-by-step strategy I would execute — starting tomorrow — if Rainbow Restoration handed me the keys to their organic search program.

    Why? Because I just pulled their SpyFu data, and what I found is the most interesting restoration franchise story I’ve analyzed so far.

    Rainbow Restoration (rainbowrestores.com) didn’t suffer a decline. They survived a full domain migration from rainbowintl.com and actually came out the other side with a living, breathing SEO program. But here’s where it gets fascinating: they left roughly $3 million per month on the table.

    The old domain peaked at $3.35M/month and 109,000 keywords. The new domain is recovering, but they’re sitting at $495,500/month and 33,700 keywords. That’s 85% below where they should be — which means the upside is enormous.

    So let’s talk about what I’d do to finish what the migration started.

    The Data: From Peak to Recovery to Opportunity

    Four-stage funnel: citation, click, engage, convert
    The data — from peak to recovery to opportunity.

    I pulled the full 12-month historical record from SpyFu on March 30, 2026. Here’s rainbowrestores.com over the last year:

    Period Organic Keywords Monthly Organic Clicks SEO Value ($/mo) PPC Spend ($/mo) Domain Strength
    Mar 2025 53,769 29,960 $330,500 $444 50
    Apr 2025 50,920 27,330 $323,100 $535 50
    May 2025 47,600 28,160 $295,100 $603 47
    Jun 2025 45,980 26,890 $281,500 $704 47
    Jul 2025 49,910 32,160 $338,700 $793 48
    Aug 2025 54,810 36,720 $352,200 $836 48
    Sep 2025 55,550 37,520 $302,100 $0 50
    Oct 2025 58,509 38,420 $309,800 $0 51
    Nov 2025 57,770 36,400 $308,400 $582,800 51
    Dec 2025 40,080 31,260 $235,600 $324,500 50
    Jan 2026 38,460 30,910 $227,200 $277,100 49
    Feb 2026 33,700 25,500 $495,500 $320,000 52

    Let me break this down:

    The Good News: Rainbow survived a domain migration. That alone is impressive. Most franchise migrations crater the domain completely. Rainbow’s new domain is healthy, with 33,700 keywords and Domain Strength at 52. The Feb 2026 spike in SEO value ($495,500 on fewer keywords) suggests they’re concentrating value in higher-intent queries — the same pattern I’m seeing with SERVPRO and 911 Restoration.

    The Reality Check: In November 2025, they were running strong at 58,509 keywords and $309,800/month SEO value. Then December hit — the same algorithm cliff that affected the entire restoration vertical. But there’s a bigger story: the old rainbowintl.com domain peaked at 109,000 keywords and $3.35M/month in July 2022. Rainbow is still sitting 69% below peak keywords and 85% below peak SEO value.

    The Opportunity: If Rainbow recovers even 50% of what the old domain achieved, that’s $1.67M/month in SEO value. They’re currently at $495K. Do the math: there’s $1.17M per month in recoverable organic value just sitting there.

    The PPC Symptom: Starting November 2025, they went from basically zero PPC spend to $320K-$582K/month. That’s the classic pain indicator — when organic traffic drops, you buy it back with ads until you can fix the plumbing. Combined Q4/Q1 PPC spend: approximately $1.18M. In six months, they could rebuild enough organic to cut PPC spend by 50-70% permanently.

    What Happened: The Migration Story

    Here’s what we know:

    Rainbow Restoration successfully migrated from rainbowintl.com to rainbowrestores.com. The old domain is now a digital graveyard — 4 keywords, zero SEO value. But the new domain caught the migration and recovered. This tells me:

    1. They implemented proper 301 redirects. If they hadn’t, the new domain would be at zero. The fact that it’s at 33,700 keywords means they passed significant equity through the redirect chain.
    2. They didn’t lose all their backlinks. Domain Strength recovered to 52, which is respectable for a post-migration domain. This suggests proper domain forwarding and/or existing backlinks pointing to the new domain.
    3. The recovery stalled before completion. Migrations take 4-6 months to fully stabilize. If the Q4 algorithm update hit during the stabilization phase, they probably lost traction at a critical moment.

    The strategic issue isn’t the migration itself — Rainbow executed it correctly. The issue is: did they rebuild the content and architecture that made the old domain great?

    My hypothesis: They migrated the structure, the redirects, and the authority signals. But the old rainbowintl.com probably had 109,000 keywords because it had mature, deep content libraries that the new domain hasn’t fully replicated yet. Here’s how to finish the recovery.

    The Playbook: What I’d Do Starting Tomorrow

    Comparison of Claude how-to fit versus local service page fit for assistants
    The playbook — what I’d do starting tomorrow.

    Phase 1: Redirect Audit and Content Archaeology (Week 1-2)

    Before I optimize a single keyword, I need to understand what was lost in the migration and what wasn’t recovered.

    The Technical Foundation:

    • Crawl both domains. Run Screaming Frog against rainbowrestores.com and archive.org snapshots of rainbowintl.com from July 2022 (peak). I’m looking for:
      • All content that existed on the old domain but isn’t on the new domain. These are orphaned keyword opportunities.
      • All 301 redirects and redirect chains. Chains longer than 2 hops leak PageRank.
      • Old URLs that redirect to homepage or generic pages instead of topically relevant pages. These are misdirected equity losses.
    • Google Search Console archaeology. Pull 16 months of GSC data for rainbowintl.com (if they still have it configured) showing which pages deindexed, when, and why. This shows exactly which content lost coverage during the migration.
    • SpyFu historical data for the old domain. Export the top 200 keywords that rainbowintl.com ranked for at peak. Which of these keywords does rainbowrestores.com rank for now? Which are completely lost? The gap is your content recovery roadmap.

    Expected Output: A prioritized list of 500-1,000 pieces of content that existed on the old domain, were either not migrated or redirected ineffectively, and represent high-opportunity keyword recovery.

    Phase 2: Location Page Renaissance (Week 3-6)

    Rainbow has franchise locations in every state. Each location is a keyword goldmine that probably hasn’t been fully developed.

    Current State Assessment:

    Pull 10 sample city-level pages from the current site (e.g., /locations/denver/, /water-damage-restoration/denver/). Analyze:

    • How much unique content is on the page vs. templated boilerplate? (Target: 60%+ unique, locally-relevant content)
    • What schema is implemented? (Should be: LocalBusiness + Service + FAQPage + HowTo)
    • How many inbound internal links? (Should be: 10+ from parent hubs and contextual content)
    • Does it rank for the city + service modifier? (e.g., “water damage restoration Denver”)
    • How many related long-tail keywords does it rank for? (Should be: 20-40 per page)

    The Build:

    For each franchise territory and core service (water damage, fire damage, mold remediation, storm damage), create a location page following this structure:

    Header Section (Unique Local Content):

    • Opening paragraph: Local climate/risk profile + Rainbow’s response history in that area. “Denver’s high-altitude climate creates unique water damage challenges: rapid drying in low humidity but severe ice dam formation during freeze-thaw cycles. Rainbow Restoration has responded to 1,200+ water damage claims in the Denver metro since 2018, with an average response time of 38 minutes.”
    • Local expertise proof: State-specific certifications, regulatory requirements, insurance relationships. “Colorado requires mold remediation contractors to maintain IICRC S520 certification and comply with Colorado Dept. of Public Health guidelines. All Rainbow technicians are certified.”
    • Service area map: Embedded Google Map showing exact service territory polygons.

    Body Content (Problem-Solving Content):

    • Local problem scenario: “After the March 2024 ice storm, Denver experienced 400+ residential water damage claims from burst pipes. Here’s exactly what happened, what homeowners did wrong, and how to prevent it next time.”
    • Local process walkthrough: “Water damage restoration in Denver’s elevation and climate requires 3 specific adjustments to standard dehumidification protocols…”
    • Local regulation compliance: “Colorado’s water damage claims require documentation per CRS 10-4-1001…”

    CTA + Contact Section:

    • LocalBusiness schema with exact NAP, hours, phone, service area
    • Google Business Profile embed
    • 24/7 availability messaging (critical for emergency services)
    • Review count and rating display (builds trust before calling)

    Expected Results: Each location page should rank for 25-40 keywords within 60 days of launch. At 58 territories × 4 services × 30 keywords average = 6,960 new keywords. Combined with existing rankings, this gets Rainbow back toward the 58K keywords they had in October 2025.

    Phase 3: Content Architecture and Internal Linking (Week 4-8, Ongoing)

    This is how you make location pages work at scale: proper hierarchy and internal linking.

    The Three-Tier Hub Model:

    Tier 1: National Service Pillars (Authority anchors that rank for head terms)

    • /water-damage-restoration/ → “Water Damage Restoration: Complete Guide” (3,000+ words, comprehensive)
    • /fire-damage-restoration/ → “Fire Damage Restoration: Recovery Process”
    • /mold-remediation/ → “Mold Remediation and Removal Guide”
    • /storm-damage-restoration/ → “Storm Damage Restoration: What to Know”

    Each pillar page links to every state hub, accumulates backlinks, and passes equity down the hierarchy.

    Tier 2: State Hub Pages (Regional authority that bridges national and local)

    • /water-damage-restoration/colorado/ → Unique state content on climate, regulations, flood zones, seasonal risks
    • /water-damage-restoration/florida/ → Hurricane flood prep, saltwater intrusion, insurance nuances
    • etc. for every state where Rainbow operates

    Each state page links to all city pages within that state.

    Tier 3: City/Metro Pages (High-intent, revenue-generating)

    • /water-damage-restoration/colorado/denver/
    • /mold-remediation/colorado/denver/
    • /fire-damage-restoration/florida/miami/
    • etc. for all 58+ territories across all 4 services

    The Math: If Rainbow operates in 58 territories and 4 core services, that’s 232 city pages minimum. If each city page ranks for 25-40 keywords on average, that’s 5,800-9,280 keywords just from the location tier. Add the state and national tiers, and you’re back to 30K+ keywords organically.

    Internal Linking Rules:

    • Every pillar page links to all state hubs
    • Every state hub links to all city pages in that state
    • Every city page links back to its state hub and national pillar
    • Cross-service linking: The Denver water damage page links to the Denver mold page, etc.
    • Blog-to-location: Every blog post includes contextual links to 1-3 relevant location pages

    Phase 4: Content Tier Strategy — Crisis, Decision, Authority (Week 5-12)

    Location pages alone won’t cut it. Rainbow needs a three-tier content strategy that captures different stages of the customer journey:

    Tier 1: Crisis-Moment Content (The 2 AM homeowner in panic)

    People don’t search for “restoration companies” when their house is flooding. They search for “what do I do if my basement floods right now.”

    • “Basement Flooded: Emergency Steps in the First 30 Minutes”
    • “Burst Pipe Flooding My House: What to Do Before the Plumber Arrives”
    • “My Kitchen Caught Fire: Immediate Safety Steps and Next Actions”
    • “I Smell Mold But Don’t See It: Where to Look and When to Call a Pro”

    Format: Step-by-step numbered lists, HowTo schema, featured-snippet optimized. These convert because they’re the answer to someone’s worst day.

    Tier 2: Decision-Stage Content (The insurance call)

    • “Water Damage Restoration Cost 2026: Price Breakdown by Severity”
    • “Does Homeowners Insurance Cover Water Damage?”
    • “How to File a Water Damage Insurance Claim: Complete Guide”
    • “Water Mitigation vs. Water Restoration: Key Differences Explained”
    • “How Long Does Water Damage Restoration Take?”

    Format: Comparison tables, cost breakdowns, FAQPage schema. These convert because the person already knows they need professional help — they just need to choose who and understand the cost.

    Tier 3: Authority-Building Content (Builds domain trust and earns backlinks)

    • “Understanding IICRC Certification: What It Means for Your Restoration Company”
    • “The Science of Structural Drying: A Technical Deep Dive”
    • “2024-2026 Water Damage Claim Trends: Data Analysis by Region”
    • “Climate Change and Water Damage Risk: What the Data Shows”
    • “Building Code Compliance in Mold Remediation: State-by-State Requirements”

    Format: Long-form, research-backed, citations to EPA/FEMA/IICRC. These earn backlinks from industry publications and regulatory bodies, which flow authority through the site to location pages.

    Publishing Cadence: 2-3 Tier 1 posts/month (urgent, seasonal), 2-3 Tier 2 posts/month (decision support), 1 Tier 3 post/month (authority building).

    Phase 5: Schema Markup at Scale (Week 6-8)

    Rainbow probably has basic LocalBusiness schema on location pages. But there’s 10x opportunity in comprehensive schema implementation:

    Every location page needs:

    • LocalBusiness — NAP, geo-coordinates, service area polygon, hours, accepted payments
    • Service — Structured description of each service offered (water damage restoration, mold remediation, etc.)
    • FAQPage — Top 8-10 questions for that service/location combination with direct answers
    • HowTo — Step-by-step restoration process in structured format
    • AggregateRating — Star rating and review count from Google Business Profile

    Example LocalBusiness schema for /water-damage-restoration/colorado/denver/:

    {
      "@context": "https://schema.org",
      "@type": "LocalBusiness",
      "name": "Rainbow Restoration Denver",
      "image": "https://rainbowrestores.com/locations/denver/logo.jpg",
      "description": "Emergency water damage restoration, water mitigation, and structural drying in the Denver metropolitan area.",
      "address": {
        "@type": "PostalAddress",
        "streetAddress": "[actual address]",
        "addressLocality": "Denver",
        "addressRegion": "CO",
        "postalCode": "[zip]",
        "addressCountry": "US"
      },
      "geo": {
        "@type": "GeoCoordinates",
        "latitude": 39.7392,
        "longitude": -104.9903
      },
      "areaServed": {
        "@type": "GeoShape",
        "polygon": "39.5,-105.2 39.5,-104.6 40.1,-104.6 40.1,-105.2 39.5,-105.2"
      },
      "telephone": "+1-303-[number]",
      "url": "https://rainbowrestores.com/water-damage-restoration/colorado/denver/",
      "openingHoursSpecification": {
        "@type": "OpeningHoursSpecification",
        "dayOfWeek": ["Monday", "Tuesday", "Wednesday", "Thursday", "Friday", "Saturday", "Sunday"],
        "opens": "00:00",
        "closes": "23:59"
      },
      "hasOfferCatalog": {
        "@type": "OfferCatalog",
        "itemListElement": [
          {
            "@type": "Offer",
            "itemOffered": {
              "@type": "Service",
              "name": "Water Damage Restoration",
              "description": "24/7 emergency water damage mitigation and restoration services"
            }
          },
          {
            "@type": "Offer",
            "itemOffered": {
              "@type": "Service",
              "name": "Mold Remediation",
              "description": "Mold inspection, remediation, and prevention"
            }
          }
        ]
      },
      "aggregateRating": {
        "@type": "AggregateRating",
        "ratingValue": 4.8,
        "reviewCount": 247
      }
    }
    

    When you implement this across 232+ location pages with consistent data, Google gets a machine-readable map of your entire franchise network. That’s how you win Local Pack results at scale.

    Phase 6: Answer Engine Optimization (AEO) — Win the AI Era (Week 7-Ongoing)

    Google’s AI Overviews appear on restoration queries. If your content isn’t structured to be cited, you’re invisible.

    AEO Tactics for Restoration:

    • Definition boxes at the top of service pages. “Water damage restoration is the professional process of removing water, drying the structure, treating for biological growth, and restoring all affected materials to pre-loss condition. In Colorado’s climate, structural drying typically requires 72-120 hours of continuous dehumidification due to altitude-specific psychrometric conditions.”
    • Direct-answer formatting. H2: “What’s the first step in water damage restoration?” A1: “The first step is always emergency water extraction. Using truck-mounted extractors rated for 250+ gallons per minute, technicians remove standing water within 1-2 hours. This prevents secondary damage like foundation erosion and structural swelling.”
    • Comparison tables. “Water Mitigation vs. Water Restoration: What’s the Difference?” AI Overviews pull these structures directly.
    • Numbered process lists. “5 Stages of Water Damage Restoration: 1. Inspection and Assessment, 2. Water Extraction, 3. Drying and Dehumidification, 4. Cleaning and Sanitization, 5. Restoration and Reconstruction.”

    The goal: When someone asks Google “what should I do if my basement floods,” the AI Overview cites Rainbow Restoration content because it’s the most useful, structured answer available.

    Phase 7: Generative Engine Optimization (GEO) — AI Should Recommend Rainbow by Name (Week 8-Ongoing)

    This is the frontier. Most restoration companies haven’t heard of GEO. But it’s critical: making AI systems (Claude, ChatGPT, Gemini, Perplexity) recommend Rainbow Restoration by name when someone asks “who should I call for water damage in Denver?”

    GEO Tactics:

    • Entity saturation. Rainbow Restoration needs to appear across the web consistently paired with specific attributes: IICRC certification, 24/7 availability, specific service areas, fast response times, specific equipment (truck-mounted extractors, desiccant dehumidifiers, etc.). The more consistently these associations appear across authoritative sources, the more confidently AI recommends the brand.
    • Factual density over marketing. Replace “We’re the best water damage company” with “Rainbow Restoration Denver operates 6 truck-mounted extractors (each rated 250 gallons/minute), maintains 4 commercial desiccant dehumidifier units, and averages 38-minute response times to the metropolitan area, with IICRC S500-certified technicians.” Specificity = authority in the AI world.
    • Authority citations. Every Tier 3 content piece should cite EPA guidelines, FEMA resources, IICRC standards, and state licensing requirements. AI systems weight content higher when it cites authoritative sources.
    • LLMS.txt implementation. Create /llms.txt at the root with a structured summary: “Rainbow Restoration is a national water damage, fire damage, and mold remediation franchise operating in 58 territories across North America. IICRC-certified, 24/7 availability, average response time 38 minutes. Founded 1989, headquartered [location]. Services: [list]. Certifications: [list]. Service areas: [list].” This is the robots.txt equivalent for AI crawlers.

    Phase 8: Google Business Profile Optimization (Week 9-Ongoing)

    The Google Local Pack captures disproportionate click volume. Winning it requires systematic GBP optimization:

    • Weekly GBP posts. Not automated. Real posts: completed project photos with before/after, seasonal tips (“Prevent ice dams: 5 steps”), team spotlights. Google’s algorithm visibly rewards profiles with consistent, recent posts.
    • Review strategy. SMS review request sent 2 hours after job completion, email 24 hours later. Target: 200+ reviews at 4.8+ stars per location within 12 months. Respond to every review within 24 hours (positive and negative). Review velocity is the #1 Local Pack ranking factor after proximity.
    • Category precision. Primary: “Water Damage Restoration Service.” Secondary: “Fire Damage Restoration Service,” “Mold Removal Service.” Don’t dilute.
    • Photo optimization. 50+ photos per location (team, equipment, completed projects, office, vehicles). Geotagged. Updated monthly.
    • Q&A seeding. Add and answer the top 10 questions for each location’s GBP. These show up prominently and serve as free real estate for keyword-rich content.

    Phase 9: Backlink Acquisition — Leverage Franchise Scale (Week 10-Ongoing)

    Rainbow’s biggest competitive advantage: 58+ franchise locations. Most single-location competitors can’t match this scale. Use it.

    • Disaster response PR. After significant weather events, issue press releases to local media. “Rainbow Restoration Denver responded to 43 residential water damage claims during March 2026 ice storm, deploying 8 extraction teams across metro area.” Local news sites pick this up (high DA, high relevance, tons of backlinks).
    • Insurance partnerships. Rainbow is likely on preferred vendor lists for carriers. Each carrier relationship should include a backlink from their website (partner directory or “find a contractor” page).
    • Industry association profiles. IICRC.org, RestorationIndustry.org, state licensing boards — maintain active, detailed profiles across all of them. .org links carry serious authority.
    • Local civic backlinks. Every franchise location should systematically acquire 20-30 local backlinks: Chamber of Commerce, Better Business Bureau, Rotary Club, Little League sponsorships, etc. Automated systems can track these and alert franchises to apply.
    • Content partnerships. Co-create guides with local emergency management agencies. “How to Prepare Your Denver Home for Wildfire Season — by Rainbow Restoration and Denver Office of Emergency Management.” The .gov backlink flows serious authority.

    Phase 10: Stop the PPC Bleed (Weeks 1-52)

    Here’s the financial reality: Rainbow spent $1.18M on PPC in Q4 2025 and Q1 2026 combined. That’s annualized to ~$4.7M.

    At their pre-decline peak (Sep-Oct 2025), they had 58K keywords worth $309K/month in organic value — $3.7M annualized, delivered for free.

    The full playbook above, executed over 6 months, should recover $200-250K/month in organic SEO value. That’s $2.4-3M annualized in traffic they no longer need to buy.

    In 12 months, if they reach 50% of the old domain’s peak ($1.67M/month), they’ve reduced their PPC dependency by 75% permanently.

    This isn’t a cost center. This is a multiplying return where every dollar spent on SEO execution compounds while PPC spend evaporates the moment the budget runs out.

    What Makes Rainbow’s Story Different

    Desk with laptop, checklist notebook, and billing card ready before creating an Anthropic API key
    What makes Rainbow’s story different.

    This is the part I don’t see written about often enough:

    Rainbow Restoration had the courage to migrate domains. Most franchises are terrified of it. But brand repositioning — moving from “rainbow international” to “rainbow restoration” — is smart. It’s clear, it’s specific, it owns the vertical.

    The problem isn’t the rebrand. The problem is that the SEO execution didn’t match the ambition of the rebrand.

    They handed the customer $3.35M/month in annual organic value when they flipped the domain switch, and then didn’t rebuild it on the new domain with the same sophistication.

    They survived. They’re healthy. But they left the bigger prize on the table.

    The playbook above is what finishes the job. It’s not theoretical. It’s what we execute for restoration companies at Tygart Media. Every day. All day.

    If Rainbow wants to reclaim the $1.67M/month that’s sitting there waiting to be captured, the path is clear. It just requires finishing what the migration started.

    Frequently Asked Questions

    What happened to Rainbow Restoration’s old domain (rainbowintl.com)?

    Rainbow Restoration migrated from rainbowintl.com to rainbowrestores.com. The old domain is now essentially dead — it currently ranks for only 4 keywords with $0 in estimated SEO value. However, rainbowintl.com peaked at 109,000 organic keywords and $3.35M/month in SEO value (July 2022, January 2020 respectively). The migration was executed correctly from a technical standpoint (proper 301 redirects were implemented), but the new domain has only recovered to 33,700 keywords and $495,500/month, leaving 85% of peak organic value on the table.

    How much organic traffic did Rainbow lose in the migration?

    Rainbow didn’t lose all their traffic — that would indicate a failed migration. Instead, they recovered about 31% of their peak keyword count (109K → 34K) and 15% of their peak SEO value ($3.35M → $495K). The gap represents content that either wasn’t migrated, was redirected ineffectively, or hasn’t been rebuilt on the new domain with the same authority and comprehensiveness. The opportunity is enormous: recovering even 50% of the old domain’s peak represents $1.67M/month in organic value that’s currently being captured by competitors or left on the table entirely.

    Why did Rainbow’s organic traffic drop in December 2025?

    December 2025 saw a significant organic decline across the restoration vertical — both SERVPRO and 911 Restoration experienced similar drops in the same timeframe. This pattern indicates an algorithm update or market shift that disproportionately affected restoration company rankings. The timing is consistent with Google’s broader content quality and entity authority updates. However, Rainbow’s recovery pattern (slightly higher SEO value on fewer keywords in Feb 2026) suggests a value concentration effect, meaning their remaining rankings are capturing higher-intent, higher-CPC keywords.

    What is Generative Engine Optimization (GEO) and why does it matter?

    Generative Engine Optimization (GEO) is the practice of optimizing content and brand presence so that AI systems — ChatGPT, Claude, Gemini, Perplexity, and other large language models — cite and recommend your business by name when users ask relevant questions. For restoration companies, GEO involves consistent brand-attribute associations across the web (IICRC certifications, response times, service areas), factual density in content (specific equipment, process details) rather than marketing language, authoritative citations (EPA, FEMA, IICRC standards), and LLMS.txt implementation. As AI-generated answers increasingly replace traditional search results, GEO is becoming as critical as traditional SEO for driving qualified customer discovery.

    How long would it take to rebuild Rainbow’s organic traffic to pre-migration peak?

    A realistic timeline breaks down as follows: Technical fixes and initial schema/architecture implementation (weeks 1-6) typically yield 10-15% keyword growth and quick indexation improvements. Content hierarchy build-out and location page optimization (weeks 4-16) should drive 25-35% growth. Full content strategy execution across all three tiers (months 1-6) yields 40-60% recovery. Meaningful SEO value recovery ($200K+/month) should be visible within 3-4 months. Full recovery to 50% of peak ($1.67M/month) would require 8-12 months of sustained execution. However, 85% recovery (approaching the old domain’s peak) would likely require 18-24 months because you’re rebuilding content depth and authority that took years to accumulate.

    Is Rainbow Restoration’s PPC spending necessary?

    No — it’s a symptom, not a strategy. Rainbow’s combined Q4 2025 and Q1 2026 PPC spend was approximately $1.18M in just six months. This spending is directly correlated with their organic decline: as organic keywords and clicks fell, they compensated by buying traffic through Google Ads. However, organic traffic that was worth $309K/month (Sep-Oct 2025) becomes “free” traffic once recovered, while PPC spend evaporates the moment budgets are reduced. A 12-month SEO execution program that recovers $200-250K/month in organic value would reduce their PPC dependency by 50-70%, creating a permanent efficiency gain. The ROI case strongly favors organic investment over sustained PPC spending.

    The Closing Pitch

    Here’s the thing about Rainbow Restoration: they actually pulled off the hard part. They rebranded, they migrated domains, and they survived. Most franchise companies crater completely when they try this. Rainbow didn’t.

    But surviving isn’t winning. And right now, they’re leaving $1.67M per month in organic value on the table — value that their old domain earned, value that should have migrated with them, value that’s sitting there waiting to be reclaimed.

    The roadmap above isn’t theoretical. It’s the exact methodology we execute at Tygart Media — we eat, sleep, and breathe restoration SEO. We’ve built the AI-powered content pipelines, the schema automation systems, and the GEO frameworks specifically for this vertical. And we know the playbook works because we’re running it right now for other restoration companies.

    The data is public. The opportunity is clear. And the fix is an execution problem.

    So here’s my pitch, and I’ll keep it honest:

    Hey, Rainbow Restoration. If you made it this far reading, you already know what needs to happen — because the SpyFu numbers don’t lie. You had the courage to rebrand and migrate. Now you need the SEO execution to match that ambition.

    We’re Tygart Media. We’ve already built the playbooks and the systems to execute this at franchise scale. We’d genuinely love to have the conversation about what $400K/month in recovered organic value looks like when it’s back.

    No pressure. No predatory sales tactics. Just two teams who understand restoration marketing talking about finishing what the migration started.

    Reach out here. Or call. Or send a franchise location manager. We promise we won’t show up with a water truck unless your data indicates you actually have a water problem. In which case, we probably know a guy. (In fact, we probably know 58 guys.) 😄

    The Complete Restoration Franchise SEO Playbook Series

    This article is part of a 6-part series analyzing the SEO performance of every major restoration franchise in America. Read the full series:

    Work with Tygart Media

    Want this built for your restoration company?

    This playbook documents what we’ve implemented for real restoration operators. If you want a custom SEO and content strategy for your restoration business, this is what the engagement looks like.

    See How We Work →

  • If I Were Running Paul Davis Restoration’s SEO, Here’s What I’d Do Differently

    If I Were Running Paul Davis Restoration’s SEO, Here’s What I’d Do Differently

    The Machine Room · Under the Hood

    I’m about to do something that most agency owners would never do: tell you exactly what went wrong with one of restoration’s most strategic franchises.

    Not conspiracy theories. Not guesses. The actual data that explains why Paul Davis Restoration — a $2+ billion company with 600+ franchises across North America — lost half its organic keyword portfolio between November and December 2025.

    Why? Because I pulled their SpyFu data this morning, and what I found was different from the 911 Restoration story I told three weeks ago. This isn’t a domain in freefall. This is a franchise that was actually winning — growing their keyword portfolio from 39K to 50K through most of 2025 — and then tripped on the finish line.

    That’s not a systemic failure. That’s a fixable problem. And the recovery opportunity is enormous.

    The SpyFu Data: A Franchise That Peaked, Then Stumbled

    Restoration technicians training in a shop bay with equipment demo and whiteboard
    SpyFu data: a franchise that peaked, then stumbled.

    I pulled the full historical time series from the SpyFu Domain Stats API on March 30, 2026. Here’s what pauldavis.com looks like over the last 12 months:

    Period Organic Keywords Monthly Organic Clicks SEO Value ($/mo) PPC Spend ($/mo) Domain Strength
    Mar 2025 38,980 10,260 $370,100 $20,950 51
    Apr 2025 39,220 7,638 $387,500 $24,300 51
    May 2025 41,620 11,420 $431,000 $27,380 49
    Jun 2025 42,620 11,830 $450,200 $31,940 49
    Jul 2025 45,220 12,990 $482,800 $35,990 49
    Aug 2025 48,420 14,670 $532,800 $37,940 50
    Sep 2025 49,470 15,430 $491,200 $57,140 52
    Oct 2025 50,339 14,490 $484,200 $49,000 52
    Nov 2025 49,400 14,420 $484,300 $665,600 53
    Dec 2025 23,250 12,620 $372,400 $258,500 51
    Jan 2026 22,490 12,930 $365,100 $213,000 51
    Feb 2026 22,190 13,590 $952,800 $206,100 54

    Look at the trend. From March to October 2025, Paul Davis did exactly what every restoration company should be doing: they grew. 39K keywords → 50K keywords. $370K/month SEO value → $532K/month. That’s not a fluke. That’s execution. That’s a team running the playbook.

    Then November happened. PPC spend spiked to $665,600 — an 18.5x increase from October’s $49K. The same panic pattern I saw with 911 Restoration. And by December? Half the keywords vanished. 50K → 23K. That’s a 54% collapse in a single month.

    But here’s the thing that makes Paul Davis different than 911 Restoration: their SEO value per keyword is actually higher. At $43/keyword (based on Feb 2026 data), Paul Davis is ranking for higher-value keywords than most competitors in this space. That tells me they weren’t ranking for junk keywords. They were ranking for money terms — the ones that matter.

    Which means the fix isn’t a rebuild. It’s a recovery.

    What Actually Happened in Q4 2025: The Diagnostic

    Comparison of Claude how-to fit versus local service page fit for assistants
    What actually happened in Q4 2025 — the diagnostic.

    Let me be direct about what I think happened. A keyword collapse from 50K to 23K in a single month isn’t gradual content decay. That’s one of three things:

    Scenario 1: A location page massacre. Paul Davis has franchises everywhere — across all 50 states. If someone restructured the location page architecture, consolidated pages, or switched hosting/CMS without a clean redirect map, Google would have vaporized thousands of pages from the index overnight. Franchise sites live and die on location pages. Lose those, lose everything.

    Scenario 2: A technical issue that broke indexation. A rogue robots.txt rule, an accidental noindex tag at the template level, a CDN misconfiguration returning 404s to Googlebot — any of these can silently deindex thousands of pages while organic traffic is still flowing because cached versions serve users fine. You don’t notice until you check GSC and see “Excluded – currently not indexed” spiked by 50%.

    Scenario 3: The November Google Core Update hit harder than anticipated. Google dropped a core update in November 2025. If Paul Davis’s location pages are thin, templated content with minimal local differentiation, the update could have targeted them specifically. Combined with algorithm changes favoring AI-extracted answers and entity authority, thin content gets deprioritized fast.

    My money? Scenarios 1 and 3 combined. But I’d verify with data before doing anything permanent.

    Step 1: The 72-Hour Diagnostic Audit

    Before touching a single page, I need to know what’s actually broken.

    Day 1: Crawl and Index Validation

    I’d run Screaming Frog against the full pauldavis.com domain — every page, every redirect. For a 600-franchise network, I’m expecting 8,000-15,000+ URLs. I’m specifically looking for:

    • Redirect chains longer than 2 hops — These leak PageRank and slow crawl budget.
    • Orphaned location pages — Pages that exist but have zero internal links. If city pages aren’t linked from a parent hub, Google treats them as low-priority and deprioritizes crawling.
    • Canonicalization issues — A single bad canonical tag at the template level can tell Google to ignore thousands of pages simultaneously. This is the most common cause of sudden deindexation I see.
    • JavaScript rendering problems — If Paul Davis uses any client-side rendering for critical location content, I’d compare Screaming Frog’s text extraction vs. what a headless browser sees. Mismatch = indexation risk.
    • Soft 404 patterns — Pages returning 200 status code but with “not found” content structure. Googlebot gets confused. Pages don’t index.

    Day 2: Google Search Console Analysis

    I need 16 months of GSC data — the period before and after the collapse.

    Specifically:

    • Coverage report trends — Did “Valid” pages spike downward in November/December? Did “Excluded – currently not indexed” spike upward? The answer tells the story.
    • Performance by URL pattern — Segment by location pages, service pages, blog content. Which pattern lost the most impressions? If it’s /locations/*, it’s an architecture problem. If it’s /services/*, it’s content quality.
    • Exclusion reason breakdown — What’s excluding the pages? “Blocked by robots.txt”? “Crawled – currently not indexed”? “Redirect error”? Each reason points to a different root cause.
    • Query data comparison — Export top 5,000 queries from October 2025 vs. February 2026. Which keyword clusters disappeared? If it’s geo-modified queries (“water damage restoration [city]”), location pages are the problem. If it’s service-level queries, the content strategy failed.

    Day 3: Competitive Analysis

    I’d pull the same SpyFu data for SERVPRO, 911 Restoration, ServiceMaster, and Rainbow International. If all of them declined in November/December, it’s an industry-wide algorithm shift. If Paul Davis uniquely declined, it’s site-specific.

    Then I’d audit the top-ranking competitors for Paul Davis’s highest-value lost keywords. What does their architecture look like? How many location pages? What schema are they using? The answers tell me exactly what Google is currently rewarding in this vertical.

    The Recovery Strategy: Rebuild What Was Already Working

    Desk with laptop, checklist notebook, and billing card ready before creating an Anthropic API key
    The recovery strategy: rebuild what was already working.

    Here’s the critical insight: Paul Davis doesn’t need a redesign. They need a rescue. They proved they could rank for 50K keywords. Now I need to figure out what broke and fix it, then scale what was already working.

    Priority 1: Recover the Indexation Foundation (Days 1-30)

    This is the emergency phase.

    Canonical tag audit: If there’s a template-level canonical issue, it’s a one-line fix that could immediately un-exclude thousands of pages. I’d verify canonicals across 50+ representative pages from different URL patterns (locations, services, blog) and check GSC’s URL Inspection tool to see what Google actually crawled vs. what we think we served.

    Location page linking structure: I’d verify that every location page is explicitly linked from a parent hub page. No links = low crawl priority = Google ignores the page even if it’s technically valid. A simple site map regeneration or parent page update can fix this.

    Robots.txt validation: One bad rule and 90% of your site might be blocked from crawling. I’d audit the current robots.txt, compare it against historical versions (via Wayback Machine if needed), and remove any rules that shouldn’t be there.

    Redirect map cleanup: Any redirect chains longer than 2 hops get collapsed to 1-hop direct redirects. Every hop loses 10-15% of PageRank. In a franchise network with hundreds of redirects, this can be thousands of dollars in lost equity.

    Priority 2: Location Page Architecture Renaissance (Days 30-90)

    Now we rebuild what was working.

    Paul Davis has 600+ franchises. That’s 600+ locations that could have dedicated SEO landing pages. If they’re structured right, that’s 3,600+ pages (600 locations × 6 core services: water damage, fire damage, mold remediation, storm damage, sewage backup, dry cleaning/contents restoration).

    Each page needs:

    Locally-specific content that proves expertise. Not “water damage restoration in Houston” templated 500 words. I’m talking about: “Houston’s sub-tropical climate creates unique challenges — the combination of high humidity, frequent thunderstorms, and clay-based soil means water damage in Houston spreads faster than in drier climates. Our Houston team is trained on Gulf Coast moisture dynamics, local building codes, and Houston’s specific insurance requirements.” This signals to Google that the content is locally authoritative, not mass-produced.

    LocalBusiness schema with complete NAP + service area. Every location page needs JSON-LD marking up the franchise location with exact coordinates, service area polygon, hours (24/7 for emergency response), and a catalog of specific services with local pricing where available.

    Embedded Google Map. A map showing the service area reinforces local relevance and keeps users on-site instead of searching for competitors.

    Real project stories. “In March 2025, our Paul Davis team responded to a commercial water intrusion affecting 8,000 sq ft of office space in downtown Houston. Complete water extraction and structural drying completed within 48 hours.” Specificity builds trust with both users and algorithms.

    Priority 3: Content Depth Beyond Location Pages (Days 60-120)

    Now I add the layers that Google currently rewards.

    Crisis-moment content (targets the 2 AM searcher):
    – “What To Do When Your Basement Floods: A Step-by-Step Emergency Checklist”
    – “I Smell Mold In My House Right Now — What Should I Do First?”
    – “Fire Damage: What To Do In the First 24 Hours”

    These need HowTo schema, numbered steps, and definition boxes at the top for AI Overviews to extract. They capture intent before the decision to hire a pro is made.

    Decision-stage content (targets the insurance call):
    – “Water Damage Restoration Cost in 2026: A Regional Breakdown”
    – “Homeowners Insurance and Water Damage: What’s Covered and What Isn’t”
    – “Mold Remediation Timeline: Expectations From Day 1 to Completion”

    These need comparison tables, cost breakdowns, FAQPage schema. This is where Paul Davis wins against SERVPRO.

    Authority-building content (earns backlinks, builds topical authority):
    – “The Complete Guide to IICRC Certification Standards: S500, S520, and What They Mean”
    – “Understanding FEMA Flood Zones: How to Check Your Risk and What It Means for Insurance”
    – “Water Damage vs. Water Intrusion: Why the Distinction Matters (and What Your Insurance Company Cares About)”

    These earn backlinks from IICRC, FEMA, RIA, insurance publications, and local news outlets. Those links flow authority to location pages through internal linking.

    Priority 4: Schema Markup at Scale (Days 45-90)

    For a 600-franchise network, schema markup scales multiplicatively.

    Every location page needs:

    {
      "@context": "https://schema.org",
      "@type": "LocalBusiness",
      "name": "Paul Davis Restoration of [City]",
      "telephone": "+1-XXX-XXX-XXXX",
      "address": {
        "@type": "PostalAddress",
        "streetAddress": "[Street Address]",
        "addressLocality": "[City]",
        "addressRegion": "[State]",
        "postalCode": "[ZIP]"
      },
      "geo": {
        "@type": "GeoCoordinates",
        "latitude": "[LAT]",
        "longitude": "[LONG]"
      },
      "openingHoursSpecification": {
        "dayOfWeek": ["Monday", "Tuesday", "Wednesday", "Thursday", "Friday", "Saturday", "Sunday"],
        "opens": "00:00",
        "closes": "23:59"
      },
      "areaServed": {
        "@type": "City",
        "name": "[City], [State]"
      },
      "hasOfferCatalog": {
        "@type": "OfferCatalog",
        "itemListElement": [
          {
            "@type": "Offer",
            "@id": "https://pauldavis.com/[city]/water-damage-restoration/",
            "itemOffered": {
              "@type": "Service",
              "name": "Water Damage Restoration"
            }
          },
          {
            "@type": "Offer",
            "@id": "https://pauldavis.com/[city]/fire-damage-restoration/",
            "itemOffered": {
              "@type": "Service",
              "name": "Fire Damage Restoration"
            }
          }
        ]
      }
    }
    

    Service pages need Article + Service + FAQPage + HowTo (when applicable).

    When you implement this at scale across 3,600+ pages with consistent, accurate data, you’re giving Google a machine-readable map of every franchise location and every service offering. That’s how you dominate Local Pack results and organic search simultaneously.

    Priority 5: Google Business Profile Velocity (Ongoing)

    The Local Pack wins happen here.

    For every franchise location:

    • Weekly GBP posts — Real posts, not automated junk. Project summaries with before/after photos, seasonal preparedness tips, team spotlights. Google’s algorithm visibly rewards active, engaged profiles.
    • Review acquisition and response — Every location should hit 200+ reviews at 4.8+ stars within 12 months. SMS review request 2 hours post-completion, email 24 hours later. Respond to every review within 24 hours. This is the #1 Local Pack ranking factor after proximity.
    • Primary category precision — “Water Damage Restoration Service” as primary. Secondary categories should reflect the strongest service mix for that region.
    • Photo pipeline — 50+ geotagged photos per location updated monthly. Team, equipment, completed projects, office, vehicles. Google prioritizes profiles with fresh, diverse visual content.

    Priority 6: Answer Engine Optimization for the AI Age (Days 60-120)

    Google AI Overviews now dominate informational restoration queries. If your content isn’t structured to be cited, you’re invisible.

    Definition boxes — Every service page opens with a 50-word authoritative definition. “Water damage restoration is the professional process of returning a property to its pre-loss condition following water intrusion from flooding, burst pipes, or precipitation. It encompasses emergency water extraction, structural assessment and documentation, industrial-grade dehumidification, antimicrobial treatment, and full restoration of affected materials.”

    Direct-answer formatting — H2s as questions, answered completely in the first 50 words. “How much does water damage restoration cost? The average cost ranges from $2,000 for minor localized damage to $25,000+ for significant structural involvement, with most homeowners paying $5,000-$15,000. Your final cost depends on the square footage affected, severity of damage, materials involved, and necessary structural repairs.”

    Comparison tables — “Water Mitigation vs. Water Restoration: Key Differences.” Side-by-side comparison of timeline, cost, scope, and outcomes.

    Numbered process lists — “The 5 Stages of Water Damage Restoration: 1. Emergency Response and Assessment, 2. Water Extraction and Removal, 3. Drying and Dehumidification, 4. Cleaning, Sanitizing, and Antimicrobial Treatment, 5. Restoration and Reconstruction.” This format wins HowTo rich results and AI Overview citations.

    Priority 7: The PPC Dependency: From $665K Spike Back to Baseline (Immediate)

    The November 2025 PPC spike to $665,600/month tells a clear story: organic pipeline broke, paid ads compensated.

    Here’s the math:

    • October 2025: $484,200/month organic value, $49K PPC spend. Healthy ratio.
    • November 2025: $484,300/month organic value, $665,600 PPC spend. Panic mode — the algorithms changed mid-month and they flooded with paid to keep revenue up.
    • Current: $952,800/month organic value (February 2026), $206,100 PPC spend. Recovery mode, but still elevated PPC.

    The strategic move isn’t to cut PPC cold turkey. It’s to systematically shift budget back to organic as rankings recover:

    • Months 1-3: Maintain current PPC as organic recovery actions take effect. Target high-intent paid keywords that should be ranking organically but aren’t.
    • Months 4-6: As location pages recover and start ranking, reduce PPC spend by 20-30% on those keywords and reinvest savings into content creation.
    • Months 6-12: If organic recovery hits 60%+ of the pre-November level, reduce PPC spend by another 50%.

    The goal: In 12 months, get back to a $50K-75K/month PPC baseline (for new market testing and seasonal peaks) while organic carries the core demand.

    That $206K/month in current PPC spend? Reinvested in organic SEO gives you a 8-12 month payoff at which point that traffic is free for the next 5 years.

    Why Paul Davis’s Recovery is Easier Than 911 Restoration’s Rebuild

    Here’s the critical difference:

    911 Restoration peaked at 4,466 keywords in July 2024. By March 2025 when we wrote the playbook, they were down to 3,306. Now (February 2026) they’re at 816. They’ve been declining for 20+ months. The recovery path is long.

    Paul Davis peaked at 50,339 keywords in October 2025 — last year. They were still growing in September. The fundamental SEO infrastructure that generated 50K keywords is still there. The content is still there. The domain authority is still there (54, up from 51 in March).

    The problem is fixable because the foundation is recent and sound. It’s not a rebuild. It’s a bounce-back.

    With the 7-step strategy above, here’s what I’d expect:

    • Month 1-2: Technical fixes and canonicalization repair shows up in GSC coverage. Expect 500-1,000 re-indexed pages.
    • Month 2-3: Location page architecture updates and schema implementation. Expect rankings to improve on the most valuable pages first.
    • Month 3-6: New content layers (crisis-moment, decision-stage) start ranking. Keywords begin recovering. Conservative estimate: 35,000-40,000 keywords by June.
    • Month 6-12: Full content architecture matures. Location pages reinforce each other through internal linking. Authority content earns backlinks. Expect 45,000-50,000 keywords recovered.

    That trajectory puts Paul Davis back to $450K+/month organic value within 12 months, which means cutting PPC spend from $206K to $50-75K and freeing up $150K+/month in marketing budget that can be reinvested in growth.

    The Playbook Works Because Paul Davis Proved It Works

    The reason I’m confident in this recovery isn’t theory. It’s data. Paul Davis demonstrated they could execute SEO at scale — they grew from 39K to 50K keywords over eight months. That’s not luck. That’s a team running a good playbook.

    The November collapse wasn’t a signal that the playbook failed. It was a signal that something broke in execution — a technical issue, a structural change, an algorithm shift.

    But the foundation is there. The domain authority is there. The franchise network is there. All that’s missing is the diagnostic (days 1-3), the fix (days 4-30), and then doubling down on what already works (months 2-12).

    I’ve built the systems to execute this at franchise scale — the AI-powered content pipelines, the schema automation, the GEO optimization frameworks. And honestly? Watching a company that was actually winning bounce back is far more satisfying than watching a company rebuild from 800 keywords.

    Frequently Asked Questions

    What caused Paul Davis Restoration’s 54% keyword drop in December 2025?

    Based on the data pattern — a collapse from 50K to 23K keywords in a single month, combined with a spike in PPC spending — the most likely causes are a location page architectural change without proper redirects, a technical indexation issue (robots.txt, noindex tag, or CDN misconfiguration), or the November 2025 Google Core Update hitting thin location pages specifically. The best way to confirm is through a 72-hour audit of GSC coverage data (checking when “Excluded – currently not indexed” spiked) and a URL crawl to identify redirect errors, orphaned pages, or canonicalization issues.

    Why is Paul Davis’s SEO value higher per keyword than other restoration companies?

    Paul Davis has an estimated SEO value of $43/keyword ($952,800 ÷ 22,190 keywords in February 2026), compared to SERVPRO’s $33/keyword. This suggests Paul Davis is ranking for higher-value, higher-intent keywords — likely more commercial terms and geo-modified queries rather than informational content. It’s a quality-over-quantity advantage: fewer keywords, but more profitable ones. This is actually the ideal position for recovery, since restoring 5,000 high-value keywords is more profitable than restoring 20,000 low-value ones.

    How should Paul Davis balance PPC spending during SEO recovery?

    Don’t cut PPC immediately — that leaves money on the table and risks losing customers to competitors during the recovery window. Instead, maintain current PPC baseline (around $206K/month) during the first 60-90 days of recovery actions, then systematically shift budget to organic as rankings improve. A realistic timeline: reduce PPC by 20-30% by month 6 (when organic is recovering), then by another 50% by month 12 (when organic has achieved 60%+ recovery). This keeps revenue stable while investing in the long-term organic channel.

    What’s the difference between Paul Davis’s situation and 911 Restoration’s?

    911 Restoration has been declining for 20+ months (peaked July 2024 at 4,466 keywords, now at 816). It’s a comprehensive, systemic failure requiring a full rebuild. Paul Davis peaked in October 2025 (50,339 keywords) and collapsed sharply in November/December — suggesting a fixable technical or structural issue rather than a fundamental SEO failure. Paul Davis’s recovery is faster and more straightforward because the foundation (domain authority, content corpus, franchise network) is recent and proven to work. It’s a bounce-back, not a rebuild.

    How important is location page optimization for franchise restoration companies?

    It’s the engine of the entire strategy. If Paul Davis has 600 franchises across 6 core services, that’s 3,600+ location-service pages. A well-optimized location page can rank for 15-40 related keywords through local modifiers, long-tail variants, and service-specific searches. The math: 3,600 pages × 15 keywords average = 54,000 potential ranked keywords. Paul Davis currently has 22,190, meaning they have capacity for 32,000+ additional keyword rankings just by optimizing what exists. Location pages are where restoration companies win.

    What is Generative Engine Optimization (GEO) and why does Paul Davis need it?

    GEO is optimizing content so that AI systems — ChatGPT, Claude, Gemini, Google AI Overviews, Perplexity — cite and recommend your business by name. For restoration, GEO involves entity saturation (consistent brand-attribute associations across the web), factual density (specific claims about IICRC certification, response times, service areas), authoritative citations (EPA, FEMA, IICRC standards), and implementing LLMS.txt to guide AI crawlers. As AI-generated answers increasingly replace traditional search results, GEO becomes as important as traditional SEO. Paul Davis needs GEO to win when someone asks an AI system “who should I call for water damage in Houston?”

    What’s the realistic timeline for Paul Davis to recover to 40,000+ keywords?

    Based on the severity of the collapse (54% in one month) but the strength of the foundation (recent peak, high domain authority, proven content infrastructure), I’d estimate:

    • Month 1-2: Technical fixes and indexation recovery (expect 1,000-2,000 page re-indexing)
    • Month 3-6: Location page optimization and new content layers take effect (expect climb from 22K to 35,000-40K keywords)
    • Month 6-12: Full architecture maturity and authority building (expect 45,000-50,000 keywords)

    The path is faster than 911 Restoration because the problem is fixable, not systemic.


    There’s a reason I’m telling you all this instead of keeping it proprietary. Paul Davis Restoration was doing it right through most of 2025. They hit 50K keywords because they executed a real strategy at real scale. Then something broke. But broken things can be fixed.

    We’re Tygart Media. We build the systems that execute this playbook for restoration companies at franchise scale. We’ve already figured out the location page architecture, the schema automation, the content velocity pipeline, the GEO optimization. And honestly? Helping a company that knows how to execute bounce back is exactly the kind of project we live for.

    The data is public. The opportunity is real. And the timeline for recovery is tight — every month without action is another month where competitors gain ground.

    Reach out here if you want to have the conversation. Or don’t. But at least you’ll know what’s possible.

    (And hey, if you actually do have a water damage emergency while you’re thinking about this, we can recommend a Paul Davis location. We probably know a guy. Actually, at this point, we’ve worked with enough franchises that we definitely know a guy.)

    The Complete Restoration Franchise SEO Playbook Series

    This article is part of a 6-part series analyzing the SEO performance of every major restoration franchise in America. Read the full series:

    Get Your Free Restoration SEO Playbook

    This is the same competitive analysis we run for restoration companies across the country. Submit your company URL below and we’ll put together a version specific to your market — no cost, no pitch call required.