What is a solar energy dashboard? A solar energy dashboard is a monitoring interface — software, web-based, or mobile — that aggregates real-time and historical data from a solar photovoltaic system. At minimum, it displays energy production (kWh generated), consumption (kWh used), grid export/import, and battery state-of-charge if storage is present. More sophisticated dashboards track weather correlation, financial ROI, carbon offset, and predictive production forecasting.
When we first put solar panels on the building, I did what most people do: checked the app for a week, thought “neat,” and then basically forgot it existed. The panels were doing their thing. The bill was lower. Life was good.
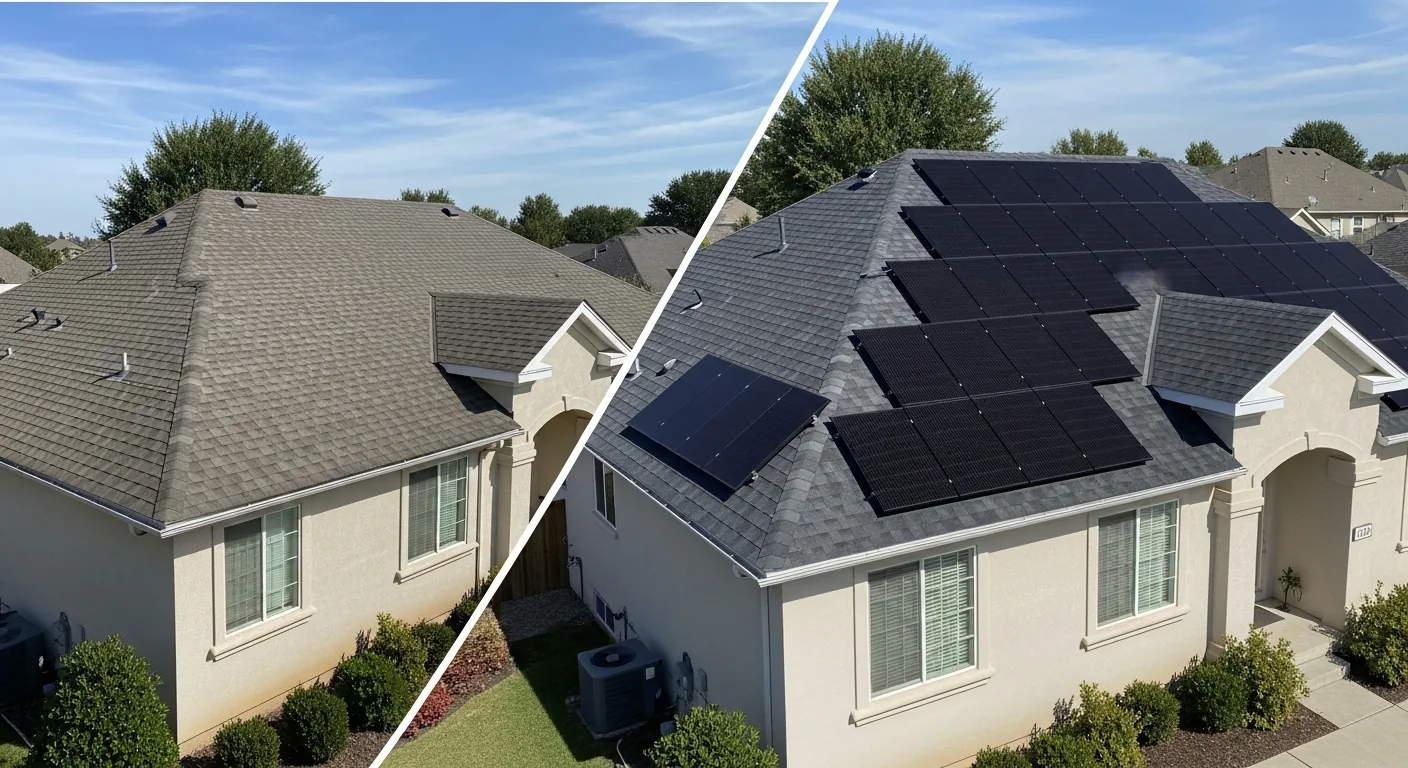
Then one month the savings were noticeably smaller. Turned out two panels had a shading issue from a newly grown tree branch that hadn’t been there during installation. The installer’s default app hadn’t flagged anything because it was tracking overall system performance, not per-panel performance. I’d lost weeks of production I didn’t know I was losing.
That’s when I started building a real solar monitoring dashboard. Not because I wanted another screen to look at — because the default visibility was too coarse to catch real problems.
What a Solar Energy Dashboard Actually Needs to Show You
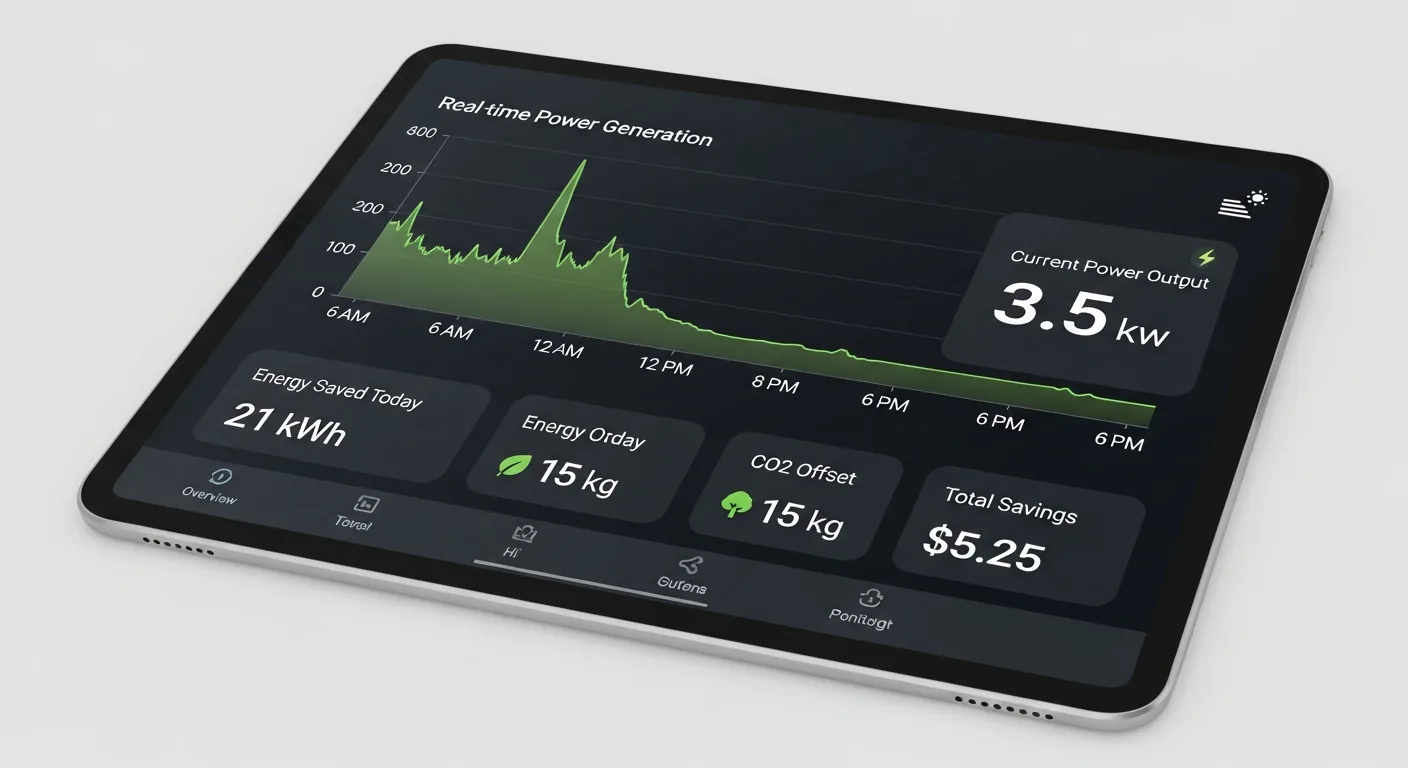
Most manufacturer apps show you the basics: how much power you’re producing right now, how much you’ve produced today, and maybe a graph of production over time. That’s not nothing — but it’s not enough to actually manage a solar system intelligently.
A useful solar energy dashboard tracks these four data streams:
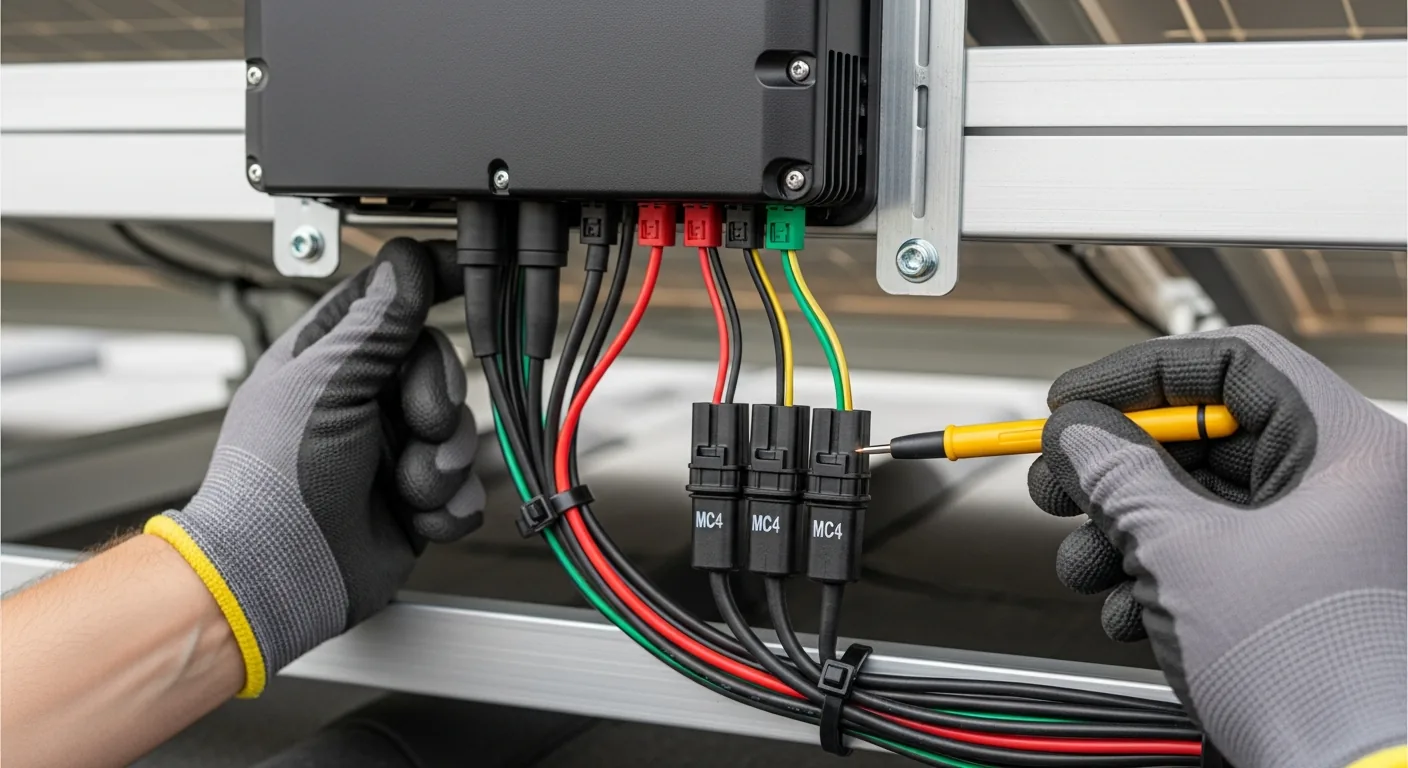
Production. How much energy your panels are generating, in real-time (watts) and cumulative (kWh). This should be broken down by inverter string or panel group where your hardware supports it — aggregate production numbers hide individual panel or string underperformance.
Consumption. How much energy your building or home is using. Without consumption data, you can’t calculate self-consumption rate — the percentage of your solar production that you’re using directly rather than exporting to the grid. Self-consumption rate is the most important efficiency metric in solar systems that don’t have battery storage.
Grid interaction. How much you’re importing from the grid (when solar isn’t covering demand) versus exporting (when solar is producing more than you’re using). In net metering arrangements, your utility credits you for exports — your dashboard should show you the financial value of that in real terms, not just kilowatt-hours.
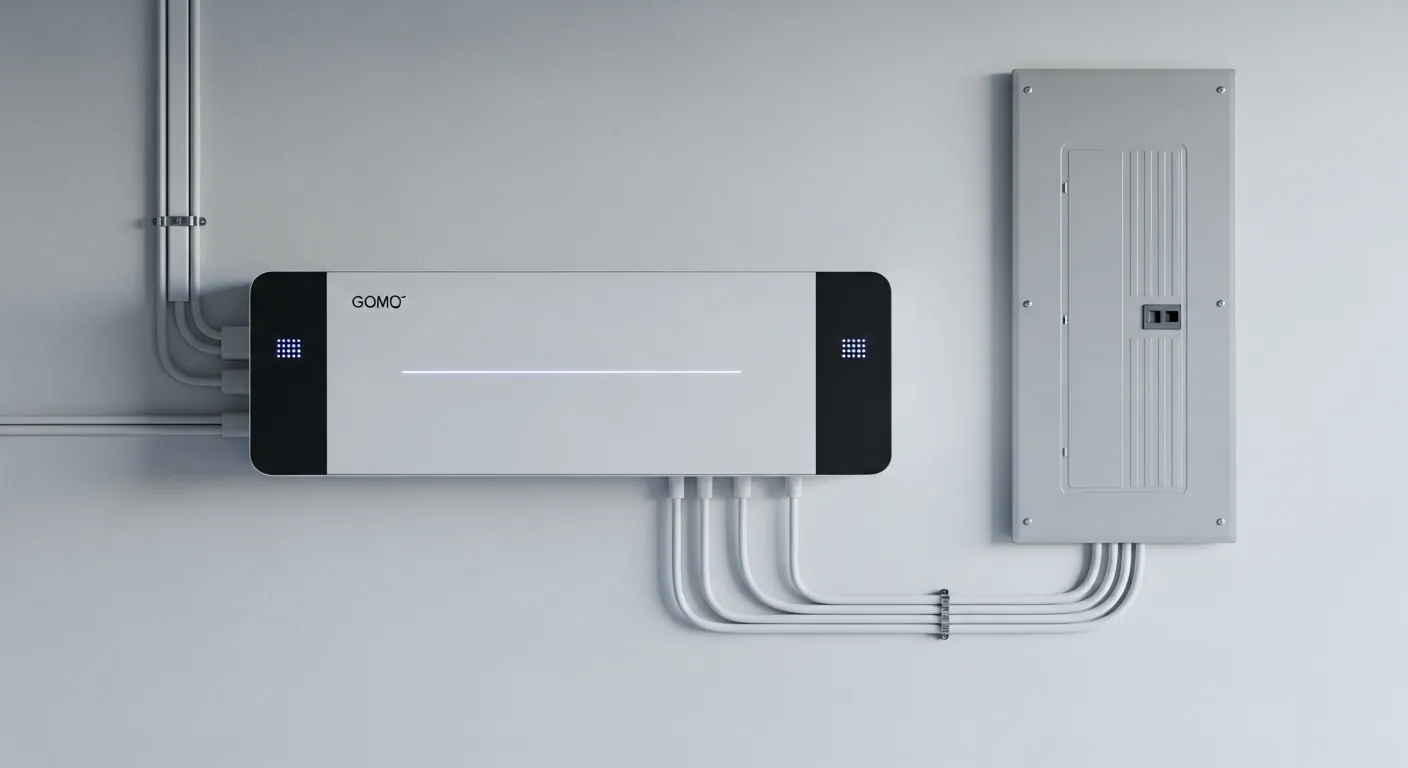
Battery state. If you have battery storage (Tesla Powerwall, Enphase IQ Battery, or similar), real-time state-of-charge and charge/discharge rate is critical. A battery dashboard tells you whether your storage strategy is working — are you filling the battery during peak production and discharging during peak rate hours?
How to Build a Solar Energy Monitoring Dashboard
Your path depends on what hardware you have. Most modern inverters and monitoring systems expose an API or local data feed that you can pull into a custom dashboard.
- Identify your data sources. What inverter brand do you have? Enphase, SolarEdge, Fronius, SMA, Huawei, and most other major brands have APIs — either cloud-based or local. Your installer’s documentation should list what data is accessible. If you have a smart meter or energy monitor (Emporia, Sense, Shelly EM), that’s your consumption data source.
- Choose your dashboard platform. Home Assistant is the most popular open-source option for residential systems — it has native integrations for Enphase, SolarEdge, and most major brands. Grafana is more powerful for custom visualization but requires more technical setup. If you want something with zero code, Powerwall owners get Tesla’s native app, and Enphase users get Enlighten — but both are read-only with limited customization.
- Set up data collection. For Home Assistant, install the relevant integration (e.g., the Enphase Envoy integration), configure your inverter’s local or cloud credentials, and set up data logging via InfluxDB or the native recorder. For Grafana, you’ll need a data collector (often Prometheus or InfluxDB) pulling from your inverter API on a 60-second interval.
- Build the panels. Start with five core panels: current production (gauge or power flow diagram), today’s production vs. expected (based on historical and weather), self-consumption rate, grid import/export balance, and a 30-day production trend. Everything else is bonus once these are working.
- Add alerting. This is the part most people skip — and the part that makes the dashboard actually useful. Set up alerts for: production dropping below expected by more than 15% (possible panel issue), grid import spiking unexpectedly during production hours (consumption anomaly), and battery not reaching target state-of-charge by end of day.
The Metrics That Actually Tell You Something
Raw kWh numbers are vanity metrics without context. These are the ratios and derived metrics that make a solar dashboard genuinely useful:
Performance Ratio (PR). Actual energy produced divided by theoretical maximum production given your panel specs and measured irradiance. A healthy system runs 75-85% PR. If you’re consistently below 70%, something is wrong — shading, soiling, inverter clipping, or equipment degradation.
Specific Yield. kWh produced per kWp of installed capacity, measured daily. This normalizes production across different system sizes and lets you compare your system’s performance against regional averages and your own historical baseline.
Self-Consumption Rate. The percentage of your solar production consumed directly by your building versus exported to the grid. For systems without battery storage, you want this above 60% — if it’s lower, you’re producing energy at times when you can’t use it, and your net metering credit rate is probably lower than what you’d save by consuming it directly.
Avoided Cost. What your solar production would have cost you at retail electricity rates. This is the most motivating number on the dashboard — it converts physics (kWh) into money (dollars), and it makes the ROI tangible every single day.
Local vs. Cloud: Which Dashboard Approach Works Better
There are two architectural choices for a custom solar dashboard, and the right one depends on your hardware and how much control you want over your data.
Cloud-first dashboards (Enphase Enlighten, SolarEdge monitoring portal, Tesla app) give you zero setup — data flows automatically from your inverter to the manufacturer’s servers, and you get a polished interface immediately. The tradeoff: you’re dependent on the manufacturer’s infrastructure, the data granularity is capped at what they choose to expose, and you can’t customize what you see or set up your own alerts.
Local-first dashboards (Home Assistant, Grafana + InfluxDB, Node-RED) give you complete control. Most modern inverters expose a local API — the Enphase Envoy, for example, has a local REST endpoint that returns per-microinverter production data at 5-minute intervals without any cloud dependency. Pull that into a local time-series database and you can build exactly the view you want, with exactly the alerts that matter to you.
The main limitation of local-first monitoring is weather correlation — you need a separate weather data source (OpenWeatherMap works fine at the free tier) to calculate expected production versus actual production on any given day. Once you have that layer, the dashboard tells you not just what your system produced, but whether it produced what it should have given the day’s conditions. That’s the difference between a readout and a diagnostic tool.
Frequently Asked Questions About Solar Energy Dashboards
What is a solar energy dashboard?
A solar energy dashboard is a monitoring interface that displays real-time and historical data from a solar photovoltaic system, including energy production, consumption, grid import/export, and battery state-of-charge. It helps system owners verify performance, catch problems early, and calculate financial returns.
What data should a solar monitoring dashboard display?
At minimum: current and cumulative production (kWh), current consumption, grid import/export balance, and performance ratio compared to expected output. Advanced dashboards add per-panel performance, weather correlation, self-consumption rate, avoided cost calculations, and battery charge/discharge history.
What is the best free solar monitoring dashboard?
Home Assistant with the relevant inverter integration (Enphase, SolarEdge, Fronius, etc.) is the most capable free option for residential systems. It supports local API connections, historical data logging, and custom dashboards without requiring a subscription. Grafana is more powerful for custom visualization but requires more technical setup and a separate data collection layer.
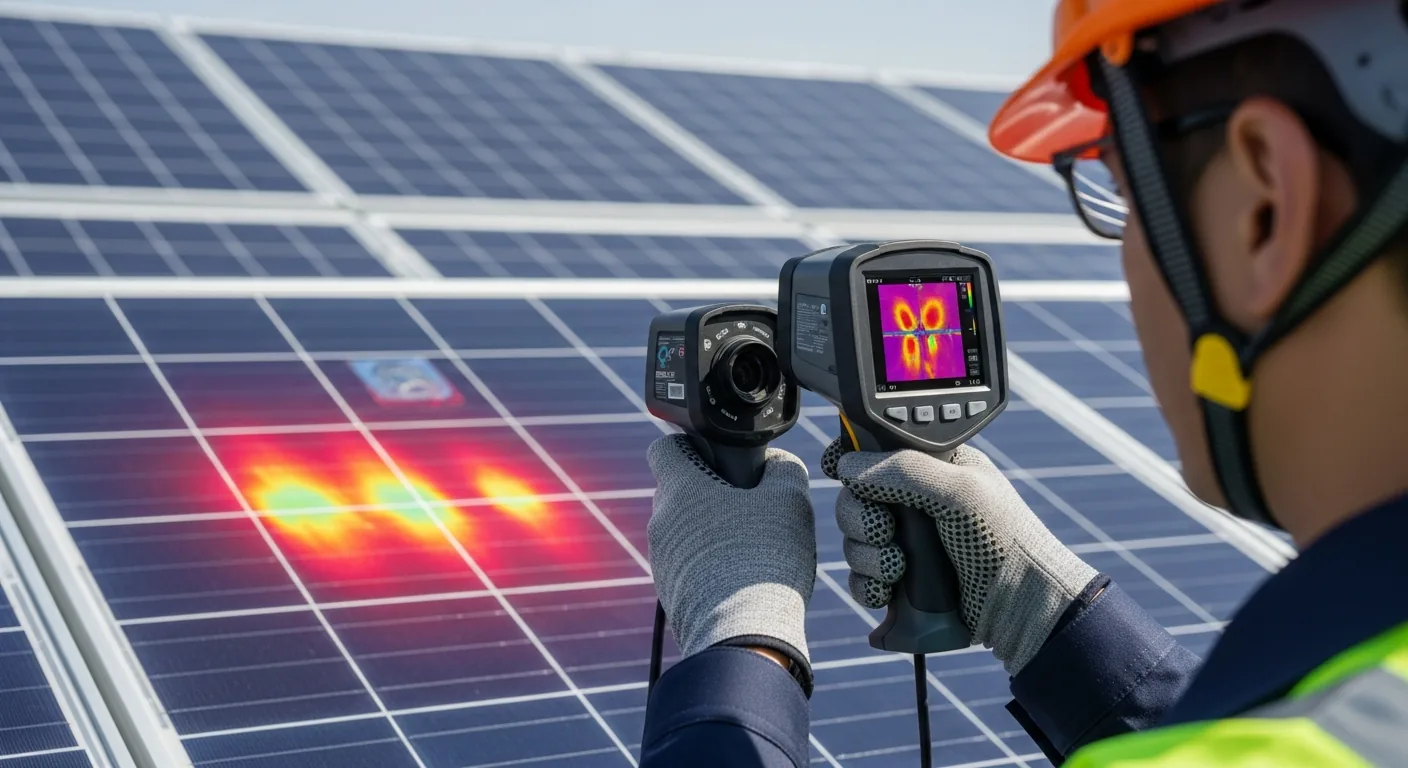
How do I know if my solar panels are underperforming?
Compare your actual daily production against expected production given your system’s rated capacity and the day’s measured solar irradiance. A Performance Ratio consistently below 70% indicates underperformance. Per-panel monitoring (available on microinverter systems like Enphase) can pinpoint which individual panels are underperforming and by how much.